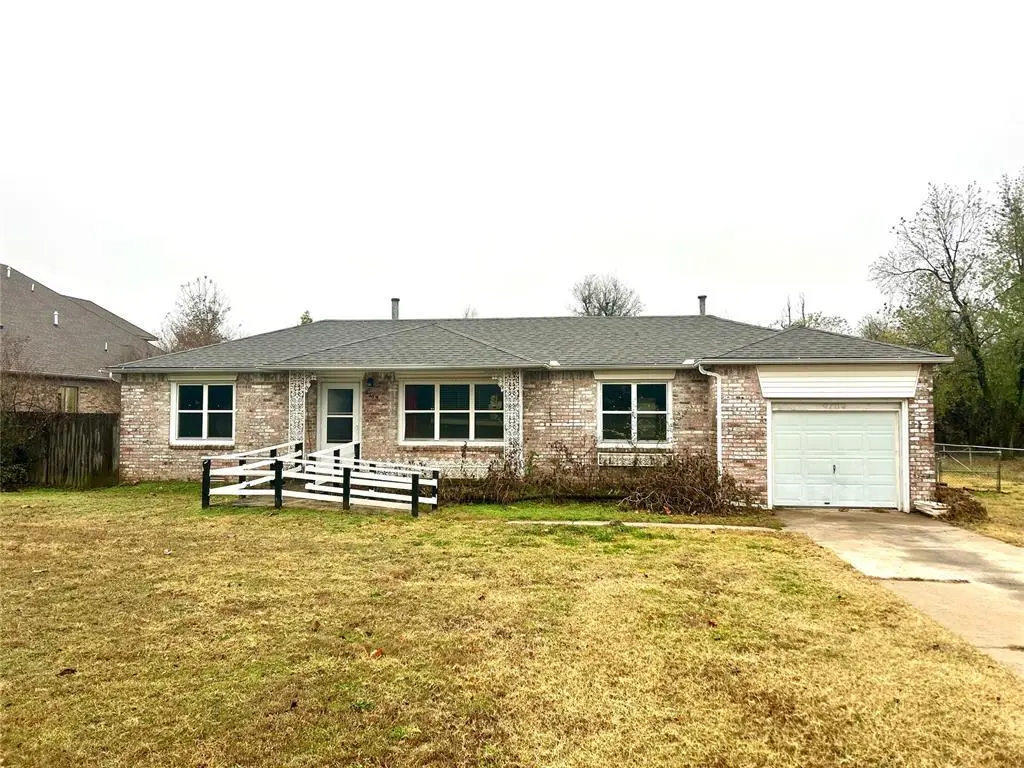
9704 E Reno Ave · Midwest City, OK
Flood risk 1/10 · Minimal
- FEMA flood zone
- X (unshaded)
- Chance of flooding over 30 yrs
- 0.0%
- Est. flood insurance / yr
- $507 – $1,088
Fire risk 1/10 · Minimal
- Est. fire insurance / yr
- $2,463 – $4,575
Heat risk 5/10 · Moderate
- Hot days now (above 107°F)
- 7 days/yr
- Hot days in 30 yrs
- 18 days/yr
Wind risk 3/10 · Minor
- Chance of severe wind over 30 yrs
- 5.0%
Air-quality risk 2/10 · Minimal
- Unhealthy air days now
- 1 days/yr
- Unhealthy air days in 30 yrs
- 2 days/yr
Risk factors via First Street. Map © Google.
Why this score? — see what drove the D- grade
The composite is a weighted blend of 9 inputs, each scored 0–100. Each bar is that input's sub-score; the figure is the points it added to the 100-point composite (weight × sub-score).
- Cash flow +18.6/30.0
- DSCR +5.9/10.0
- 1% rule +4.3/10.0
- Rent growth +3.9/5.0
- Livability +3.6/5.0
- Condition / age +2.5/5.0
- Schools +1.2/10.0
- ARV discount +0.0/15.0
- Appreciation +0.0/10.0
$126,500
🖨 Deal sheet 📄 Offer letter ✓ Due diligence
Listing remarks MLS
Brick home with newer, dual pane windows. Attached 1 car garage. Tenant occupied. Central heat & air conditioning. Stove, vent hood, garbage disposal.Located on .60 acres on Reno Avenue! House next door, also on .60 acres is also offered for sale. Potential for commercial!
Key facts
- Near dining
- Near shopping
- Large yard
Tags
Property features AI
Finance
- Other: Property is not homesteaded; Directions: From Douglas Blvd, turn east on Reno Ave. Property is on the right in 0.7 miles.
- Financial info: Not assumable
- HOA & community: No mandatory association dues
Exterior
- Parking: 1-car garage
- Utilities: Living area per assessor: 1,058
- Home design: Single family residence; One level; Residential property
- Construction: Brick construction; Composition roof; Slab foundation; Built (existing)
- Exterior features: Covered porch; Outbuildings; Lot described as Other
Interior
- Bedrooms: 3 bedrooms
- Bathrooms: 1 full bathroom
- Heating & cooling: Electric heating
- Interior features: One living area; No fireplace; Existing property
Neighborhood map
What this means for you Summary
Snapshot
- This is a 2-bed/1.0-bath single-family listed at $126k.
Deal economics
- At list price, monthly cash flow is $124 ($1k/yr) — positive.
- The deal already cash-flows at list — no discount required.
- To meet the 1% rule (rent ≥ 1% of price), the offer needs to be $117k (7.3% below list).
- Recommended offer: $117k (7.3% below list) — sets the bar for 1% rule.
- Cap rate 7.5% vs local median 5.6% in Midwest City — top-decile yield for the area; either an underpriced asset or a hidden risk that comps aren't pricing in. Stress-test before assuming the spread holds.
Location & tenants
- Location reads 71/100 on livability (#30 in OK) — a middle-class / working-renter tenant base. Strengths: cost of living A+, housing A+, health & safety A; Watch: crime D+, employment D, amenities F.
- Midwest City-Del City (suburban): math 10% / reading 17% proficiency, ranked #231 of 270 in OK (top 86%) — low school quality limits family demand, transient renter base, plan for 1-2y turnover.
- Zoned schools: Soldier Creek Es (math 17% / reading 20%, grade F, #530 of 845 statewide, top 63%, 910 students, 0% FRL); Carl Albert Hs (math 16% / reading 33%, grade F, #150 of 447 statewide, top 48%, 1,115 students, 0% FRL) — zoned schools average 0% FRL vs 57% district-wide (57 pts lower); this property's tenant base skews higher-income than the district average.
- Market conditions: Rents rising fast (+5.7%/yr); 160 active listings in the ZIP; 20 comparable units currently listed for rent nearby; rentals at typical pace (median 17d on market — plan ~3-4 weeks tenant-placement turnaround); 5,365 units permitted in Oklahoma County in 2024 (569 in 5+ unit buildings).
Forward outlook
- Local home prices are declining (-3.0%/yr); year-one equity from $875 of loan paydown is wiped out by about $4k of value loss. Plan a longer hold.
- Oklahoma County population projected at +41% by 2050 — long-run rental-demand tailwind backs the buy-and-hold thesis.
Negotiation context
- It's been on market 28 days — a 2% lower offer ($125k) is reasonable based on typical stale-listing flexibility.
- 3 sale attempts since 6y ago with the ask held roughly flat each time — persistent listings suggest the price (not the market) is what's stuck; bring a comps-based counter.
Risks & watch-outs
- Watch-outs: built in 1956 — expect roof / HVAC / electrical / plumbing capex.
- Climate carrying-cost: extreme-heat days projected 7→18/yr by 2055 (HVAC capex compounding) — expect insurance premiums to compound above CPI over the hold.
Questions for the listing agent
- Built in 1956 — when were the roof, HVAC, electrical panel, plumbing, and water heater last replaced?
- Is there a deadline driving the sale (1031 exchange, divorce, estate, relocation)? That informs how much negotiation room exists.
- Schools are D-rated, which usually means shorter tenancies and higher turnover. Who's the typical renter profile here, and what's been the actual vacancy rate?
- Crime grade is D in this area — have there been break-ins, vandalism, or insurance claims at this property in the last 3 years? What carrier currently insures it and at what premium?
- The area grade is low — what's the realistic commute time and amenity access for the typical tenant pool here? Any planned neighborhood developments (good or bad) we should know about?
- What's the average days-on-market for RENTAL listings here right now (not sales)? A rising rental-DOM trend means longer vacancies and softer asking-rent achievability than the comps imply.
- What's the recent tenant-quality profile in this submarket — average credit score on applications, eviction rate, late-payment / NSF rate, and stable-employment percentage? A property-management company in the area should have these aggregated.
- How much new for-sale + rental construction is in the pipeline within 1–3 miles? Heavy new supply typically softens prices + rents 12–24 months out; constrained supply supports both.
Investment metrics
- 1% rule
- 0.93% ✗
- Cap rate
- 7.47%
- Cash-on-cash
- 4.19%
- DSCR
- 1.19
- GRM
- 9.0
CMA / ARV
- ARV (on-the-fly)
- $90,712
- Comps found
- 3
Show comp detail 3 sales within ~0.75 mi
| Address | Dist | Beds/Ba | Sqft | Sold | Price | $/sf | Match |
|---|---|---|---|---|---|---|---|
| 9626 SE 4th St | 0.18mi | 2/1.0 | 720 (-8%) | 8mo | $60,000 | $83 | 72 |
| 9620 SE 4th St | 0.19mi | 2/1.0 | 872 (+12%) | 6mo | $141,000 | $162 | 67 |
| 609 N Post Rd | 0.70mi | 2/1.0 | 782 (0%) | 7mo | $91,000 | $116 | 61 |
Match score weights: distance 35% · size 25% · config 20% · recency 20%. Top-matched comps best support the ARV.
Projected returns pro-forma
-3.0% appreciation · 5.73% rent growth · sell at horizon
- IRR
- -7.0%
- Equity multiple
- 0.74×
- Total profit
- $-9,341
- Equity at exit
- $18,862
- IRR
- 5.6%
- Equity multiple
- 1.46×
- Total profit
- $16,258
- Equity at exit
- $10,937
Cash invested: $35,420 (down + closing). Projections, not guarantees.
Landlord ↔ Tenant lean methodology
- Overall (STATE)
- 83 Strongly Landlord-Friendly
- State Oklahoma
- 83 Strongly Landlord-Friendly · R+20
- County
- — inherits STATE
- City
- — inherits STATE
ZIP-level market 73130
- Home prices YoY
- -21.0%
- Rents YoY
- 5.7%
- Active inventory
- 160
- Price-to-rent
- 9.0×
Monthly cashflow live
- Estimated rent
- $1,173 high interval (Pro) →
- Mortgage (P&I)
- −$663
- Tax from tax record
- −$87 /mo · $1,039/yr
- Insurance
- −$53
- HOA
- −$0
- Vacancy / Maint / Mgmt
- −$246
- Net cashflow
- $124
Break-even live
UW: 25.0% down · 7.5% · 30yr · 1.5% tax · 5.0% vac · 8.0% maint · 8.0% mgmt
Financing live
Cash to close
- Down payment
- $31,625
- Closing costs
- $3,795
- Reserves months
- —
- Total cash needed
- —
Loan-product check · same deal, 3 products live
Conventional
25% down · 7.5% · 30yr
- Down + closing
- —
- Monthly P&I
- —
- Monthly cashflow
- —
- DSCR
- —
- Eligible?
- —
Personal DTI + credit; lowest rate.
DSCR
20% down · 8.5% · 30yr
- Down + closing
- —
- Monthly P&I
- —
- Monthly cashflow
- —
- DSCR
- —
- Eligible?
- —
No personal income docs; deal must DSCR.
Hard money
10% down · 12.0% · 12mo
- Down + closing
- —
- Monthly P&I
- —
- Monthly cashflow
- —
- DSCR
- —
- Eligible?
- —
Short-term bridge; refi at stabilization.
Rent comps 20 comps
| Address | Beds | Baths | Sqft | Rent | $/sqft | DOM | Units | Dist |
|---|---|---|---|---|---|---|---|---|
| 9619 SE 4th St Oklahoma City, OK | 2.0 | 1.0 | 640 | $880 | $1.38 | 23d | 1 | 0.20mi |
| 9705 Oak Tree Ter Oklahoma City, OK | 3.0 | 2.0 | 1100 | $1,410 | $1.28 | 10d | 1 | 0.25mi |
| 633 Lotus Ave Oklahoma City, OK | 3.0 | 1.0 | 1038 | $1,300 | $1.25 | 10d | 1 | 0.70mi |
| 801 Royal Ave Oklahoma City, OK | 3.0 | 1.0 | 951 | $1,200 | $1.26 | 17d | 1 | 0.86mi |
| 8801 Saint George Way Oklahoma City, OK | 3.0 | 2.0 | 1122 | $1,175 | $1.05 | 23d | 1 | 0.90mi |
| 8801 Saint George Way Oklahoma City, OK | 3.0 | 2.0 | 1122 | $1,175 | $1.05 | 10d | 1 | 0.90mi |
| 8910 Oak Valley Dr Oklahoma City, OK | 2.0 | 2.0 | 935 | $1,000 | $1.07 | 20d | 1 | 1.02mi |
| 8717 Saint George Way Oklahoma City, OK | 2.0 | 2.0 | 1075 | $1,150 | $1.07 | 23d | 1 | 1.02mi |
| 9225 Stonegate Oklahoma City, OK | 2.0 | 1.0 | 870 | $1,025 | $1.18 | 2d | 1 | 1.12mi |
| 8517 E Reno Ave Oklahoma City, OK | 1.0–2.0 | 1.0–2.0 | 837 | $859 | $1.03 | 4d | 1 | 1.20mi |
| 1168 N Douglas Blvd Oklahoma City, OK | 1.0–2.0 | 1.0 | 725 | $1,020 | $1.41 | 17d | 1 | 1.30mi |
| 1400 Marydale Ave Oklahoma City, OK | 3.0 | 1.0 | 1082 | $1,150 | $1.06 | 16d | 1 | 1.31mi |
| 3513 Parkwoods Ln Oklahoma City, OK | 3.0 | 1.5 | 903 | $1,150 | $1.27 | 44d | 1 | 1.37mi |
| 9409 Rhythm Rd Oklahoma City, OK | 3.0 | 1.5 | 1087 | $1,250 | $1.15 | 21d | 1 | 1.43mi |
| 1525 McGregor Dr Oklahoma City, OK | 3.0 | 1.5 | 1012 | $1,275 | $1.26 | 2d | 1 | 1.43mi |
| 3609 Woodside Dr Midwest City, OK | 3.0 | 1.0 | 858 | $995 | $1.16 | 2d | 1 | 1.44mi |
| 10220 Isaac Dr Oklahoma City, OK | 3.0 | 1.0 | 1106 | $1,250 | $1.13 | 43d | 1 | 1.45mi |
| 677 Midtown Pl Midwest City, OK | 1.0–2.0 | 1.0–2.0 | 770 | $1,450 | $1.88 | 1d | 1 | 1.46mi |
| 9212 Jennifer Pl Oklahoma City, OK | 3.0 | 2.0 | 960 | $1,250 | $1.30 | 43d | 1 | 1.48mi |
| 1617 N Christine Dr Oklahoma City, OK | 2.0 | 2.0 | 962 | $1,050 | $1.09 | 23d | 1 | 1.48mi |
Listing history 24 events
-
2026-06-18days on market $126,500 Active 28 DOM
-
2026-06-17days on market $126,500 Active 27 DOM
-
2026-06-16days on market $126,500 Active 26 DOM
-
2026-06-15days on market $126,500 Active 25 DOM
-
2026-06-13days on market $126,500 Active 23 DOM
-
2026-06-13days on market $126,500 Active 22 DOM
-
2026-06-09days on market $126,500 Active 19 DOM
-
2026-06-08days on market $126,500 Active 18 DOM
-
2026-06-07days on market $126,500 Active 17 DOM
-
2026-06-05days on market $126,500 Active 14 DOM
-
2026-06-03days on market $126,500 Active 13 DOM
-
2026-06-02days on market $126,500 Active 12 DOM
-
2026-06-01days on market $126,500 Active 11 DOM
-
2026-05-31days on market $126,500 Active 10 DOM
-
2026-05-21$126,500 Active
-
2026-02-26historical
-
2026-02-05price $124,900
-
2026-01-22price $127,500
-
2025-11-26$129,500 Active
-
2020-10-06soldstatus $150,000
-
2020-09-30soldstatus $90,000 Sold 280-char remark
Show marketing remark (280 chars)
Brick home with newer, dual pane windows. Attached 1 car garage. Tenant occupied. Central heat & air conditioning. Stove, vent hood, garbage disposal.Located on .60 acres on Reno Avenue! House next door, also on .60 acres is also offered for sale. Potential for commercial!
-
2020-08-08status Pending 280-char remark
Show marketing remark (280 chars)
Brick home with newer, dual pane windows. Attached 1 car garage. Tenant occupied. Central heat & air conditioning. Stove, vent hood, garbage disposal.Located on .60 acres on Reno Avenue! House next door, also on .60 acres is also offered for sale. Potential for commercial!
-
2020-08-06$95,000 Active 280-char remark
Show marketing remark (280 chars)
Brick home with newer, dual pane windows. Attached 1 car garage. Tenant occupied. Central heat & air conditioning. Stove, vent hood, garbage disposal.Located on .60 acres on Reno Avenue! House next door, also on .60 acres is also offered for sale. Potential for commercial!
-
2004-04-02soldstatus $58,000
ⓘ Source: listings_history table (triggers on properties + properties_extension) + one-shot
backfill from property_details.listing_events for pre-trigger history.
Tax reassessment forecast OK · Resets to sale price
- Current annual tax
- $1,039 · $87/mo
- Projected year-2 tax
- $1,138 · $95/mo
- Expected delta
- +$99/yr (+$8/mo · 9.6%)
ⓘ Screening estimate from a state-policy table — verify with the county assessor before closing.
Climate risk First Street
- Flood 1/10 Low FEMA zone X (unshaded) · 0% chance over 30 yrs
- Wildfire 1/10 Low
- Heat 5/10 Major 7 d/yr ≥107°F today · 18 d/yr by 30 yrs out
- Wind 3/10 Moderate 5% chance of damaging wind over 30 yrs
- Air quality 2/10 Low 1 unhealthy d/yr today · 2 by 30 yrs out
Nearby sold comps map
Loading sold comps map…
Walkable amenities ~0.75 mi
Loading nearby amenities…
Taxation est. · year 1
- Rental income
- $14,071
- − Mortgage interest
- −$7,086
- − Property taxes
- −$1,039
- − Insurance
- −$632
- − Repairs & maintenance
- −$1,126
- − Management
- −$1,126
- − Depreciation
- −$3,680
- Taxable loss
- −$618
- Est. tax savings @ 24.0%
- +$148
- After-tax cash flow
- $1,632/yr
For passive investors: Depreciation is non-cash, so a rental often shows a tax loss while cash-flowing — sheltering income. Rental losses are passive: they offset passive income freely, and up to $25,000/yr can offset ordinary (W-2) income if you actively participate and your MAGI is under $100k (phasing out to $0 by $150k); unused losses carry forward. On sale, claimed depreciation is recaptured at up to 25%, and gains may owe capital-gains tax (a 1031 exchange can defer both). Figures are a year-1 estimate at your 24.0% rate — not tax advice; consult a CPA.
Schools (NCES district)
- District
- Midwest City-Del City
- NCES district ID
- 4019950
- Math proficiency
- 10% ▼ -11.00%
- Reading proficiency
- 17% ▼ -8.00%
- Median HH income
- $45,724
- Composite
- 12.09/100
- National rank
- #9658
- State rank
- #231 of 270 in OK
Livability — Midwest City
- Score
- 71/100
- State rank
- #30
- US rank
- #6637
Category grades
Schools grade is shown separately in the Schools card above.
Census & demographics
- Census place
- Midwest City, OK
- County
- Oklahoma County · 771,644 people
- City population
- 57,386
- Metro
- Oklahoma City, OK
- Population (ZIP)
- 21,476
- Household income
- $71,189
- Rent vs Own
- Severe rent burden
- 378.0
Population outlook (Oklahoma County) Hauer SSP2
- Today (2025)
- 911,875 people
- By 2030
- 982,413 · +7.7%
- By 2040
- 1,130,468 · +24.0%
- By 2050
- 1,288,422 · +41.3%
- By 2075
- 1,711,482 · +87.7%
- By 2100
- 2,088,448 · +129.0%
Race, ethnicity, and origin ACS 2023
- Neighborhood character
- Diverse neighborhood (Simpson 0.60)
- Race & ethnicity
- White 60% Black 18% Two or more races 14% Hispanic / Latino 7% Asian 2% Native American 2%
- Hispanic origin (detail)
- Mexican 6%
- Common ancestry
- Lithuanian 2% Slovak 2% Italian 2%
- Foreign-born
- 3% · Canada
- Languages at home
- 95% English-only · Spanish 3% Tagalog/Filipino 1%
Political lean MEDSL · Oklahoma
- 2024 margin
- Toss-up / Even · D 48.0% · R 49.7% · Other 2.3%
- 2008→2024 swing
- +15.1pp toward D · 2008: -16.8pp · 2024: -1.7pp
- All cycles
- 2024: R+1.7 2020: R+1.1 2016: R+10.5 2012: R+16.7 2008: R+16.8
Not yet ingested
- Civics
- —
Market trends
- HPI YoY
- ▼ -65.22%
- Current HPI
- 245.8385
- Rent YoY
- ▲ 5.73%
- Metro
- Oklahoma City, OK
- State GDP YoY
- ▲ 1.55%
- F500 in state
- 6
Industry mix (Fortune 500 HQ in OK)
| Industry | F500 HQs | Revenue |
|---|---|---|
| Energy | 3 | $48B |
|
||
Price history
+118.1% since first listed10 events — show timeline
- 2026-05-21 Listed $126,500 MLSOK
- 2026-02-26 Listing Removed — MLSOK
- 2026-02-05 Price Changed $124,900 MLSOK
- 2026-01-22 Price Changed $127,500 MLSOK
- 2025-11-26 Listed $129,500 MLSOK
- 2020-10-06 Sold (Public Records) $150,000 Public Records
- 2020-09-30 Sold (MLS) $90,000 MLSOK
- 2020-08-08 Pending — MLSOK
- 2020-08-06 Listed $95,000 MLSOK
- 2004-04-02 Sold (Public Records) $58,000 Public Records
Property tax history
+1.6%/yrLatest (2025): $1,039 · +2.5% YoY. Source: county tax records.
Cash-flow waterfall
monthlySold comps — $/sqft
last 12 mo · ≤1 miLoading sold comps…