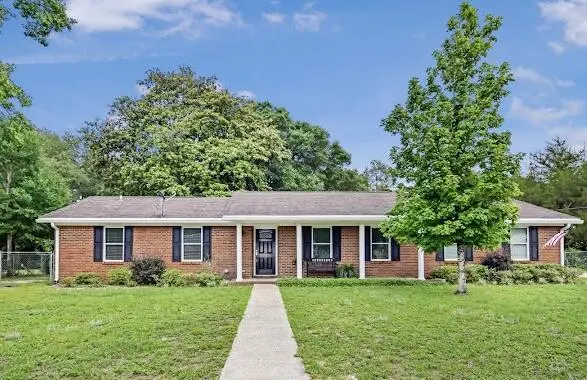
5367 Constitution Rd · Crestview, FL
Flood risk 1/10 · Minimal
- FEMA flood zone
- X (unshaded)
- Chance of flooding over 30 yrs
- 0.0%
- Est. flood insurance / yr
- $507 – $1,088
Fire risk 4/10 · Minor
- Est. fire insurance / yr
- $947 – $1,759
Heat risk 9/10 · Severe
- Hot days now (above 107°F)
- 7 days/yr
- Hot days in 30 yrs
- 20 days/yr
Wind risk 9/10 · Severe
- Chance of severe wind over 30 yrs
- 99.0%
Air-quality risk 2/10 · Minimal
- Unhealthy air days now
- 1 days/yr
- Unhealthy air days in 30 yrs
- 1 days/yr
Risk factors via First Street. Map © Google.
Why this score? — see what drove the D- grade
The composite is a weighted blend of 9 inputs, each scored 0–100. Each bar is that input's sub-score; the figure is the points it added to the 100-point composite (weight × sub-score).
- Cash flow +12.6/30.0
- ARV discount +5.9/15.0
- Schools +5.2/10.0
- DSCR +3.8/10.0
- Livability +3.8/5.0
- Rent growth +2.5/5.0
- Condition / age +2.5/5.0
- 1% rule +2.2/10.0
- Appreciation +0.0/10.0
$235,000
🖨 Deal sheet 📄 Offer letter ✓ Due diligence
Listing remarks MLS
Brick family home in a secluded, quiet neighborhood with county taxes! This is a perfect home to fix up the way you want and save money to boot.
Key facts
- 0.51 acre lot
- 2 garage spots
- Built 1982
Property features AI
Finance
- Other: Lot size approximately 0.51 acre (dimensions ~125 x 178)
- HOA & community: Subdivision: HERITAGE HILLS UNIT 1
Exterior
- Parking: Attached 2-car garage; Driveway with about 4 oversized spaces
- Utilities: Electric service; Septic tank; Phone available; Electric water heater; Ridge vent
- Home design: Ranch-style single-story home; Built in 1982; Residences zoned for single family; Facing/entry level: first floor
- Construction: Brick construction; Composite shingle roof; Built in 1982
- Exterior features: Private yard; Porch; Chain link fencing; Lot accessed via county, paved road
Interior
- Kitchen: Dishwasher; Range hood; Refrigerator; Electric water heater
- Bedrooms: 3 bedrooms (master on the first floor); Master bedroom is carpeted
- Flooring: Carpet in master bedroom
- Bathrooms: 2 bathrooms (both full)
- Heating & cooling: Central heating; Central air; Ceiling fans; Electric heat control
- Interior features: Fireplace; Split bedroom layout; Washer/dryer hookup
- Laundry & utility: Utility room on the first floor; Washer/dryer hookup
Neighborhood map
What this means for you Summary
Snapshot
- This is a 3-bed/2.0-bath single-family listed at $235k.
Deal economics
- At list price, monthly cash flow is $-31 ($-369/yr) — negative.
- To cash-flow at today's rent, offer at most $230k (2.3% below list).
- To meet the 1% rule (rent ≥ 1% of price), the offer needs to be $170k (27.6% below list).
- Recommended offer: $170k (27.6% below list) — sets the bar for 1% rule.
- Cap rate 6.1% vs local median 4.4% in Crestview — top-decile yield for the area; either an underpriced asset or a hidden risk that comps aren't pricing in. Stress-test before assuming the spread holds.
Location & tenants
- Location reads 75/100 on livability (#252 in FL, #3,858 nationally) — a middle-class / working-renter tenant base. Strengths: cost of living A+, housing A+, health & safety A+; Watch: employment D, amenities F, commute F.
- Okaloosa (other): math 60% / reading 60% proficiency, ranked #12 of 73 in FL (top 16%) — acceptable for families but not a draw, mixed tenant base, ~2y average lease.
- Zoned schools: Walker Elementary School (math 52% / reading 55%, grade C, #949 of 2,144 statewide, top 45%, 864 students, 61% FRL); Crestview High School (math 49% / reading 54%, grade D+, #167 of 667 statewide, top 25%, 2,315 students, 42% FRL) — zoned schools average 52% FRL vs 36% district-wide (16 pts higher); higher-poverty schools than district average — tighter screening recommended.
- Market conditions: Rents flat; 521 active listings in the ZIP; 17 comparable units currently listed for rent nearby; rentals at typical pace (median 21d on market — plan ~3-4 weeks tenant-placement turnaround); 47% of comp listings sitting > 30 days — soft ceiling on asking rent; 1,268 units permitted in Okaloosa County in 2024 (175 in 5+ unit buildings).
Forward outlook
- Local home prices are declining (-3.0%/yr); year-one equity from $2k of loan paydown is wiped out by about $7k of value loss. Plan a longer hold.
- Okaloosa County population projected at +37% by 2050 — long-run rental-demand tailwind backs the buy-and-hold thesis.
Negotiation context
- Only 5 days on market — expect competitive offers; lowballing is unlikely to land.
- 6 sale attempts since 22y ago with the ask held roughly flat each time — persistent listings suggest the price (not the market) is what's stuck; bring a comps-based counter.
- Current owner paid $50k; list at $235k implies a 370% gain — meaningful room to come down on a strong offer.
Risks & watch-outs
- Climate carrying-cost: severe wind risk, 99% chance of damaging wind over 30y; extreme-heat days projected 7→20/yr by 2055 (HVAC capex compounding) — expect insurance premiums to compound above CPI over the hold.
Questions for the listing agent
- What do current leases actually rent for vs. the listed asking? Can we see a recent rent roll and the last 12 months of T-12 income?
- Is there a deadline driving the sale (1031 exchange, divorce, estate, relocation)? That informs how much negotiation room exists.
- Schools are B-rated — typically a magnet for longer-tenancy family renters. What's the average tenant stay here, and is there a school-zone premium baked into asking?
- The area grade is low — what's the realistic commute time and amenity access for the typical tenant pool here? Any planned neighborhood developments (good or bad) we should know about?
- What's the average days-on-market for RENTAL listings here right now (not sales)? A rising rental-DOM trend means longer vacancies and softer asking-rent achievability than the comps imply.
- What's the recent tenant-quality profile in this submarket — average credit score on applications, eviction rate, late-payment / NSF rate, and stable-employment percentage? A property-management company in the area should have these aggregated.
- How much new for-sale + rental construction is in the pipeline within 1–3 miles? Heavy new supply typically softens prices + rents 12–24 months out; constrained supply supports both.
Investment metrics
- 1% rule
- 0.72% ✗
- Cap rate
- 6.14%
- Cash-on-cash
- -0.56%
- DSCR
- 0.98
- GRM
- 11.5
CMA / ARV
- ARV (on-the-fly)
- $226,793
- Comps found
- 10
Show comp detail 10 sales within ~0.75 mi
| Address | Dist | Beds/Ba | Sqft | Sold | Price | $/sf | Match |
|---|---|---|---|---|---|---|---|
| 5356 Constitution Rd | 0.06mi | 3/2.0 | 1,272 (+0%) | 3mo | $200,000 | $157 | 94 |
| 3147 Forrest Ave | 0.29mi | 3/2.0 | 1,245 (-2%) | 13mo | $225,000 | $181 | 73 |
| 5362 Woodland St | 0.17mi | 3/2.0 | 1,389 (+10%) | 4mo | $174,900 | $126 | 72 |
| 3159 Forrest Ave | 0.35mi | 3/2.0 | 1,344 (+6%) | 3mo | $240,000 | $179 | 71 |
| 3149 Forrest Ave | 0.29mi | 3/2.0 | 1,332 (+5%) | 18mo | $230,900 | $173 | 63 |
| 3155 Pinewoods Dr | 0.32mi | 3/2.0 | 1,375 (+8%) | 13mo | $235,000 | $171 | 60 |
| 3157 Forrest Ave | 0.33mi | 3/2.0 | 1,210 (-4%) | 21mo | $229,900 | $190 | 59 |
| 5373 Opportunity Dr | 0.48mi | 3/2.0 | 1,215 (-4%) | 14mo | $240,000 | $198 | 59 |
| 3042 Stillwell Blvd | 0.71mi | 3/2.0 | 1,200 (-5%) | 3mo | $248,000 | $207 | 55 |
| 141 Palmetto Dr | 0.62mi | 3/2.0 | 1,452 (+15%) | 22mo | $249,900 | $172 | 29 |
Match score weights: distance 35% · size 25% · config 20% · recency 20%. Top-matched comps best support the ARV.
Projected returns pro-forma
-3.0% appreciation · 0.12% rent growth · sell at horizon
- IRR
- -20.1%
- Equity multiple
- 0.32×
- Total profit
- $-44,956
- Equity at exit
- $35,039
- IRR
- -19.5%
- Equity multiple
- 0.08×
- Total profit
- $-60,746
- Equity at exit
- $20,319
Cash invested: $65,800 (down + closing). Projections, not guarantees.
Landlord ↔ Tenant lean methodology
- Overall (STATE)
- 87 Strongly Landlord-Friendly
- State Florida
- 87 Strongly Landlord-Friendly · R+3
- County
- — inherits STATE
- City
- — inherits STATE
ZIP-level market 32539
- Home prices YoY
- -17.8%
- Rents YoY
- 0.1%
- Active inventory
- 521
- Price-to-rent
- 11.5×
Monthly cashflow live
- Estimated rent
- $1,701 high interval (Pro) →
- Mortgage (P&I)
- −$1,232
- Tax from tax record
- −$44 /mo · $533/yr
- Insurance
- −$98
- HOA
- −$0
- Vacancy / Maint / Mgmt
- −$357
- Net cashflow
- $-31
Break-even live
UW: 25.0% down · 7.5% · 30yr · 1.5% tax · 5.0% vac · 8.0% maint · 8.0% mgmt
Financing live
Cash to close
- Down payment
- $58,750
- Closing costs
- $7,050
- Reserves months
- —
- Total cash needed
- —
Loan-product check · same deal, 3 products live
Conventional
25% down · 7.5% · 30yr
- Down + closing
- —
- Monthly P&I
- —
- Monthly cashflow
- —
- DSCR
- —
- Eligible?
- —
Personal DTI + credit; lowest rate.
DSCR
20% down · 8.5% · 30yr
- Down + closing
- —
- Monthly P&I
- —
- Monthly cashflow
- —
- DSCR
- —
- Eligible?
- —
No personal income docs; deal must DSCR.
Hard money
10% down · 12.0% · 12mo
- Down + closing
- —
- Monthly P&I
- —
- Monthly cashflow
- —
- DSCR
- —
- Eligible?
- —
Short-term bridge; refi at stabilization.
Rent comps 17 comps
| Address | Beds | Baths | Sqft | Rent | $/sqft | DOM | Units | Dist |
|---|---|---|---|---|---|---|---|---|
| 124 Hampton Dr Unit 1 Crestview, FL | 2.0 | 1.5 | 952 | $1,195 | $1.26 | 43d | 1 | 0.78mi |
| 124 Hampton Dr Crestview, FL | 2.0 | 1.5 | 952 | $1,195 | $1.26 | 20d | 1 | 0.79mi |
| 122 Hampton Dr Unit 1 Crestview, FL | 2.0 | 2.0 | 1080 | $1,195 | $1.11 | 43d | 1 | 0.79mi |
| 122 Hampton Dr Crestview, FL | 2.0 | 1.5 | 1080 | $1,195 | $1.11 | 43d | 1 | 0.79mi |
| 107 Hampton Dr Crestview, FL | 2.0 | 1.5 | 972 | $1,300 | $1.34 | 20d | 1 | 0.81mi |
| 815 Valley Rd Crestview, FL | 3.0 | 2.5 | 1373 | $1,550 | $1.13 | 43d | 1 | 1.05mi |
| 5179 Rabbit Run Crestview, FL | 4.0 | 2.0 | 1818 | $2,200 | $1.21 | 13d | 1 | 1.07mi |
| 2942 Sholtz Ave Crestview, FL | 3.0 | 2.0 | 1266 | $1,600 | $1.26 | 43d | 1 | 1.13mi |
| 502 Hyde Park Dr Crestview, FL | 3.0 | 2.0 | 1302 | $1,795 | $1.38 | 13d | 1 | 1.19mi |
| 304 Strawbridge Dr Crestview, FL | 4.0 | 2.0 | 1650 | $1,850 | $1.12 | 13d | 1 | 1.24mi |
| 812 E Edney Ave Crestview, FL | 2.0 | 2.0 | 1024 | $1,400 | $1.37 | 44d | 1 | 1.31mi |
| 812 E Edney Ave Crestview, FL | 2.0 | 2.0 | 1024 | $1,400 | $1.37 | 20d | 1 | 1.31mi |
| 507 Eisenhower Dr Crestview, FL | 3.0 | 2.0 | 1809 | $2,200 | $1.22 | 43d | 1 | 1.35mi |
| 3016 Aplin Rd Crestview, FL | 3.0 | 2.0 | 1280 | $1,400 | $1.09 | 43d | 1 | 1.36mi |
| 4821 Acorn Dr Crestview, FL | 3.0 | 2.0 | 1705 | $1,930 | $1.13 | 20d | 1 | 1.39mi |
| 4821 Acorn Dr Crestview, FL | 3.0 | 2.0 | 1705 | $1,930 | $1.13 | 13d | 1 | 1.39mi |
| 311 Dahlquist Dr Crestview, FL | 4.0 | 2.5 | 1770 | $2,050 | $1.16 | 20d | 1 | 1.44mi |
Listing history 5 events
-
2026-06-07statusdays on market $235,000 Pending 5 DOM
-
2026-06-05days on market $235,000 Active 4 DOM
-
2026-06-02days on market $235,000 Active 2 DOM
-
2026-06-01remarks 699-char remark
-
2026-06-01$235,000 Active 1 DOM
ⓘ Source: listings_history table (triggers on properties + properties_extension) + one-shot
backfill from property_details.listing_events for pre-trigger history.
Tax reassessment forecast FL · Resets to sale price
- Current annual tax
- $533 · $44/mo
- Projected year-2 tax
- $1,950 · $163/mo
- Expected delta
- +$1,417/yr (+$118/mo · 265.9%)
ⓘ Screening estimate from a state-policy table — verify with the county assessor before closing.
Climate risk First Street
- Flood 1/10 Low FEMA zone X (unshaded) · 0% chance over 30 yrs
- Wildfire 4/10 Moderate
- Heat 9/10 Extreme 7 d/yr ≥107°F today · 20 d/yr by 30 yrs out
- Wind 9/10 Extreme 99% chance of damaging wind over 30 yrs
- Air quality 2/10 Low 1 unhealthy d/yr today · 1 by 30 yrs out
Nearby sold comps map
Loading sold comps map…
Walkable amenities ~0.75 mi
Loading nearby amenities…
Taxation est. · year 1
- Rental income
- $20,415
- − Mortgage interest
- −$13,164
- − Property taxes
- −$533
- − Insurance
- −$1,175
- − Repairs & maintenance
- −$1,633
- − Management
- −$1,633
- − Depreciation
- −$6,836
- Taxable loss
- −$4,559
- Est. tax savings @ 24.0%
- +$1,094
- After-tax cash flow
- $726/yr
For passive investors: Depreciation is non-cash, so a rental often shows a tax loss while cash-flowing — sheltering income. Rental losses are passive: they offset passive income freely, and up to $25,000/yr can offset ordinary (W-2) income if you actively participate and your MAGI is under $100k (phasing out to $0 by $150k); unused losses carry forward. On sale, claimed depreciation is recaptured at up to 25%, and gains may owe capital-gains tax (a 1031 exchange can defer both). Figures are a year-1 estimate at your 24.0% rate — not tax advice; consult a CPA.
Schools (NCES district)
- District
- Okaloosa
- NCES district ID
- 1201380
- Math proficiency
- 60% ▼ -12.00%
- Reading proficiency
- 60% ▼ -4.00%
- Median HH income
- $55,601
- Composite
- 51.62/100
- National rank
- #1705
- State rank
- #12 of 73 in FL
Livability — Crestview
- Score
- 75/100
- State rank
- #252
- US rank
- #3858
Category grades
Schools grade is shown separately in the Schools card above.
Census & demographics
- County
- Okaloosa County · 194,352 people
- City population
- 58,889
- Metro
- Crestview-Fort Walton Beach-Destin, FL
- Population (ZIP)
- 33,290
- Household income
- $74,369
- Rent vs Own
- Severe rent burden
- 371.0
Population outlook (Okaloosa County) Hauer SSP2
- Today (2025)
- 235,133 people
- By 2030
- 253,483 · +7.8%
- By 2040
- 289,537 · +23.1%
- By 2050
- 322,954 · +37.3%
- By 2075
- 399,624 · +70.0%
- By 2100
- 425,311 · +80.9%
Race, ethnicity, and origin ACS 2023
- Neighborhood character
- Predominantly White (73%)
- Race & ethnicity
- White 73% Black 12% Two or more races 8% Hispanic / Latino 7% Asian 1%
- Hispanic origin (detail)
- Mexican 3% Puerto Rican 2%
- Common ancestry
- Lithuanian 4% Iranian 2% Romanian 2%
- Foreign-born
- 3% · Canada
- Languages at home
- 94% English-only · Spanish 3% Russian/Polish/Slavic 1% Other Asian/Pacific 1%
Political lean MEDSL · Okaloosa
- 2024 margin
- Solid R (+42.4) · D 28.2% · R 70.7% · Other 1.1%
- 2008→2024 swing
- +2.5pp toward D · 2008: -44.9pp · 2024: -42.4pp
- All cycles
- 2024: R+42.4 2020: R+39.1 2016: R+47.8 2012: R+49.4 2008: R+44.9
Not yet ingested
- Civics
- —
Market trends
- HPI YoY
- ▼ -56.52%
- Current HPI
- 261.1557
- Rent YoY
- ▲ 0.12%
- Metro
- Crestview-Fort Walton Beach-Destin, FL
- State GDP YoY
- ▲ 3.28%
- F500 in state
- 36
Industry mix (Fortune 500 HQ in FL)
| Industry | F500 HQs | Revenue |
|---|---|---|
| Industrial Technology | 2 | $29B |
|
||
| Insurance | 2 | $17B |
|
||
| Retail | 1 | $60B |
|
||
| Technology Distribution | 1 | $58B |
|
||
| Homebuilding | 1 | $35B |
|
||
| Technology Manufacturing | 1 | $35B |
|
||
Price history
+217.6% since first listed13 events — show timeline
- 2026-06-01 Listed $235,000 ECAR
- 2026-04-28 Listing Removed — PARMLS
- 2026-01-12 Listed $235,000 PARMLS
- 2011-04-29 Sold (MLS) $50,000 NAMLS
- 2011-04-29 Sold (MLS) $50,000 ECAR
- 2010-02-09 Listed $64,900 NAMLS
- 2010-02-09 Listed $64,900 ECAR
- 2004-09-29 Sold (Public Records) $125,000 Public Records
- 2004-08-28 Sold (MLS) $124,900 NAMLS
- 2004-08-28 Sold (MLS) $124,900 ECAR
- 2004-07-27 Listed $129,000 NAMLS
- 2004-07-27 Listed $129,000 ECAR
- 1996-04-01 Sold (Public Records) $74,000 Public Records
Property tax history
-0.0%/yrLatest (2025): $533 · +4.6% YoY. Source: county tax records.
Cash-flow waterfall
monthlySold comps — $/sqft
last 12 mo · ≤1 miLoading sold comps…