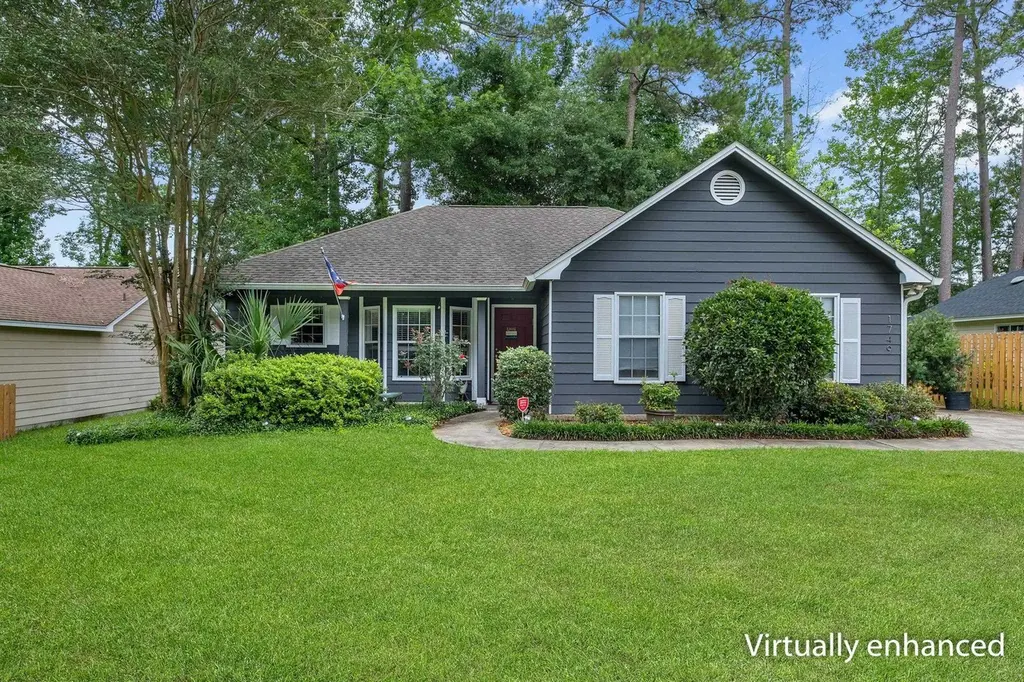
1749 Broken Bow Trl · Bradfordville, FL
Flood risk 1/10 · Minimal
- FEMA flood zone
- X (unshaded)
- Chance of flooding over 30 yrs
- 0.0%
- Est. flood insurance / yr
- $507 – $1,088
Fire risk 3/10 · Minor
- Est. fire insurance / yr
- $947 – $1,759
Heat risk 8/10 · Major
- Hot days now (above 108°F)
- 7 days/yr
- Hot days in 30 yrs
- 20 days/yr
Wind risk 9/10 · Severe
- Chance of severe wind over 30 yrs
- 99.0%
Air-quality risk 5/10 · Moderate
- Unhealthy air days now
- 7 days/yr
- Unhealthy air days in 30 yrs
- 7 days/yr
Risk factors via First Street. Map © Google.
Why this score? — see what drove the D- grade
The composite is a weighted blend of 9 inputs, each scored 0–100. Each bar is that input's sub-score; the figure is the points it added to the 100-point composite (weight × sub-score).
- Cash flow +13.4/30.0
- ARV discount +5.6/15.0
- Schools +4.3/10.0
- DSCR +4.0/10.0
- 1% rule +3.2/10.0
- Rent growth +3.0/5.0
- Livability +2.5/5.0
- Condition / age +2.5/5.0
- Appreciation +0.0/10.0
$319,900
🖨 Deal sheet 📄 Offer letter ✓ Due diligence
Listing remarks
Welcome to this 3 bedroom, 2 bathroom home located in the highly sought-after Killearn Lakes community, one of North Tallahassee’s most established and desirable neighborhoods. Known for its peaceful setting, top-rated schools, and convenient access to shopping, dining, parks, and everyday essentials, Killearn Lakes also offers an ideal location just thirteen miles from the Florida/Georgia line. This charming one-story home features a spacious open floor plan with laminate wood flooring throughout. The oversized great room includes soaring ceilings and centers around a cozy wood-burning fireplace. The open kitchen is complete with granite countertops, tile backsplash, and great functi
Key facts
- Open floor plan
- Oversized great room
- Granite countertops
Tags
Property features AI
Finance
- HOA & community: Association fee: $120 (includes common areas)
Exterior
- Parking: 2-car garage (detached status not specified)
- Utilities: Septic tank
- Home design: Single-story home; Slab foundation
- Construction: Slab foundation
- Exterior features: Fully fenced yard; Covered patio; Porch
Interior
- Kitchen: Oven; Range; Dishwasher; Refrigerator
- Bedrooms: Bedroom 2 (10x10); Bedroom 3 (9x10)
- Flooring: Plank; Tile; Vinyl
- Bathrooms: 2 full bathrooms
- Heating & cooling: Central heating; Electric heating; Wood heating; Central air conditioning; Ceiling fans; Electric cooling; Wall/window unit(s)
- Interior features: Tray ceilings; Vaulted ceilings; Entrance foyer; Split-bedroom floorplan; Sunroom; Walk-in closet(s)
- Laundry & utility: Washer; Dryer; Utility room
Neighborhood map
What this means for you Summary
Snapshot
- This is a 3-bed/2.0-bath single-family listed at $320k.
Deal economics
- At list price, monthly cash flow is $7 ($81/yr) — positive.
- The deal already cash-flows at list — no discount required.
- To meet the 1% rule (rent ≥ 1% of price), the offer needs to be $262k (18.0% below list).
- Recommended offer: $262k (18.0% below list) — sets the bar for 1% rule.
- Cap rate 6.3% vs local median 3.0% in Bradfordville — top-decile yield for the area; either an underpriced asset or a hidden risk that comps aren't pricing in. Stress-test before assuming the spread holds.
Location & tenants
- Location reads: area grade D — affects rentability + tenant quality, not the cash-flow math above.
- Leon (urban): math 48% / reading 53% proficiency, ranked #33 of 73 in FL (top 45%) — acceptable for families but not a draw, mixed tenant base, ~2y average lease.
- Market conditions: Rents rising (+1.9%/yr); 192 active listings in the ZIP; 2 comparable units currently listed for rent nearby; high-income renter base; 1,765 units permitted in Leon County in 2024 (975 in 5+ unit buildings).
Forward outlook
- Local home prices are declining (-3.0%/yr); year-one equity from $2k of loan paydown is wiped out by about $10k of value loss. Plan a longer hold.
- Leon County population projected at +23% by 2050 — long-run rental-demand tailwind backs the buy-and-hold thesis.
Negotiation context
- Only 14 days on market — expect competitive offers; lowballing is unlikely to land.
- Current owner paid $194k; list at $320k implies a 65% gain — meaningful room to come down on a strong offer.
Risks & watch-outs
- Climate carrying-cost: severe wind risk, 99% chance of damaging wind over 30y; extreme-heat days projected 7→20/yr by 2055 (HVAC capex compounding) — expect insurance premiums to compound above CPI over the hold.
Questions for the listing agent
- What does the HOA fee cover, when was the last increase, and are there any pending special assessments or reserve-fund shortfalls?
- Is there a deadline driving the sale (1031 exchange, divorce, estate, relocation)? That informs how much negotiation room exists.
- The area grade is low — what's the realistic commute time and amenity access for the typical tenant pool here? Any planned neighborhood developments (good or bad) we should know about?
- What's the average days-on-market for RENTAL listings here right now (not sales)? A rising rental-DOM trend means longer vacancies and softer asking-rent achievability than the comps imply.
- What's the recent tenant-quality profile in this submarket — average credit score on applications, eviction rate, late-payment / NSF rate, and stable-employment percentage? A property-management company in the area should have these aggregated.
- How much new for-sale + rental construction is in the pipeline within 1–3 miles? Heavy new supply typically softens prices + rents 12–24 months out; constrained supply supports both.
Investment metrics
- 1% rule
- 0.82% ✗
- Cap rate
- 6.32%
- Cash-on-cash
- 0.09%
- DSCR
- 1.00
- GRM
- 10.2
CMA / ARV
- ARV (on-the-fly)
- $307,257
- Comps found
- 12
Show comp detail 12 sales within ~0.75 mi
| Address | Dist | Beds/Ba | Sqft | Sold | Price | $/sf | Match |
|---|---|---|---|---|---|---|---|
| 1764 Broken Bow Trl | 0.07mi | 3/2.0 | 1,459 (+4%) | 2mo | $300,000 | $206 | 88 |
| 1704 Greenridge Trl | 0.21mi | 3/2.5 | 1,500 (+7%) | 1mo | $330,000 | $220 | 76 |
| 8432 Ivy Brook Ln | 0.38mi | 3/2.0 | 1,474 (+5%) | 5mo | $332,000 | $225 | 70 |
| 1853 Bridgemont Trl | 0.28mi | 3/2.0 | 1,272 (-9%) | 5mo | $278,000 | $219 | 68 |
| 9124 Hickory Nut Hl | 0.36mi | 3/2.0 | 1,313 (-6%) | 6mo | $191,000 | $145 | 67 |
| 2245 Tuscavilla Rd | 0.72mi | 3/2.0 | 1,372 (-2%) | 3mo | $285,000 | $208 | 60 |
| 8204 Chickasaw Trl | 0.74mi | 3/2.0 | 1,432 (+2%) | 2mo | $288,000 | $201 | 60 |
| 1783 Folkstone Rd | 0.35mi | 3/2.0 | 1,227 (-12%) | 5mo | $309,960 | $253 | 58 |
| 1451 Landon Hills Dr | 0.52mi | 3/2.5 | 1,280 (-9%) | 3mo | $243,288 | $190 | 56 |
| 2253 Tuscavilla | 0.74mi | 3/2.0 | 1,466 (+4%) | 3mo | $280,000 | $191 | 56 |
| 1351 Landon Hills Dr | 0.52mi | 3/2.5 | 1,280 (-9%) | 4mo | $350,000 | $273 | 56 |
| 1813 Newman Ln | 0.60mi | 3/2.0 | 1,214 (-14%) | 4mo | $285,000 | $235 | 47 |
Match score weights: distance 35% · size 25% · config 20% · recency 20%. Top-matched comps best support the ARV.
Projected returns pro-forma
-3.0% appreciation · 1.85% rent growth · sell at horizon
- IRR
- -17.4%
- Equity multiple
- 0.39×
- Total profit
- $-54,460
- Equity at exit
- $47,698
- IRR
- -11.6%
- Equity multiple
- 0.34×
- Total profit
- $-59,104
- Equity at exit
- $27,659
Cash invested: $89,572 (down + closing). Projections, not guarantees.
Landlord ↔ Tenant lean methodology
- Overall (STATE)
- 87 Strongly Landlord-Friendly
- State Florida
- 87 Strongly Landlord-Friendly · R+3
- County
- — inherits STATE
- City
- — inherits STATE
ZIP-level market 32312
- Rents YoY
- 1.9%
- Active inventory
- 192
- Price-to-rent
- 10.2×
Monthly cashflow live
- Estimated rent
- $2,622 medium interval (Pro) →
- Mortgage (P&I)
- −$1,678
- Tax from tax record
- −$244 /mo · $2,930/yr
- Insurance
- −$133
- HOA
- −$10
- Vacancy / Maint / Mgmt
- −$551
- Net cashflow
- $7
Break-even live
UW: 25.0% down · 7.5% · 30yr · 1.5% tax · 5.0% vac · 8.0% maint · 8.0% mgmt
Financing live
Cash to close
- Down payment
- $79,975
- Closing costs
- $9,597
- Reserves months
- —
- Total cash needed
- —
Loan-product check · same deal, 3 products live
Conventional
25% down · 7.5% · 30yr
- Down + closing
- —
- Monthly P&I
- —
- Monthly cashflow
- —
- DSCR
- —
- Eligible?
- —
Personal DTI + credit; lowest rate.
DSCR
20% down · 8.5% · 30yr
- Down + closing
- —
- Monthly P&I
- —
- Monthly cashflow
- —
- DSCR
- —
- Eligible?
- —
No personal income docs; deal must DSCR.
Hard money
10% down · 12.0% · 12mo
- Down + closing
- —
- Monthly P&I
- —
- Monthly cashflow
- —
- DSCR
- —
- Eligible?
- —
Short-term bridge; refi at stabilization.
Rent comps 2 comps
| Address | Beds | Baths | Sqft | Rent | $/sqft | DOM | Units | Dist |
|---|---|---|---|---|---|---|---|---|
| 8311 Hunters Ridge Trl Tallahassee, FL | 3.0 | 2.0 | 1400 | $2,399 | $1.71 | 14d | 1 | 0.17mi |
| 9306 Tuscany Dr Unit NA Tallahassee, FL | 3.0 | 2.0 | 1472 | $2,700 | $1.83 | 21d | 1 | 0.70mi |
HOA detail
- Monthly dues
- $10 · $120/yr
Listing history 11 events
-
2026-06-18days on market $319,900 Active 14 DOM
-
2026-06-17days on market $319,900 Active 13 DOM
-
2026-06-16days on market $319,900 Active 12 DOM
-
2026-06-15days on market $319,900 Active 11 DOM
-
2026-06-14days on market $319,900 Active 9 DOM
-
2026-06-10days on market $319,900 Active 6 DOM
-
2026-06-09days on market $319,900 Active 5 DOM
-
2026-06-08days on market $319,900 Active 4 DOM
-
2026-06-07days on market $319,900 Active 3 DOM
-
2026-06-05remarks 693-char remark
-
2026-06-05$319,900 Active 1 DOM
ⓘ Source: listings_history table (triggers on properties + properties_extension) + one-shot
backfill from property_details.listing_events for pre-trigger history.
Tax reassessment forecast FL · Resets to sale price
- Current annual tax
- $2,930 · $244/mo
- Projected year-2 tax
- $2,930 · $244/mo
- Expected delta
- $0/yr ($0/mo · 0.0%)
ⓘ Screening estimate from a state-policy table — verify with the county assessor before closing.
Climate risk First Street
- Flood 1/10 Low FEMA zone X (unshaded) · 0% chance over 30 yrs
- Wildfire 3/10 Moderate
- Heat 8/10 Severe 7 d/yr ≥108°F today · 20 d/yr by 30 yrs out
- Wind 9/10 Extreme 99% chance of damaging wind over 30 yrs
- Air quality 5/10 Major 7 unhealthy d/yr today · 7 by 30 yrs out
Nearby sold comps map
Loading sold comps map…
Walkable amenities ~0.75 mi
Loading nearby amenities…
Taxation est. · year 1
- Rental income
- $31,469
- − Mortgage interest
- −$17,919
- − Property taxes
- −$2,930
- − Insurance
- −$1,600
- − Repairs & maintenance
- −$2,518
- − Management
- −$2,518
- − HOA
- −$120
- − Depreciation
- −$9,306
- Taxable loss
- −$5,440
- Est. tax savings @ 24.0%
- +$1,306
- After-tax cash flow
- $1,386/yr
For passive investors: Depreciation is non-cash, so a rental often shows a tax loss while cash-flowing — sheltering income. Rental losses are passive: they offset passive income freely, and up to $25,000/yr can offset ordinary (W-2) income if you actively participate and your MAGI is under $100k (phasing out to $0 by $150k); unused losses carry forward. On sale, claimed depreciation is recaptured at up to 25%, and gains may owe capital-gains tax (a 1031 exchange can defer both). Figures are a year-1 estimate at your 24.0% rate — not tax advice; consult a CPA.
Schools (NCES district)
- District
- Leon
- NCES district ID
- 1201110
- Math proficiency
- 48% ▼ -13.00%
- Reading proficiency
- 53% ▼ -5.00%
- Median HH income
- $46,339
- Composite
- 42.84/100
- National rank
- #3131
- State rank
- #33 of 73 in FL
Livability — Bradfordville
No livability data for this city. (Only ~50 U.S. cities are tracked.)
Census & demographics
- Census place
- Bradfordville, FL
- County
- Leon County · 294,472 people
- City population
- 31,966
- Metro
- Tallahassee, FL
- Population (ZIP)
- 32,216
- Household income
- $123,032
- Rent vs Own
- Severe rent burden
- 630.0
Population outlook (Leon County) Hauer SSP2
- Today (2025)
- 315,507 people
- By 2030
- 330,677 · +4.8%
- By 2040
- 358,465 · +13.6%
- By 2050
- 386,804 · +22.6%
- By 2075
- 465,480 · +47.5%
- By 2100
- 519,959 · +64.8%
Race, ethnicity, and origin ACS 2023
- Neighborhood character
- Predominantly White (75%)
- Race & ethnicity
- White 75% Black 11% Hispanic / Latino 6% Two or more races 5% Asian 5%
- Hispanic origin (detail)
- Mexican 2%
- Common ancestry
- Slovak 4% Italian 4% Serbian 2%
- Foreign-born
- 9% · Canada, China
- Languages at home
- 90% English-only · Spanish 3% Chinese 2% Other Asian/Pacific 1%
Political lean MEDSL · Leon
- 2024 margin
- Strong D (+21.8) · D 60.3% · R 38.5% · Other 1.2%
- 2008→2024 swing
- -2.5pp toward R · 2008: 24.3pp · 2024: 21.8pp
- All cycles
- 2024: D+21.8 2020: D+28.3 2016: D+25.1 2012: D+23.6 2008: D+24.3
Not yet ingested
- Civics
- —
Market trends
- HPI YoY
- ▼ -211.79%
- Current HPI
- 240.8961
- Rent YoY
- ▲ 1.85%
- Metro
- Tallahassee, FL
- State GDP YoY
- ▲ 3.28%
- F500 in state
- 36
Industry mix (Fortune 500 HQ in FL)
| Industry | F500 HQs | Revenue |
|---|---|---|
| Industrial Technology | 2 | $29B |
|
||
| Insurance | 2 | $17B |
|
||
| Retail | 1 | $60B |
|
||
| Technology Distribution | 1 | $58B |
|
||
| Homebuilding | 1 | $35B |
|
||
| Technology Manufacturing | 1 | $35B |
|
||
Price history
+188.2% since first listed3 events — show timeline
- 2026-06-04 Listed $319,900 CATRS
- 2006-05-15 Sold (Public Records) $194,000 Public Records
- 2002-05-02 Sold (Public Records) $111,000 Public Records
Property tax history
+5.9%/yrLatest (2025): $2,930 · +11.5% YoY. Source: county tax records.
Cash-flow waterfall
monthlySold comps — $/sqft
last 12 mo · ≤1 miLoading sold comps…