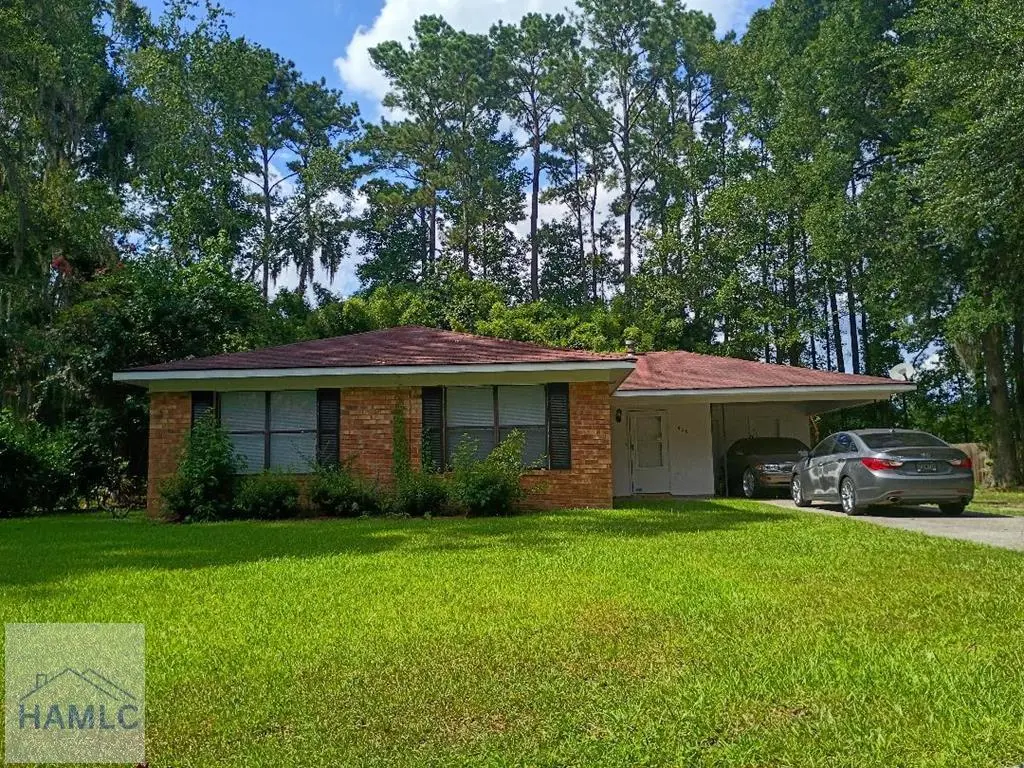
606 Heritage Dr · Hinesville, GA
Flood risk 1/10 · Minimal
- FEMA flood zone
- X (shaded)
- Chance of flooding over 30 yrs
- 0.0%
- Est. flood insurance / yr
- $507 – $1,088
Fire risk 4/10 · Minor
- Est. fire insurance / yr
- $963 – $1,789
Heat risk 9/10 · Severe
- Hot days now (above 110°F)
- 7 days/yr
- Hot days in 30 yrs
- 18 days/yr
Wind risk 8/10 · Major
- Chance of severe wind over 30 yrs
- 99.0%
Air-quality risk 2/10 · Minimal
- Unhealthy air days now
- 2 days/yr
- Unhealthy air days in 30 yrs
- 2 days/yr
Risk factors via First Street. Map © Google.
Why this score? — see what drove the D grade
The composite is a weighted blend of 9 inputs, each scored 0–100. Each bar is that input's sub-score; the figure is the points it added to the 100-point composite (weight × sub-score).
- Cash flow +13.4/30.0
- ARV discount +7.7/15.0
- DSCR +4.0/10.0
- Rent growth +3.9/5.0
- 1% rule +3.7/10.0
- Livability +3.7/5.0
- Condition / age +2.5/5.0
- Schools +2.0/10.0
- Appreciation +0.0/10.0
$249,000
🖨 Deal sheet 📄 Offer letter ✓ Due diligence
Key facts
- 0.45 acre lot
- Garage
- Built 1982
Neighborhood map
What this means for you Summary
Snapshot
- This is a 3-bed/2.0-bath single-family listed at $249k.
Deal economics
- At list price, monthly cash flow is $5 ($66/yr) — positive.
- The deal already cash-flows at list — no discount required.
- To meet the 1% rule (rent ≥ 1% of price), the offer needs to be $216k (13.1% below list).
- Recommended offer: $216k (13.1% below list) — sets the bar for 1% rule.
- Cap rate 6.3% vs local median 5.2% in Hinesville — meaningfully above typical; check what's discounted (condition, days-on-market, listing class) to confirm the premium yield is real.
Location & tenants
- Location reads 73/100 on livability (#51 in GA) — a middle-class / working-renter tenant base. Strengths: cost of living A+, housing A+, health & safety A+; Watch: schools D+, commute D+, crime F.
- Liberty County (urban): math 19% / reading 28% proficiency, ranked #133 of 174 in GA (top 76%) — low school quality limits family demand, transient renter base, plan for 1-2y turnover.
- Market conditions: Rents rising fast (+5.4%/yr); 612 active listings in the ZIP; 14 comparable units currently listed for rent nearby; rentals lingering (median 44d on market — plan ~5-8 weeks vacancy on turnover, expect pricing pressure); 100% of comp listings sitting > 30 days — soft ceiling on asking rent; 471 units permitted in Liberty County in 2024 (0 in 5+ unit buildings).
- This rent runs 43% of the median local income ($60k/yr) — at the standard rent-burdened threshold; future hikes will face affordability resistance.
Forward outlook
- Local home prices are declining (-3.0%/yr); year-one equity from $2k of loan paydown is wiped out by about $7k of value loss. Plan a longer hold.
- Liberty County population projected to shrink 8% by 2050 — rents likely to lag national; underwrite the cash flow, not the appreciation.
Negotiation context
- It's been on market 325 days — a 12% lower offer ($219k) is reasonable based on typical stale-listing flexibility.
- 4 sale attempts since 11y ago with the ask held roughly flat each time — persistent listings suggest the price (not the market) is what's stuck; bring a comps-based counter.
Risks & watch-outs
- Climate carrying-cost: severe wind risk, 99% chance of damaging wind over 30y; extreme-heat days projected 7→18/yr by 2055 (HVAC capex compounding) — expect insurance premiums to compound above CPI over the hold.
Questions for the listing agent
- It's been on market 325 days. Have you received any prior offers? Is the seller open to a 13% concession, seller financing, or rate buy-down credit?
- Why hasn't it sold? Are there any deal-killer items the seller is aware of (foundation, flood, title, zoning, code violations)?
- Is there a deadline driving the sale (1031 exchange, divorce, estate, relocation)? That informs how much negotiation room exists.
- Schools are D-rated, which usually means shorter tenancies and higher turnover. Who's the typical renter profile here, and what's been the actual vacancy rate?
- Crime grade is F in this area — have there been break-ins, vandalism, or insurance claims at this property in the last 3 years? What carrier currently insures it and at what premium?
- The area grade is low — what's the realistic commute time and amenity access for the typical tenant pool here? Any planned neighborhood developments (good or bad) we should know about?
- What's the average days-on-market for RENTAL listings here right now (not sales)? A rising rental-DOM trend means longer vacancies and softer asking-rent achievability than the comps imply.
- What's the recent tenant-quality profile in this submarket — average credit score on applications, eviction rate, late-payment / NSF rate, and stable-employment percentage? A property-management company in the area should have these aggregated.
- How much new for-sale + rental construction is in the pipeline within 1–3 miles? Heavy new supply typically softens prices + rents 12–24 months out; constrained supply supports both.
Investment metrics
- 1% rule
- 0.87% ✗
- Cap rate
- 6.32%
- Cash-on-cash
- 0.09%
- DSCR
- 1.00
- GRM
- 9.6
CMA / ARV
- ARV (median comp)
- $249,861
- List price
- $249,000
- Delta
- -0.34%
- Verdict
- FAIR
- Comps
- 20 within 1.0 mi
Show comp detail 12 sales within ~0.75 mi
| Address | Dist | Beds/Ba | Sqft | Sold | Price | $/sf | Match |
|---|---|---|---|---|---|---|---|
| 506 Creekview Dr | 0.10mi | 3/2.0 | 1,526 (-14%) | 10mo | $260,000 | $170 | 63 |
| 400 Willow Oak Ln | 0.58mi | 4/2.0 (+1) | 1,750 (-2%) | 6mo | $274,000 | $157 | 60 |
| 522 Forest St | 0.18mi | 3/2.0 | 1,554 (-13%) | 13mo | $264,000 | $170 | 59 |
| 402 Woodland Dr | 0.53mi | 3/2.0 | 1,877 (+5%) | 17mo | $270,000 | $144 | 52 |
| 700 Thornwood Way | 0.37mi | 4/2.0 (+1) | 2,000 (+12%) | 17mo | $249,989 | $125 | 44 |
| 609 Thornwood Way | 0.35mi | 4/2.0 (+1) | 1,522 (-15%) | 20mo | $250,000 | $164 | 38 |
| 160 Hazy Ln | 0.64mi | 3/2.5 | 1,518 (-15%) | 21mo | $271,990 | $179 | 26 |
| 130 Hazy Ln | 0.64mi | 3/2.5 | 1,518 (-15%) | 22mo | $270,990 | $179 | 26 |
| 14 Hazy Ln | 0.64mi | 3/2.5 | 1,518 (-15%) | 22mo | $269,990 | $178 | 25 |
| 160 Hazy Ln | 0.68mi | 3/2.5 | 1,518 (-15%) | 21mo | $271,990 | $179 | 24 |
| 130 Hazy Ln | 0.70mi | 3/2.5 | 1,518 (-15%) | 22mo | $270,990 | $179 | 23 |
| 902 Jena Ct | 0.67mi | 4/2.5 (+1) | 2,036 (+14%) | 21mo | $285,000 | $140 | 21 |
Match score weights: distance 35% · size 25% · config 20% · recency 20%. Top-matched comps best support the ARV.
Projected returns pro-forma
-3.0% appreciation · 5.41% rent growth · sell at horizon
- IRR
- -13.5%
- Equity multiple
- 0.50×
- Total profit
- $-34,605
- Equity at exit
- $37,127
- IRR
- -1.2%
- Equity multiple
- 0.91×
- Total profit
- $-6,435
- Equity at exit
- $21,529
Cash invested: $69,720 (down + closing). Projections, not guarantees.
Landlord ↔ Tenant lean methodology
- Overall (STATE)
- 90 Strongly Landlord-Friendly
- State Georgia
- 90 Strongly Landlord-Friendly · R+3
- County
- — inherits STATE
- City
- — inherits STATE
ZIP-level market 31313
- Home prices YoY
- -27.1%
- Rents YoY
- 5.4%
- Active inventory
- 612
- Price-to-rent
- 9.6×
Monthly cashflow live
- Estimated rent
- $2,163 high interval (Pro) →
- Mortgage (P&I)
- −$1,306
- Tax from tax record
- −$294 /mo · $3,527/yr
- Insurance
- −$104
- HOA
- −$0
- Vacancy / Maint / Mgmt
- −$454
- Net cashflow
- $5
Break-even live
UW: 25.0% down · 7.5% · 30yr · 1.5% tax · 5.0% vac · 8.0% maint · 8.0% mgmt
Financing live
Cash to close
- Down payment
- $62,250
- Closing costs
- $7,470
- Reserves months
- —
- Total cash needed
- —
Loan-product check · same deal, 3 products live
Conventional
25% down · 7.5% · 30yr
- Down + closing
- —
- Monthly P&I
- —
- Monthly cashflow
- —
- DSCR
- —
- Eligible?
- —
Personal DTI + credit; lowest rate.
DSCR
20% down · 8.5% · 30yr
- Down + closing
- —
- Monthly P&I
- —
- Monthly cashflow
- —
- DSCR
- —
- Eligible?
- —
No personal income docs; deal must DSCR.
Hard money
10% down · 12.0% · 12mo
- Down + closing
- —
- Monthly P&I
- —
- Monthly cashflow
- —
- DSCR
- —
- Eligible?
- —
Short-term bridge; refi at stabilization.
Rent comps 14 comps
| Address | Beds | Baths | Sqft | Rent | $/sqft | DOM | Units | Dist |
|---|---|---|---|---|---|---|---|---|
| 130 Hazy Ln Hinesville, GA | 3.0 | 2.5 | 1518 | $2,100 | $1.38 | 43d | 1 | 0.66mi |
| 193 Heirloom Rd Hinesville, GA | 3.0 | 2.5 | 1400 | $2,300 | $1.64 | 43d | 1 | 0.75mi |
| 158 Hamlet Ct Hinesville, GA | 3.0 | 2.5 | 1458 | $2,250 | $1.54 | 43d | 1 | 0.81mi |
| 96 Beaumont Dr Unit 1 Hinesville, GA | 3.0 | 2.0 | 1400 | $1,975 | $1.41 | 43d | 1 | 0.82mi |
| 709 English Oak Dr Hinesville, GA | 4.0 | 2.5 | 2323 | $2,500 | $1.08 | 43d | 1 | 0.92mi |
| 78 Centennial Ct Hinesville, GA | 3.0 | 2.5 | 1462 | $2,100 | $1.44 | 43d | 1 | 0.94mi |
| 100 Centennial Ct Hinesville, GA | 3.0 | 2.5 | 1703 | $2,150 | $1.26 | 43d | 1 | 0.96mi |
| 619 Olmstead Dr Hinesville, GA | 3.0 | 2.0 | 1745 | $3,000 | $1.72 | 43d | 1 | 1.13mi |
| 807 Kings Rd Hinesville, GA | 4.0 | 2.5 | 2400 | $2,200 | $0.92 | 43d | 1 | 1.14mi |
| 1235 Peacock Trl Hinesville, GA | 3.0 | 2.5 | 1876 | $2,150 | $1.15 | 43d | 1 | 1.20mi |
| 350 Beverly St #124 Hinesville, GA | 3.0 | 2.0 | 1228 | $1,400 | $1.14 | 43d | 1 | 1.31mi |
| 209 School House Rd Hinesville, GA | 4.0 | 2.0 | 1802 | $2,100 | $1.17 | 43d | 1 | 1.31mi |
| 231 Honey Lane Cir Hinesville, GA | 3.0 | 1.5 | 1242 | $1,800 | $1.45 | 43d | 1 | 1.42mi |
| 730 Dover Ln Hinesville, GA | 3.0 | 2.0 | 1650 | $1,700 | $1.03 | 43d | 1 | 1.49mi |
Listing history 26 events
-
2026-06-19days on market $249,000 Active 325 DOM
-
2026-06-18days on market $249,000 Active 324 DOM
-
2026-06-17days on market $249,000 Active 323 DOM
-
2026-06-16days on market $249,000 Active 322 DOM
-
2026-06-15days on market $249,000 Active 321 DOM
-
2026-06-14days on market $249,000 Active 319 DOM
-
2026-06-13days on market $249,000 Active 318 DOM
-
2026-06-10days on market $249,000 Active 316 DOM
-
2026-06-09days on market $249,000 Active 315 DOM
-
2026-06-08days on market $249,000 Active 314 DOM
-
2026-06-07days on market $249,000 Active 313 DOM
-
2026-06-05days on market $249,000 Active 310 DOM
-
2026-06-03days on market $249,000 Active 309 DOM
-
2026-06-02days on market $249,000 Active 308 DOM
-
2026-06-01days on market $249,000 Active 307 DOM
-
2026-05-31days on market $249,000 Active 306 DOM
-
2026-05-30days on market $249,000 Active 305 DOM
-
2026-04-18price $249,000
-
2025-07-29$250,000 Active
-
2025-03-21historical $1,400
-
2025-03-07$1,400
-
2022-03-16price $1,000
-
2016-04-12historical
-
2016-04-12historical
-
2015-02-24$95,500
-
2015-02-24$95,500
ⓘ Source: listings_history table (triggers on properties + properties_extension) + one-shot
backfill from property_details.listing_events for pre-trigger history.
Tax reassessment forecast GA · Resets to sale price
- Current annual tax
- $3,527 · $294/mo
- Projected year-2 tax
- $3,527 · $294/mo
- Expected delta
- $0/yr ($0/mo · 0.0%)
ⓘ Screening estimate from a state-policy table — verify with the county assessor before closing.
Climate risk First Street
- Flood 1/10 Low FEMA zone X (shaded) · 0% chance over 30 yrs
- Wildfire 4/10 Moderate
- Heat 9/10 Extreme 7 d/yr ≥110°F today · 18 d/yr by 30 yrs out
- Wind 8/10 Severe 99% chance of damaging wind over 30 yrs
- Air quality 2/10 Low 2 unhealthy d/yr today · 2 by 30 yrs out
Nearby sold comps map
Loading sold comps map…
Walkable amenities ~0.75 mi
Loading nearby amenities…
Taxation est. · year 1
- Rental income
- $25,959
- − Mortgage interest
- −$13,948
- − Property taxes
- −$3,527
- − Insurance
- −$1,245
- − Repairs & maintenance
- −$2,077
- − Management
- −$2,077
- − Depreciation
- −$7,244
- Taxable loss
- −$4,158
- Est. tax savings @ 24.0%
- +$998
- After-tax cash flow
- $1,064/yr
For passive investors: Depreciation is non-cash, so a rental often shows a tax loss while cash-flowing — sheltering income. Rental losses are passive: they offset passive income freely, and up to $25,000/yr can offset ordinary (W-2) income if you actively participate and your MAGI is under $100k (phasing out to $0 by $150k); unused losses carry forward. On sale, claimed depreciation is recaptured at up to 25%, and gains may owe capital-gains tax (a 1031 exchange can defer both). Figures are a year-1 estimate at your 24.0% rate — not tax advice; consult a CPA.
Schools (NCES district)
- District
- Liberty County
- NCES district ID
- 1303300
- Math proficiency
- 19% ▼ -16.00%
- Reading proficiency
- 28% ▼ -13.00%
- Median HH income
- $43,911
- Composite
- 20.2/100
- National rank
- #8630
- State rank
- #133 of 174 in GA
Livability — Hinesville
- Score
- 73/100
- State rank
- #51
- US rank
- #5200
Category grades
Schools grade is shown separately in the Schools card above.
Census & demographics
- Census place
- Hinesville, GA
- County
- Liberty County · 58,565 people
- City population
- 42,838
- Metro
- Hinesville, GA
- Population (ZIP)
- 42,838
- Household income
- $60,233
- Rent vs Own
- Severe rent burden
- 1693.0
Population outlook (Liberty County) Hauer SSP2
- Today (2025)
- 58,689 people
- By 2030
- 57,670 · -1.7%
- By 2040
- 55,750 · -5.0%
- By 2050
- 54,155 · -7.7%
- By 2075
- 58,947 · +0.4%
- By 2100
- 66,919 · +14.0%
Race, ethnicity, and origin ACS 2023
- Neighborhood character
- Diverse neighborhood (Simpson 0.67)
- Race & ethnicity
- Black 47% White 31% Hispanic / Latino 13% Two or more races 11% Asian 2%
- Hispanic origin (detail)
- Mexican 4% Puerto Rican 7%
- Common ancestry
- Slovak 1% Italian 1% Lithuanian 1%
- Foreign-born
- 7% · Canada, South Korea
- Languages at home
- 86% English-only · Spanish 7% Other Indo-European 2% German/W. Germanic 1%
Political lean MEDSL · Liberty
- 2024 margin
- D (+17.4) · D 58.5% · R 41.0%
- 2008→2024 swing
- -10.9pp toward R · 2008: 28.4pp · 2024: 17.4pp
- All cycles
- 2024: D+17.4 2020: D+24.1 2016: D+21.2 2012: D+30.2 2008: D+28.4
Not yet ingested
- Civics
- —
Market trends
- HPI YoY
- ▼ -77.50%
- Current HPI
- 208.0927
- Rent YoY
- ▲ 5.41%
- Metro
- Hinesville, GA
- State GDP YoY
- ▲ 2.66%
- F500 in state
- 28
Industry mix (Fortune 500 HQ in GA)
| Industry | F500 HQs | Revenue |
|---|---|---|
| Paper / Packaging | 2 | $29B |
|
||
| Retail | 1 | $160B |
|
||
| Transportation / Logistics | 1 | $91B |
|
||
| Airlines | 1 | $62B |
|
||
| Consumer Goods | 1 | $47B |
|
||
| Utilities | 1 | $25B |
|
||
Price history
+160.7% since first listed9 events — show timeline
- 2026-04-18 Price Changed $249,000 HABR
- 2025-07-29 Listed $250,000 HABR
- 2025-03-21 Rental Removed $1,400 APPFOLIO
- 2025-03-07 Listed for Rent $1,400 APPFOLIO
- 2022-03-16 Price Changed $1,000 RENT.
- 2016-04-12 Listing Removed — Hive MLS
- 2016-04-12 Listing Removed — Hive MLS
- 2015-02-24 Listed $95,500 Hive MLS
- 2015-02-24 Listed $95,500 Hive MLS
Property tax history
+6.0%/yrLatest (2025): $3,527 · +6.6% YoY. Source: county tax records.
Cash-flow waterfall
monthlySold comps — $/sqft
last 12 mo · ≤1 miLoading sold comps…