 Duplex
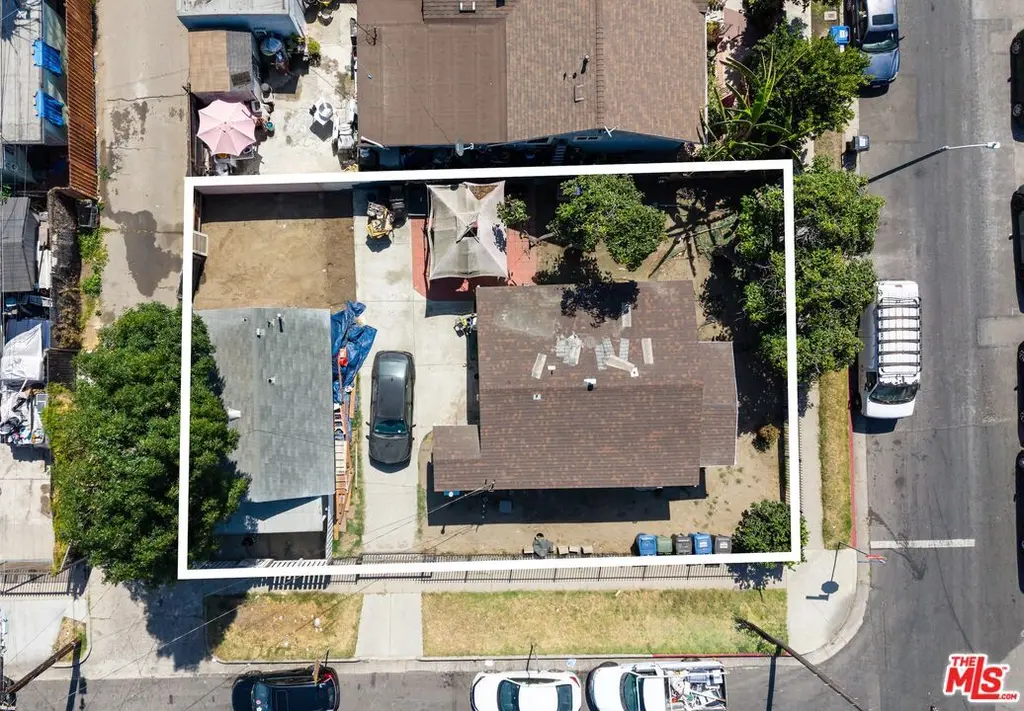
1161 W 67th St · Los Angeles, CA
Flood risk 1/10 · Minimal
- FEMA flood zone
- X (shaded)
- Chance of flooding over 30 yrs
- 0.0%
- Est. flood insurance / yr
- $507 – $1,088
Fire risk 1/10 · Minimal
- Est. fire insurance / yr
- $659 – $1,223
Heat risk 5/10 · Moderate
- Hot days now (above 88°F)
- 7 days/yr
- Hot days in 30 yrs
- 21 days/yr
Wind risk 1/10 · Minimal
- Chance of severe wind over 30 yrs
- —
Air-quality risk 5/10 · Moderate
- Unhealthy air days now
- 7 days/yr
- Unhealthy air days in 30 yrs
- 7 days/yr
Risk factors via First Street. Map © Google.
Why this score? — see what drove the B- grade
The composite is a weighted blend of 9 inputs, each scored 0–100. Each bar is that input's sub-score; the figure is the points it added to the 100-point composite (weight × sub-score).
- Cash flow +29.8/30.0
- DSCR +10.0/10.0
- 1% rule +8.4/10.0
- ARV discount +7.5/15.0
- Schools +3.6/10.0
- Livability +3.4/5.0
- Condition / age +2.5/5.0
- Rent growth +1.9/5.0
- Appreciation +0.0/10.0
$400,000
🖨 Deal sheet 📄 Offer letter ✓ Due diligence
Multi-family units
County records classify this as Multi-Family (2-4 Unit). Listing-text estimate: 2 units. confirmed
Listing remarks
Two Homes on one Lot! Welcome to 1161 67th St and 6624 S Budlong, located in prime Los Angeles Duplex and Priced to Sell. The property is gated all around and offers plenty of on-site parking, making it a strong opportunity for both investors and owner-occupants. The property is livable as-is, but with some updates and improvements, it has the potential to become a shining gem. Whether you're looking to generate rental income, occupy one unit and rent the other, or add value over time, this duplex offers flexibility and upside in a desirable Los Angeles location.
Key facts
- Two homes on one lot
- On-site parking
- Gated all around
Tags
Property features AI
Finance
- Financial info: Gross income reported: $24,000; Gross operating income reported: $24,000; Net operating income reported: $24,000; Gross rent multiplier: 10; Unit 1 — 2 beds, 1 bath; actual rent $1,500; projected rent $3,000; Unit 2 — 1 bed, 1 bath; actual rent $500; projected rent $1,500; Two buildings on the property
- HOA & community: Two-unit complex
Exterior
- Parking: Gated garage; 3 total parking spaces
- Security: Gated community/features
- Utilities: Water heaters present
- Home design: Residential income property; One level
- Construction: Detached structure
- Exterior features: Guest house; Has city view; Gated
Interior
- Kitchen: Gas cooktop; Gas oven/range; Range hood; Microwave; Kitchenette; Pantry; Refrigerator
- Bedrooms: Main floor bedroom; All bedrooms on main level; Dressing area
- Bathrooms: Shower and tub; Low-flow toilets
- Heating & cooling: Central heating; Wall/window air conditioning units
- Interior features: Detached, no common walls; City view
- Laundry & utility: In-unit laundry; Water heaters present
Neighborhood map
What this means for you Summary
Snapshot
- This is a 2 × 3-bed/2.0-bath units multifamily listed at $400k.
Deal economics
- At list price, monthly cash flow is $1k ($18k/yr) — positive. Per door: $735/mo.
- The deal already cash-flows at list — no discount required.
- Meets the 1% rule at list price ($5k rent vs $400k).
- Cap rate 10.7% vs local median 2.1% in Los Angeles — top-decile yield for the area; either an underpriced asset or a hidden risk that comps aren't pricing in. Stress-test before assuming the spread holds.
Location & tenants
- Location reads 68/100 on livability (#273 in CA) — a middle-class / working-renter tenant base. Strengths: amenities A+, commute A+, employment B; Watch: health & safety C-, schools D+, crime F.
- Los Angeles Unified (urban): math 29% / reading 54% proficiency, ranked #223 of 517 in CA (top 43%) — families likely to look elsewhere, expect single-tenant / working-renter base with shorter leases; 67% free/reduced lunch — lower-income household profile, screen leases tightly.
- Market conditions: Rents soft (-2.5%/yr); 172 active listings in the ZIP; 9 comparable units currently listed for rent nearby; rentals lingering (median 44d on market — plan ~5-8 weeks vacancy on turnover, expect pricing pressure); 67% of comp listings sitting > 30 days — soft ceiling on asking rent; 19,697 units permitted in Los Angeles County in 2024 (9,426 in 5+ unit buildings).
- At $5,360/mo this rent would consume 121% of the median local household income ($53k/yr) (locally 7490% of renters already pay >50% of income on rent) — very limited rent-growth headroom before tenants either downsize or default.
Forward outlook
- Local home prices are declining (-3.0%/yr); year-one equity from $3k of loan paydown is wiped out by about $12k of value loss. Plan a longer hold.
- Los Angeles County population projected at +9% by 2050 — modest demand growth; plan on rents tracking national, not racing it.
Negotiation context
- Only 13 days on market — expect competitive offers; lowballing is unlikely to land.
Risks & watch-outs
- Watch-outs: built in 1922 — expect roof / HVAC / electrical / plumbing capex.
- Climate carrying-cost: extreme-heat days projected 7→21/yr by 2055 (HVAC capex compounding) — expect insurance premiums to compound above CPI over the hold.
Questions for the listing agent
- Can we see the unit-by-unit rent roll, current vacancy, and any below-market leases? What's the average tenancy length?
- What capital expenditures (roof, boiler, parking lot, exteriors) have been made in the last 5 years, and what's planned in the next 2?
- Built in 1922 — when were the roof, HVAC, electrical panel, plumbing, and water heater last replaced?
- Is there a deadline driving the sale (1031 exchange, divorce, estate, relocation)? That informs how much negotiation room exists.
- Schools are D-rated, which usually means shorter tenancies and higher turnover. Who's the typical renter profile here, and what's been the actual vacancy rate?
- Crime grade is F in this area — have there been break-ins, vandalism, or insurance claims at this property in the last 3 years? What carrier currently insures it and at what premium?
- What's the average days-on-market for RENTAL listings here right now (not sales)? A rising rental-DOM trend means longer vacancies and softer asking-rent achievability than the comps imply.
- What's the recent tenant-quality profile in this submarket — average credit score on applications, eviction rate, late-payment / NSF rate, and stable-employment percentage? A property-management company in the area should have these aggregated.
- How much new apartment / multifamily construction is in the pipeline within 1–3 miles? Heavy new supply (>2% of stock underway) typically softens rents 12–24 months out; light construction supports rent growth.
Investment metrics
- 1% rule
- 1.34% ✓
- Cap rate
- 10.70%
- Cash-on-cash
- 15.75%
- DSCR
- 1.70
- GRM
- 6.2
CMA / ARV
No comps found within radius.
Projected returns pro-forma
-3.0% appreciation · 0.0% rent growth · sell at horizon
- IRR
- 3.2%
- Equity multiple
- 1.12×
- Total profit
- $13,186
- Equity at exit
- $59,641
- IRR
- 9.6%
- Equity multiple
- 1.64×
- Total profit
- $71,670
- Equity at exit
- $34,585
Cash invested: $112,000 (down + closing). Projections, not guarantees.
Landlord ↔ Tenant lean methodology
- Overall (CITY)
- 0 Strongly Tenant-Friendly
- State California
- 18 Strongly Tenant-Friendly · D+13
- County
- — inherits STATE
- City Los Angeles
- 0 Strongly Tenant-Friendly · D+22
ZIP-level market 90044
- Rents YoY
- -2.5%
- Active inventory
- 172
- Price-to-rent
- 12.4×
Monthly cashflow live
- Estimated rent
- $5,360 high interval (Pro) →
- Mortgage (P&I)
- −$2,098
- Tax est. 1.5%
- −$500 /mo · $6,000/yr
- Insurance
- −$167
- HOA
- −$0
- Vacancy / Maint / Mgmt
- −$1,126
- Net cashflow
- $1,470
Break-even live
2-unit breakdown (identical units grouped — click to expand)
| Units | Beds | Baths | Est. rent |
|---|---|---|---|
| 2× units | 3 | 2 | $5,360 |
| #1 | 3 | 2 | $2,680 |
| #2 | 3 | 2 | $2,680 |
| Total (2 units) | $5,360 | ||
UW: 25.0% down · 7.5% · 30yr · 1.5% tax · 5.0% vac · 8.0% maint · 8.0% mgmt
Financing live
Cash to close
- Down payment
- $100,000
- Closing costs
- $12,000
- Reserves months
- —
- Total cash needed
- —
Loan-product check · same deal, 3 products live
Conventional
25% down · 7.5% · 30yr
- Down + closing
- —
- Monthly P&I
- —
- Monthly cashflow
- —
- DSCR
- —
- Eligible?
- —
Personal DTI + credit; lowest rate.
DSCR
20% down · 8.5% · 30yr
- Down + closing
- —
- Monthly P&I
- —
- Monthly cashflow
- —
- DSCR
- —
- Eligible?
- —
No personal income docs; deal must DSCR.
Hard money
10% down · 12.0% · 12mo
- Down + closing
- —
- Monthly P&I
- —
- Monthly cashflow
- —
- DSCR
- —
- Eligible?
- —
Short-term bridge; refi at stabilization.
Rent comps 9 comps
| Address | Beds | Baths | Sqft | Rent | $/sqft | DOM | Units | Dist |
|---|---|---|---|---|---|---|---|---|
| 1024 W 77th St Los Angeles, CA | — | 1.0 | 230 | $1,250 | $5.43 | 43d | 1 | 0.64mi |
| 7524 S Hoover St Los Angeles, CA | 1.0 | 1.0 | 371 | $1,556 | $4.19 | 3d | 2 | 0.76mi |
| 823 W 78th St Los Angeles, CA | — | 1.0 | 250 | $1,600 | $6.40 | 43d | 1 | 0.83mi |
| 445 W Florence Ave Los Angeles, CA | 1.0 | 1.0 | 255 | $1,423 | $5.57 | 43d | 3 | 0.85mi |
| 1220 W 56th St Unit 1/2 Los Angeles, CA | — | 1.0 | 234 | $1,250 | $5.34 | 43d | 1 | 0.85mi |
| 443 1/2 W Florence Ave Los Angeles, CA | — | 1.0 | 221 | $1,293 | $5.85 | 22d | 1 | 0.85mi |
| 443 W Florence Ave Unit 445 Los Angeles, CA | 1.0 | 1.0 | 358 | $1,423 | $3.97 | 22d | 1 | 0.85mi |
| 523 W 78th St Los Angeles, CA | — | 1.0 | 250 | $1,400 | $5.60 | 43d | 1 | 0.99mi |
| 7311 S Broadway Unit 100 Los Angeles, CA | 1.0 | 1.0 | 367 | $2,100 | $5.72 | 43d | 1 | 1.07mi |
Listing history 10 events
-
2026-06-18days on market $400,000 Active 13 DOM
-
2026-06-17days on market $400,000 Active 12 DOM
-
2026-06-16days on market $400,000 Active 11 DOM
-
2026-06-15days on market $400,000 Active 10 DOM
-
2026-06-13days on market $400,000 Active 8 DOM
-
2026-06-10price $400,000 Active 4 DOM
-
2026-06-09days on market $450,000 Active 4 DOM
-
2026-06-08days on market $450,000 Active 3 DOM
-
2026-06-07remarks 569-char remark
-
2026-06-07$450,000 Active 2 DOM
ⓘ Source: listings_history table (triggers on properties + properties_extension) + one-shot
backfill from property_details.listing_events for pre-trigger history.
Climate risk First Street
- Flood 1/10 Low FEMA zone X (shaded) · 0% chance over 30 yrs
- Wildfire 1/10 Low
- Heat 5/10 Major 7 d/yr ≥88°F today · 21 d/yr by 30 yrs out
- Wind 1/10 Low
- Air quality 5/10 Major 7 unhealthy d/yr today · 7 by 30 yrs out
Nearby sold comps map
Loading sold comps map…
Walkable amenities ~0.75 mi
Loading nearby amenities…
Taxation est. · year 1
- Rental income
- $64,320
- − Mortgage interest
- −$22,406
- − Property taxes
- −$6,000
- − Insurance
- −$2,000
- − Repairs & maintenance
- −$5,146
- − Management
- −$5,146
- − Depreciation
- −$11,636
- Taxable income
- $11,986
- Est. tax owed @ 24.0%
- −$2,877
- After-tax cash flow
- $14,764/yr
For passive investors: Depreciation is non-cash, so a rental often shows a tax loss while cash-flowing — sheltering income. Rental losses are passive: they offset passive income freely, and up to $25,000/yr can offset ordinary (W-2) income if you actively participate and your MAGI is under $100k (phasing out to $0 by $150k); unused losses carry forward. On sale, claimed depreciation is recaptured at up to 25%, and gains may owe capital-gains tax (a 1031 exchange can defer both). Figures are a year-1 estimate at your 24.0% rate — not tax advice; consult a CPA.
Schools (NCES district)
- District
- Los Angeles Unified
- NCES district ID
- 0622710
- Math proficiency
- 29% ▼ -4.00%
- Reading proficiency
- 54% ▲ 10.00%
- Median HH income
- $50,403
- Composite
- 35.67/100
- National rank
- #4875
- State rank
- #223 of 517 in CA
Livability — Los Angeles
- Score
- 68/100
- State rank
- #273
- US rank
- #9237
Category grades
Schools grade is shown separately in the Schools card above.
Census & demographics
- Census place
- Los Angeles, CA
- County
- Los Angeles County · 9,444,647 people
- City population
- 3,838,149
- Metro
- Los Angeles-Long Beach-Anaheim, CA
- Population (ZIP)
- 94,830
- Household income
- $53,302
- Rent vs Own
- Severe rent burden
- 7490.0
Population outlook (Los Angeles County) Hauer SSP2
- Today (2025)
- 10,940,515 people
- By 2030
- 11,256,481 · +2.9%
- By 2040
- 11,729,929 · +7.2%
- By 2050
- 11,948,407 · +9.2%
- By 2075
- 11,818,114 · +8.0%
- By 2100
- 10,842,928 · -0.9%
Race, ethnicity, and origin ACS 2023
- Neighborhood character
- Predominantly Hispanic (67%)
- Race & ethnicity
- Hispanic / Latino 67% Black 29% Two or more races 23% White 1% Native American 1%
- Hispanic origin (detail)
- Mexican 39%
- Foreign-born
- 34% · Canada
- Languages at home
- 37% English-only · Spanish 62%
Political lean MEDSL · Los Angeles
- 2024 margin
- Solid D (+32.9) · D 64.8% · R 31.9% · Other 3.3%
- 2008→2024 swing
- -7.4pp toward R · 2008: 40.4pp · 2024: 32.9pp
- All cycles
- 2024: D+32.9 2020: D+44.2 2016: D+48.0 2012: D+40.0 2008: D+40.4
Not yet ingested
- Civics
- —
Market trends
- HPI YoY
- ▼ -691.99%
- Current HPI
- 467.9845
- Rent YoY
- ▼ -2.50%
- Metro
- Los Angeles-Long Beach-Anaheim, CA
- State GDP YoY
- ▲ 3.21%
- F500 in state
- 116
Industry mix (Fortune 500 HQ in CA)
| Industry | F500 HQs | Revenue |
|---|---|---|
| Technology | 27 | $1,492B |
|
||
| Financial Services | 3 | $174B |
|
||
| Retail | 3 | $44B |
|
||
| Insurance | 3 | $26B |
|
||
| Media / Entertainment | 2 | $115B |
|
||
| Pharmaceuticals / Biotech | 2 | $62B |
|
||
Price history
1 event — show timeline
- 2026-06-05 Listed $450,000 TheMLS
Property tax history
+1.8%/yrLatest (2025): $667 · +7.2% YoY. Source: county tax records.
Cash-flow waterfall
monthlySold comps — $/sqft
last 12 mo · ≤1 miLoading sold comps…