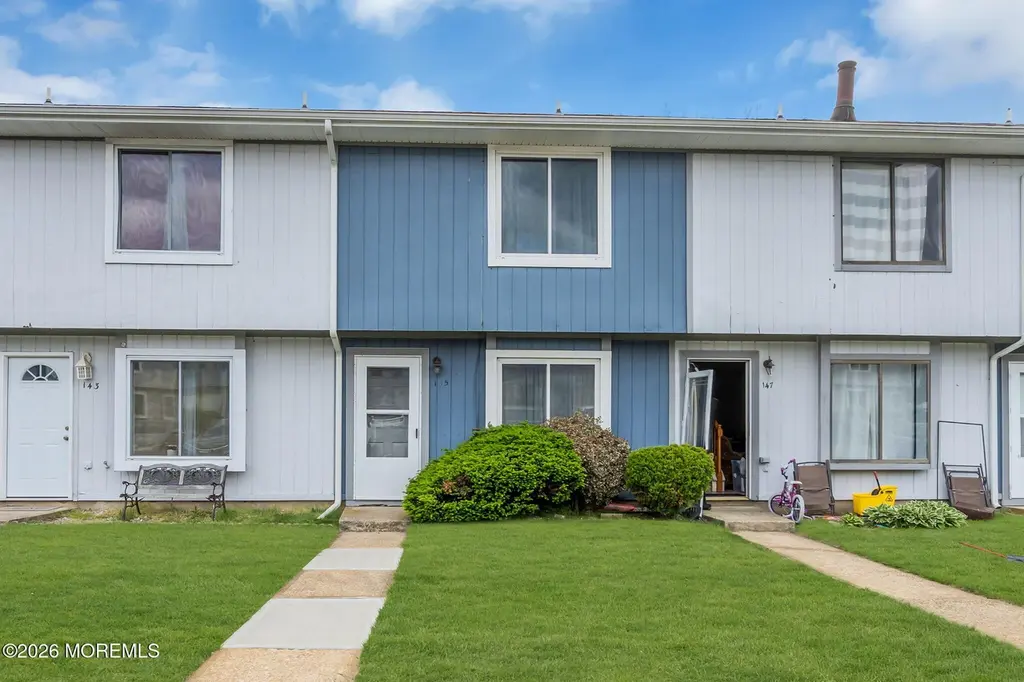
145 Creek Rd #495 · Allenwood, NJ
Flood risk 1/10 · Minimal
- FEMA flood zone
- X (unshaded)
- Chance of flooding over 30 yrs
- 0.0%
- Est. flood insurance / yr
- $507 – $1,088
Fire risk 2/10 · Minimal
- Est. fire insurance / yr
- $526 – $976
Heat risk 8/10 · Major
- Hot days now (above 98°F)
- 7 days/yr
- Hot days in 30 yrs
- 15 days/yr
Wind risk 8/10 · Major
- Chance of severe wind over 30 yrs
- 80.0%
Air-quality risk 3/10 · Minor
- Unhealthy air days now
- 3 days/yr
- Unhealthy air days in 30 yrs
- 5 days/yr
Risk factors via First Street. Map © Google.
Why this score? — see what drove the D grade
The composite is a weighted blend of 9 inputs, each scored 0–100. Each bar is that input's sub-score; the figure is the points it added to the 100-point composite (weight × sub-score).
- ARV discount +13.0/15.0
- Cash flow +10.4/30.0
- 1% rule +4.3/10.0
- Livability +3.5/5.0
- DSCR +3.0/10.0
- Schools +2.8/10.0
- Rent growth +2.5/5.0
- Condition / age +2.5/5.0
- Appreciation +0.0/10.0
$249,000
🖨 Deal sheet 📄 Offer letter ✓ Due diligence
Listing remarks
This is a coming soon and cannot be shown till ///may 16th 2026! Come make this Two Bedroom One Plus Half Bath Townhouse your own! Located in Millbrook Manor. Priced To Sell! Home is located close to all Toll Roads and Major Highways. Close to Beautiful Beaches!
Key facts
- $225 HOA
- Pool
- Built 1988
Property features AI
Finance
- HOA & community: Monthly association fee of $225; HOA covers common area, lawn maintenance, and snow removal
Exterior
- Parking: No garage
- Utilities: Public sewer
- Home design: Condominium; Attached property
- Exterior features: Shingle roof
Interior
- Kitchen: Stove included
- Bedrooms: 2 bedrooms
- Flooring: Laminate
- Bathrooms: 1 full bathroom and 1 half bathroom (1.5 total)
- Heating & cooling: Forced air heating; Central air conditioning
- Interior features: Includes washer, dryer, and stove; Laminate flooring; No fireplace; No basement
- Laundry & utility: Washer and dryer included
Neighborhood map
What this means for you Summary
Snapshot
- This is a 2-bed/2.0-bath condo listed at $249k.
Deal economics
- At list price, monthly cash flow is $-131 ($-2k/yr) — negative.
- To cash-flow at today's rent, offer at most $226k (9.3% below list).
- To meet the 1% rule (rent ≥ 1% of price), the offer needs to be $232k (7.0% below list).
- Recommended offer: $226k (9.3% below list) — sets the bar for cash-flow.
- Cap rate 5.7% vs local median 2.4% in Allenwood — top-decile yield for the area; either an underpriced asset or a hidden risk that comps aren't pricing in. Stress-test before assuming the spread holds.
Location & tenants
- Location reads 69/100 on livability (#286 in NJ) — a middle-class / working-renter tenant base. Strengths: schools A+, crime A+, employment A+; Watch: amenities F, commute F, cost of living F.
- Brick Township Public School District (suburban): math 18% / reading 43% proficiency, ranked #330 of 472 in NJ (top 70%) — families likely to look elsewhere, expect single-tenant / working-renter base with shorter leases.
- Market conditions: 284 active listings in the ZIP; 7 comparable units currently listed for rent nearby; rentals at typical pace (median 25d on market — plan ~3-4 weeks tenant-placement turnaround); 4,434 units permitted in Ocean County in 2024 (868 in 5+ unit buildings).
Forward outlook
- Local home prices are declining (-3.0%/yr); year-one equity from $2k of loan paydown is wiped out by about $7k of value loss. Plan a longer hold.
- Ocean County population projected to shrink 8% by 2050 — rents likely to lag national; underwrite the cash flow, not the appreciation.
Negotiation context
- It's been on market 16 days — a 2% lower offer ($245k) is reasonable based on typical stale-listing flexibility.
- Current owner paid $39k; list at $249k implies a 535% gain — meaningful room to come down on a strong offer.
Risks & watch-outs
- Climate carrying-cost: severe wind risk, 80% chance of damaging wind over 30y; extreme-heat days projected 7→15/yr by 2055 (HVAC capex compounding) — expect insurance premiums to compound above CPI over the hold.
Questions for the listing agent
- What do current leases actually rent for vs. the listed asking? Can we see a recent rent roll and the last 12 months of T-12 income?
- What does the HOA fee cover, when was the last increase, and are there any pending special assessments or reserve-fund shortfalls?
- Any open or pending special assessments — roof, HVAC, plumbing, elevator, façade? What's the per-unit balance and payoff schedule, and is the seller paying it off at close or rolling it to the buyer?
- Is there a deadline driving the sale (1031 exchange, divorce, estate, relocation)? That informs how much negotiation room exists.
- Schools are A-rated — typically a magnet for longer-tenancy family renters. What's the average tenant stay here, and is there a school-zone premium baked into asking?
- The area grade is low — what's the realistic commute time and amenity access for the typical tenant pool here? Any planned neighborhood developments (good or bad) we should know about?
- What's the average days-on-market for RENTAL listings here right now (not sales)? A rising rental-DOM trend means longer vacancies and softer asking-rent achievability than the comps imply.
- What's the recent tenant-quality profile in this submarket — average credit score on applications, eviction rate, late-payment / NSF rate, and stable-employment percentage? A property-management company in the area should have these aggregated.
- How much new apartment / multifamily construction is in the pipeline within 1–3 miles? Heavy new supply (>2% of stock underway) typically softens rents 12–24 months out; light construction supports rent growth.
Investment metrics
- 1% rule
- 0.93% ✗
- Cap rate
- 5.66%
- Cash-on-cash
- -2.25%
- DSCR
- 0.90
- GRM
- 9.0
CMA / ARV
- ARV (median comp)
- $283,716
- List price
- $249,000
- Delta
- -12.24%
- Verdict
- UNDERPRICED
- Comps
- 20 within 1.0 mi
Projected returns pro-forma
-3.0% appreciation · 3.0% rent growth · sell at horizon
- IRR
- -19.9%
- Equity multiple
- 0.30×
- Total profit
- $-48,480
- Equity at exit
- $37,127
- IRR
- -12.7%
- Equity multiple
- 0.25×
- Total profit
- $-52,182
- Equity at exit
- $21,529
Cash invested: $69,720 (down + closing). Projections, not guarantees.
Landlord ↔ Tenant lean methodology
- Overall (STATE)
- 21 Tenant-Leaning
- State New Jersey
- 21 Tenant-Leaning · D+6
- County
- — inherits STATE
- City
- — inherits STATE
ZIP-level market 08724
- Active inventory
- 284
- Price-to-rent
- 9.0×
Monthly cashflow live
- Estimated rent
- $2,315 high interval (Pro) →
- Mortgage (P&I)
- −$1,306
- Tax from tax record
- −$325 /mo · $3,900/yr
- Insurance
- −$104
- HOA
- −$225
- Vacancy / Maint / Mgmt
- −$486
- Net cashflow
- $-131
Break-even live
UW: 25.0% down · 7.5% · 30yr · 1.5% tax · 5.0% vac · 8.0% maint · 8.0% mgmt
Financing live
Cash to close
- Down payment
- $62,250
- Closing costs
- $7,470
- Reserves months
- —
- Total cash needed
- —
Loan-product check · same deal, 3 products live
Conventional
25% down · 7.5% · 30yr
- Down + closing
- —
- Monthly P&I
- —
- Monthly cashflow
- —
- DSCR
- —
- Eligible?
- —
Personal DTI + credit; lowest rate.
DSCR
20% down · 8.5% · 30yr
- Down + closing
- —
- Monthly P&I
- —
- Monthly cashflow
- —
- DSCR
- —
- Eligible?
- —
No personal income docs; deal must DSCR.
Hard money
10% down · 12.0% · 12mo
- Down + closing
- —
- Monthly P&I
- —
- Monthly cashflow
- —
- DSCR
- —
- Eligible?
- —
Short-term bridge; refi at stabilization.
Rent comps 7 comps
| Address | Beds | Baths | Sqft | Rent | $/sqft | DOM | Units | Dist |
|---|---|---|---|---|---|---|---|---|
| 36 Creek Rd Brick Township, NJ | 2.0 | 1.5 | 1088 | $2,500 | $2.30 | 24d | 1 | 0.05mi |
| 1126 Sawmill Rd #147 Brick, NJ | 2.0 | 1.5 | 1088 | $2,000 | $1.84 | 17d | 1 | 0.10mi |
| 1128 Sawmill Rd #148 Brick, NJ | 2.0 | 2.5 | 1088 | $2,500 | $2.30 | 2d | 1 | 0.10mi |
| 1144 Sawmill Rd #121 Brick, NJ | 2.0 | 1.5 | 1088 | $2,500 | $2.30 | 13d | 1 | 0.11mi |
| 230 Sawmill Rd Unit A Brick Township, NJ | 2.0 | 1.0 | 1014 | $2,100 | $2.07 | 24d | 1 | 0.19mi |
| 226A Sawmill Rd Brick Township, NJ | 2.0 | 1.0 | 1014 | $2,100 | $2.07 | 24d | 1 | 0.19mi |
| 47 Newport Ct Brick Township, NJ | 2.0 | 1.0 | 1022 | $2,100 | $2.05 | 24d | 1 | 1.42mi |
HOA detail condo
- Monthly dues
- $225 · $2,700/yr
- Assessments
- None detected in remarks — confirm with the listing agent.
Listing history 5 events
-
2026-06-01statusdays on market $249,000 Pending 16 DOM
-
2026-05-31days on market $249,000 Active 15 DOM
-
2026-05-16$249,000 Active 262-char remark
-
2026-05-11historical $249,000 262-char remark
-
1984-11-01soldstatus $39,200
ⓘ Source: listings_history table (triggers on properties + properties_extension) + one-shot
backfill from property_details.listing_events for pre-trigger history.
Tax reassessment forecast NJ · Partial reset (capped growth)
- Current annual tax
- $3,900 · $325/mo
- Projected year-2 tax
- $5,050 · $421/mo
- Expected delta
- +$1,150/yr (+$96/mo · 29.5%)
ⓘ Screening estimate from a state-policy table — verify with the county assessor before closing.
Climate risk First Street
- Flood 1/10 Low FEMA zone X (unshaded) · 0% chance over 30 yrs
- Wildfire 2/10 Low
- Heat 8/10 Severe 7 d/yr ≥98°F today · 15 d/yr by 30 yrs out
- Wind 8/10 Severe 80% chance of damaging wind over 30 yrs
- Air quality 3/10 Moderate 3 unhealthy d/yr today · 5 by 30 yrs out
Nearby sold comps map
Loading sold comps map…
Walkable amenities ~0.75 mi
Loading nearby amenities…
Taxation est. · year 1
- Rental income
- $27,782
- − Mortgage interest
- −$13,948
- − Property taxes
- −$3,900
- − Insurance
- −$1,245
- − Repairs & maintenance
- −$2,223
- − Management
- −$2,223
- − HOA
- −$2,700
- − Depreciation
- −$7,244
- Taxable loss
- −$5,699
- Est. tax savings @ 24.0%
- +$1,368
- After-tax cash flow
- $-198/yr
For passive investors: Depreciation is non-cash, so a rental often shows a tax loss while cash-flowing — sheltering income. Rental losses are passive: they offset passive income freely, and up to $25,000/yr can offset ordinary (W-2) income if you actively participate and your MAGI is under $100k (phasing out to $0 by $150k); unused losses carry forward. On sale, claimed depreciation is recaptured at up to 25%, and gains may owe capital-gains tax (a 1031 exchange can defer both). Figures are a year-1 estimate at your 24.0% rate — not tax advice; consult a CPA.
Schools (NCES district)
- District
- Brick Township Public School District
- NCES district ID
- 3402220
- Math proficiency
- 18% ▼ -24.00%
- Reading proficiency
- 43% ▼ -15.00%
- Median HH income
- $68,717
- Composite
- 28.31/100
- National rank
- #6785
- State rank
- #330 of 472 in NJ
Livability — Allenwood
- Score
- 69/100
- State rank
- #286
- US rank
- #8465
Category grades
Schools grade is shown separately in the Schools card above.
Census & demographics
- Population (ZIP)
- 41,573
Population outlook (Ocean County) Hauer SSP2
- Today (2025)
- 586,991 people
- By 2030
- 581,403 · -1.0%
- By 2040
- 564,913 · -3.8%
- By 2050
- 538,149 · -8.3%
- By 2075
- 468,845 · -20.1%
- By 2100
- 350,297 · -40.3%
Race, ethnicity, and origin ACS 2023
- Neighborhood character
- Predominantly White (78%)
- Race & ethnicity
- White 78% Hispanic / Latino 11% Two or more races 7% Black 5% Asian 2%
- Hispanic origin (detail)
- Mexican 2% Puerto Rican 5%
- Common ancestry
- Romanian 8% Lithuanian 2% Slovak 1%
- Foreign-born
- 7% · Canada, Jamaica, China
- Languages at home
- 90% English-only · Spanish 5% Other Indo-European 1% Chinese 1%
Political lean MEDSL · Ocean
- 2024 margin
- Solid R (+36.0) · D 31.4% · R 67.4% · Other 1.2%
- 2008→2024 swing
- -17.6pp toward R · 2008: -18.4pp · 2024: -36.0pp
- All cycles
- 2024: R+36.0 2020: R+28.7 2016: R+34.0 2012: R+17.7 2008: R+18.4
Not yet ingested
- Civics
- —
Market trends
- HPI YoY
- ▼ -524.30%
- Current HPI
- 380.6136
- Rent YoY
- —
- Metro
- —
- State GDP YoY
- ▲ 2.05%
- F500 in state
- 34
Industry mix (Fortune 500 HQ in NJ)
| Industry | F500 HQs | Revenue |
|---|---|---|
| Consumer Goods | 3 | $31B |
|
||
| Pharmaceuticals | 2 | $153B |
|
||
| Technology | 2 | $21B |
|
||
| Insurance | 2 | $20B |
|
||
| Healthcare | 2 | $19B |
|
||
| Financial Services | 1 | $70B |
|
||
Price history
+535.2% since first listed4 events — show timeline
- 2026-06-01 Pending — MOMLS
- 2026-05-16 Listed $249,000 MOMLS
- 2026-05-11 Coming Soon $249,000 MOMLS
- 1984-11-01 Sold (Public Records) $39,200 Public Records
Property tax history
+3.6%/yrLatest (2025): $3,900 · +5.2% YoY. Source: county tax records.
Cash-flow waterfall
monthlySold comps — $/sqft
last 12 mo · ≤1 miLoading sold comps…