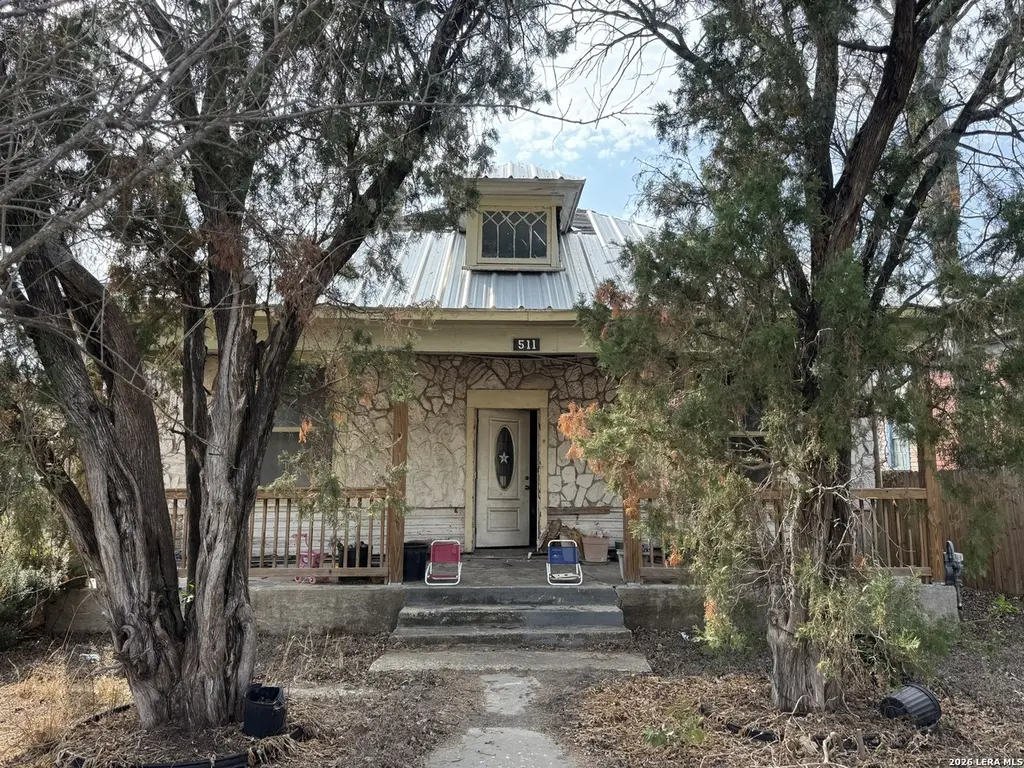
511 Olive · San Antonio, TX
Flood risk 1/10 · Minimal
- FEMA flood zone
- X (unshaded)
- Chance of flooding over 30 yrs
- 0.0%
- Est. flood insurance / yr
- $507 – $1,088
Fire risk 1/10 · Minimal
- Est. fire insurance / yr
- $1,222 – $2,270
Heat risk 8/10 · Major
- Hot days now (above 108°F)
- 7 days/yr
- Hot days in 30 yrs
- 22 days/yr
Wind risk 8/10 · Major
- Chance of severe wind over 30 yrs
- 80.0%
Air-quality risk 2/10 · Minimal
- Unhealthy air days now
- 1 days/yr
- Unhealthy air days in 30 yrs
- 2 days/yr
Risk factors via First Street. Map © Google.
Why this score? — see what drove the C grade
The composite is a weighted blend of 9 inputs, each scored 0–100. Each bar is that input's sub-score; the figure is the points it added to the 100-point composite (weight × sub-score).
- ARV discount +15.0/15.0
- Cash flow +12.4/30.0
- Appreciation +10.0/10.0
- 1% rule +5.2/10.0
- Rent growth +4.5/5.0
- Livability +4.0/5.0
- DSCR +3.7/10.0
- Condition / age +2.5/5.0
- Schools +1.4/10.0
$199,000
🖨 Deal sheet 📄 Offer letter ✓ Due diligence
Listing remarks
This 1/3 acre lot in the up and coming Dignowity Hills Historical District is just waiting for your imagination to run wild! The home is down to the studs and is designed to be a four bedroom, two and a half bath home. It will be a gorgeous home after it has been completed. Centrally located and close to downtown. There is plenty of room in the back yard for a nice patio, veranda or even a casita to rent out for additional income.
Key facts
- 0.3 acre lot
- Built 1915
- Listed 62 days
Property features AI
Finance
- Other:
- Financial info: Down payment resources available
- HOA & community: Located in Dignowity Hill Historic District
Exterior
- Parking:
- Security:
- Utilities: Water service; Garbage service; Sewer service; Electric service
- Home design: Pre-owned property; Approximate age: 111 years
- Construction: Metal roof
- Exterior features: Wood exterior with rock/stone veneer; Property located in Dignowity Hill Historic District
Interior
- Kitchen: Kitchen approx. 12 x 11
- Bedrooms: Master bedroom on lower level with walk-in closet and full bath; Bedroom 2 (11 x 11); Bedroom 3 (8 x 6); Bedroom 4 (10 x 11); Master bedroom approx. 12 x 12
- Flooring: Other (see remarks)
- Bathrooms: Total of 3 bathrooms: 2 full and 1 half; Master bath with tub/shower combination (approx. 10 x 4)
- Heating & cooling: Central heating (electric); Central air conditioning
- Interior features: One living area with a combined living/dining layout; Accessible/adaptive home with 2+ access exits and 42"-wide hallways
- Laundry & utility: Utility room approx. 5 x 5
Neighborhood map
What this means for you Summary
Snapshot
- This is a 3-bed/1.0-bath single-family listed at $199k.
Deal economics
- At list price, monthly cash flow is $-31 ($-374/yr) — negative.
- To cash-flow at today's rent, offer at most $193k (2.8% below list).
- Meets the 1% rule at list price ($2k rent vs $199k).
- Recommended offer: $187k (6.0% below list) — sets the bar for market timing.
- Cap rate 6.1% vs local median 3.8% in San Antonio — top-decile yield for the area; either an underpriced asset or a hidden risk that comps aren't pricing in. Stress-test before assuming the spread holds.
Location & tenants
- Location reads 80/100 on livability (#31 in TX, #1,616 nationally) — a professional / high-income tenant draw. Strengths: amenities A+, commute A+, cost of living A+; Watch: schools C-, crime F.
- San Antonio ISD (urban): math 12% / reading 22% proficiency, ranked #805 of 826 in TX (top 98%) — low school quality limits family demand, transient renter base, plan for 1-2y turnover; 80% free/reduced lunch — lower-income household profile, screen leases tightly.
- Market conditions: Rents rising fast (+8.2%/yr); 196 active listings in the ZIP; 40 comparable units currently listed for rent nearby; rentals at typical pace (median 24d on market — plan ~3-4 weeks tenant-placement turnaround); 8,308 units permitted in Bexar County in 2024 (2,506 in 5+ unit buildings).
- At $2,028/mo this rent would consume 51% of the median local household income ($47k/yr) (locally 543% of renters already pay >50% of income on rent) — very limited rent-growth headroom before tenants either downsize or default.
Forward outlook
- In year one you build about $21k of equity ($1k loan paydown + $20k appreciation (10.0% local appreciation)).
- Bexar County population projected at +50% by 2050 — long-run rental-demand tailwind backs the buy-and-hold thesis.
- At projected returns (10.0% appreciation + 8.0% rent growth), your $56k cash investment doubles in ~3 years — after that, you're playing with house money.
- By year 2, paydown + projected appreciation supports a ~$34k cash-out refi (75% LTV) — recoverable capital for the next deal without selling this one.
Negotiation context
- It's been on market 62 days — a 6% lower offer ($187k) is reasonable based on typical stale-listing flexibility.
- 2 sale attempts with the ask held roughly flat each time — persistent listings suggest the price (not the market) is what's stuck; bring a comps-based counter.
Risks & watch-outs
- Watch-outs: property tax is 3.1% of price; built in 1915 — expect roof / HVAC / electrical / plumbing capex.
- Climate carrying-cost: severe wind risk, 80% chance of damaging wind over 30y; extreme-heat days projected 7→22/yr by 2055 (HVAC capex compounding) — expect insurance premiums to compound above CPI over the hold.
Questions for the listing agent
- What do current leases actually rent for vs. the listed asking? Can we see a recent rent roll and the last 12 months of T-12 income?
- It's been on market 62 days. Have you received any prior offers? Is the seller open to a 6% concession, seller financing, or rate buy-down credit?
- Built in 1915 — when were the roof, HVAC, electrical panel, plumbing, and water heater last replaced?
- Property tax is high relative to price — has the assessment been appealed recently, and will the sale trigger a re-assessment?
- Why hasn't it sold? Are there any deal-killer items the seller is aware of (foundation, flood, title, zoning, code violations)?
- Is there a deadline driving the sale (1031 exchange, divorce, estate, relocation)? That informs how much negotiation room exists.
- Crime grade is F in this area — have there been break-ins, vandalism, or insurance claims at this property in the last 3 years? What carrier currently insures it and at what premium?
- What's the average days-on-market for RENTAL listings here right now (not sales)? A rising rental-DOM trend means longer vacancies and softer asking-rent achievability than the comps imply.
- What's the recent tenant-quality profile in this submarket — average credit score on applications, eviction rate, late-payment / NSF rate, and stable-employment percentage? A property-management company in the area should have these aggregated.
- How much new for-sale + rental construction is in the pipeline within 1–3 miles? Heavy new supply typically softens prices + rents 12–24 months out; constrained supply supports both.
Investment metrics
- 1% rule
- 1.02% ✓
- Cap rate
- 6.11%
- Cash-on-cash
- -0.67%
- DSCR
- 0.97
- GRM
- 8.2
CMA / ARV
- ARV (on-the-fly)
- $360,787
- Comps found
- 12
Show comp detail 12 sales within ~0.75 mi
| Address | Dist | Beds/Ba | Sqft | Sold | Price | $/sf | Match |
|---|---|---|---|---|---|---|---|
| 938 Dawson St | 0.21mi | 3/2.5 | 1,778 (-2%) | 6mo | $370,000 | $208 | 76 |
| 423 N Mesquite St | 0.18mi | 3/2.5 | 1,925 (+6%) | 1mo | $399,990 | $208 | 75 |
| 922 N Pine | 0.39mi | 2/2.0 (-1) | 1,820 (+0%) | 4mo | $439,000 | $241 | 69 |
| 508 N Cherry St | 0.25mi | 4/2.0 (+1) | 1,896 (+5%) | 4mo | $309,990 | $163 | 68 |
| 533 Nolan | 0.23mi | 2/2.0 (-1) | 1,671 (-8%) | 6mo | $149,999 | $90 | 63 |
| 214 Rudolph | 0.72mi | 3/2.5 | 1,757 (-3%) | 6mo | $324,990 | $185 | 51 |
| 1502 Nolan St | 0.62mi | 3/2.0 | 1,625 (-10%) | 1mo | $345,000 | $212 | 49 |
| 8543 Willow Xing | 0.61mi | 4/2.5 (+1) | 1,692 (-7%) | 3mo | $205,999 | $122 | 47 |
| 8523 Willow Xing | 0.61mi | 4/2.5 (+1) | 1,692 (-7%) | 3mo | $195,999 | $116 | 47 |
| 1108 Center St | 0.57mi | 3/3.0 | 1,628 (-10%) | 3mo | $324,000 | $199 | 46 |
| 1323 Nolan | 0.54mi | 3/2.0 | 1,550 (-14%) | 2mo | $349,000 | $225 | 45 |
| 2235 E Houston | 0.75mi | 4/2.0 (+1) | 1,556 (-14%) | 3mo | $110,000 | $71 | 30 |
Match score weights: distance 35% · size 25% · config 20% · recency 20%. Top-matched comps best support the ARV.
Projected returns pro-forma
10.0% appreciation · 8.0% rent growth · sell at horizon
- IRR
- 25.9%
- Equity multiple
- 3.11×
- Total profit
- $117,302
- Equity at exit
- $179,275
- IRR
- 24.4%
- Equity multiple
- 7.71×
- Total profit
- $373,922
- Equity at exit
- $386,613
Cash invested: $55,720 (down + closing). Projections, not guarantees.
Landlord ↔ Tenant lean methodology
- Overall (STATE)
- 87 Strongly Landlord-Friendly
- State Texas
- 87 Strongly Landlord-Friendly · R+5
- County
- — inherits STATE
- City
- — inherits STATE
ZIP-level market 78202
- Home prices YoY
- 27.0%
- Rents YoY
- 8.2%
- Active inventory
- 196
- Price-to-rent
- 8.2×
Monthly cashflow live
- Estimated rent
- $2,028 high interval (Pro) →
- Mortgage (P&I)
- −$1,044
- Tax from tax record
- −$507 /mo · $6,081/yr
- Insurance
- −$83
- HOA
- −$0
- Vacancy / Maint / Mgmt
- −$426
- Net cashflow
- $-31
Break-even live
UW: 25.0% down · 7.5% · 30yr · 1.5% tax · 5.0% vac · 8.0% maint · 8.0% mgmt
Financing live
Cash to close
- Down payment
- $49,750
- Closing costs
- $5,970
- Reserves months
- —
- Total cash needed
- —
Loan-product check · same deal, 3 products live
Conventional
25% down · 7.5% · 30yr
- Down + closing
- —
- Monthly P&I
- —
- Monthly cashflow
- —
- DSCR
- —
- Eligible?
- —
Personal DTI + credit; lowest rate.
DSCR
20% down · 8.5% · 30yr
- Down + closing
- —
- Monthly P&I
- —
- Monthly cashflow
- —
- DSCR
- —
- Eligible?
- —
No personal income docs; deal must DSCR.
Hard money
10% down · 12.0% · 12mo
- Down + closing
- —
- Monthly P&I
- —
- Monthly cashflow
- —
- DSCR
- —
- Eligible?
- —
Short-term bridge; refi at stabilization.
Rent comps 40 comps
| Address | Beds | Baths | Sqft | Rent | $/sqft | DOM | Units | Dist |
|---|---|---|---|---|---|---|---|---|
| 423 N Mesquite St San Antonio, TX | 3.0 | 2.5 | 1925 | $1,750 | $0.91 | 12d | 1 | 0.18mi |
| 603 N Mesquite St San Antonio, TX | 3.0 | 2.5 | 1333 | $1,750 | $1.31 | 23d | 1 | 0.22mi |
| 515 Nolan St San Antonio, TX | 4.0 | 2.0 | 1928 | $3,500 | $1.82 | 43d | 1 | 0.25mi |
| 1010 Burnet St San Antonio, TX | 3.0 | 2.5 | 1886 | $1,995 | $1.06 | 4d | 1 | 0.30mi |
| 1018 N Olive St San Antonio, TX | 3.0 | 2.0 | 1600 | $1,495 | $0.93 | 43d | 1 | 0.39mi |
| 115 Saint Charles San Antonio, TX | 3.0 | 2.0 | 1680 | $2,050 | $1.22 | 10d | 1 | 0.45mi |
| 215 Center St #307 San Antonio, TX | 2.0 | 2.0 | 1424 | $2,350 | $1.65 | 19d | 1 | 0.45mi |
| 215 Center St #307 San Antonio, TX | 2.0 | 2.0 | 1424 | $2,350 | $1.65 | 23d | 1 | 0.45mi |
| 118 Canadian St San Antonio, TX | 3.0 | 2.0 | 1232 | $2,300 | $1.87 | 43d | 1 | 0.50mi |
| 821 Burleson San Antonio, TX | 2.0 | 2.5 | 1456 | $1,629 | $1.12 | 43d | 1 | 0.54mi |
| 630 Montana St Unit 301 San Antonio, TX | 2.0 | 2.0 | 1320 | $2,250 | $1.70 | 14d | 1 | 0.54mi |
| 811 Montana St Unit 1301 San Antonio, TX | 2.0 | 2.0 | 1240 | $1,800 | $1.45 | 43d | 1 | 0.54mi |
| 802 Montana St Unit 2 San Antonio, TX | 3.0 | 1.0 | 1440 | $1,500 | $1.04 | 10d | 1 | 0.56mi |
| 222 S Olive St San Antonio, TX | 3.0 | 3.5 | 2073 | $2,500 | $1.21 | 43d | 1 | 0.57mi |
| 222 S Olive St #1102 San Antonio, TX | 3.0 | 3.5 | 2073 | $2,500 | $1.21 | 43d | 1 | 0.57mi |
| 218 S Olive St #2101 San Antonio, TX | 3.0 | 3.5 | 1800 | $3,199 | $1.78 | 43d | 1 | 0.57mi |
| 631 Potomac San Antonio, TX | 3.0 | 2.5 | 1844 | $1,797 | $0.97 | 23d | 1 | 0.59mi |
| 1223 Hays St San Antonio, TX | 3.0 | 2.5 | 1810 | $2,495 | $1.38 | 23d | 1 | 0.62mi |
| 1102 Burleson San Antonio, TX | 3.0 | 2.0 | 1400 | $2,500 | $1.79 | 23d | 1 | 0.65mi |
| 1419 Wyoming St San Antonio, TX | 2.0 | 1.0 | 1232 | $1,550 | $1.26 | 4d | 1 | 0.66mi |
| 415 S Olive St San Antonio, TX | 3.0 | 2.0 | 1348 | $2,600 | $1.93 | 43d | 1 | 0.73mi |
| 1412 Hays St San Antonio, TX | 3.0 | 1.0 | 1250 | $1,495 | $1.20 | 23d | 1 | 0.75mi |
| 610 E Market St #2915 San Antonio, TX | 2.0 | 2.0 | 1497 | $3,800 | $2.54 | 21d | 1 | 0.78mi |
| 603 S Mesquite St San Antonio, TX | 3.0 | 2.5 | 1333 | $1,750 | $1.31 | 21d | 1 | 0.82mi |
| 850 Nevada St Unit NA San Antonio, TX | 2.0 | 1.0 | 1345 | $1,795 | $1.33 | 12d | 1 | 0.83mi |
| 1723 E Crockett St San Antonio, TX | 3.0 | 3.0 | 1819 | $1,800 | $0.99 | 23d | 1 | 0.85mi |
| 1111 Gibbs San Antonio, TX | 3.0 | 2.0 | 1476 | $1,595 | $1.08 | 23d | 1 | 0.86mi |
| 1727 E Crockett St San Antonio, TX | 3.0 | 3.0 | 1819 | $1,725 | $0.95 | 19d | 1 | 0.86mi |
| 2332 E Houston St San Antonio, TX | 3.0 | 2.0 | 1652 | $1,550 | $0.94 | 23d | 1 | 0.86mi |
| 1707 Dawson St Unit 1101 San Antonio, TX | 2.0 | 1.5 | 1884 | $1,000 | $0.53 | 43d | 1 | 0.86mi |
| 452 Gulf San Antonio, TX | 3.0 | 1.0 | 1244 | $1,899 | $1.53 | 21d | 1 | 0.91mi |
| 418 Lockhart St Unit 1 San Antonio, TX | 4.0 | 2.0 | 1479 | $1,590 | $1.08 | 43d | 1 | 0.91mi |
| 418 Lockhart San Antonio, TX | 4.0 | 2.0 | 1479 | $1,799 | $1.22 | 21d | 1 | 0.91mi |
| 1606 N Hackberry St #102 San Antonio, TX | 2.0 | 2.5 | 1474 | $2,500 | $1.70 | 10d | 1 | 0.91mi |
| 1414 Burleson San Antonio, TX | 4.0 | 2.0 | 1769 | $2,000 | $1.13 | 43d | 1 | 0.92mi |
| 1607 N Pine St San Antonio, TX | 4.0 | 3.0 | 2034 | $2,995 | $1.47 | 43d | 1 | 0.92mi |
| 207 Gravel St Unit 102 San Antonio, TX | 3.0 | 2.5 | 1394 | $1,800 | $1.29 | 23d | 1 | 0.92mi |
| 114 Gravel St San Antonio, TX | 4.0 | 3.5 | 1936 | $2,095 | $1.08 | 4d | 1 | 0.92mi |
| 326 Cactus St San Antonio, TX | 3.0 | 2.5 | 2059 | $2,500 | $1.21 | 23d | 1 | 0.94mi |
| 1104 N Gevers St San Antonio, TX | 3.0 | 2.5 | 1276 | $1,725 | $1.35 | 43d | 1 | 0.97mi |
Listing history 8 events
-
2026-06-02statusdays on market $199,000 Pending 62 DOM
-
2026-06-01days on market $199,000 Active Option 61 DOM
-
2026-05-31days on market $199,000 Active Option 60 DOM
-
2026-04-30historical Active Option
-
2026-04-13status Back on Market
-
2026-04-04historical Active Option
-
2026-04-01$199,000 New
-
2020-11-17soldstatus
ⓘ Source: listings_history table (triggers on properties + properties_extension) + one-shot
backfill from property_details.listing_events for pre-trigger history.
Tax reassessment forecast TX · Resets to sale price
- Current annual tax
- $6,081 · $507/mo
- Projected year-2 tax
- $6,081 · $507/mo
- Expected delta
- $0/yr ($0/mo · 0.0%)
ⓘ Screening estimate from a state-policy table — verify with the county assessor before closing.
Climate risk First Street
- Flood 1/10 Low FEMA zone X (unshaded) · 0% chance over 30 yrs
- Wildfire 1/10 Low
- Heat 8/10 Severe 7 d/yr ≥108°F today · 22 d/yr by 30 yrs out
- Wind 8/10 Severe 80% chance of damaging wind over 30 yrs
- Air quality 2/10 Low 1 unhealthy d/yr today · 2 by 30 yrs out
Nearby sold comps map
Loading sold comps map…
Walkable amenities ~0.75 mi
Loading nearby amenities…
Taxation est. · year 1
- Rental income
- $24,335
- − Mortgage interest
- −$11,147
- − Property taxes
- −$6,081
- − Insurance
- −$995
- − Repairs & maintenance
- −$1,947
- − Management
- −$1,947
- − Depreciation
- −$5,789
- Taxable loss
- −$3,570
- Est. tax savings @ 24.0%
- +$857
- After-tax cash flow
- $483/yr
For passive investors: Depreciation is non-cash, so a rental often shows a tax loss while cash-flowing — sheltering income. Rental losses are passive: they offset passive income freely, and up to $25,000/yr can offset ordinary (W-2) income if you actively participate and your MAGI is under $100k (phasing out to $0 by $150k); unused losses carry forward. On sale, claimed depreciation is recaptured at up to 25%, and gains may owe capital-gains tax (a 1031 exchange can defer both). Figures are a year-1 estimate at your 24.0% rate — not tax advice; consult a CPA.
Schools (NCES district)
- District
- San Antonio ISD
- NCES district ID
- 4838730
- Math proficiency
- 12% ▼ -21.00%
- Reading proficiency
- 22% ▼ -7.00%
- Median HH income
- $30,952
- Composite
- 13.57/100
- National rank
- #9512
- State rank
- #805 of 826 in TX
Livability — San Antonio
- Score
- 80/100
- State rank
- #31
- US rank
- #1616
Category grades
Schools grade is shown separately in the Schools card above.
Census & demographics
- Census place
- San Antonio, TX
- County
- Bexar County · 1,990,555 people
- City population
- 1,806,925
- Metro
- San Antonio-New Braunfels, TX
- Population (ZIP)
- 10,224
- Household income
- $47,478
- Rent vs Own
- Severe rent burden
- 543.0
Population outlook (Bexar County) Hauer SSP2
- Today (2025)
- 2,336,851 people
- By 2030
- 2,560,728 · +9.6%
- By 2040
- 3,020,569 · +29.3%
- By 2050
- 3,493,522 · +49.5%
- By 2075
- 4,668,459 · +99.8%
- By 2100
- 5,533,242 · +136.8%
Race, ethnicity, and origin ACS 2023
- Neighborhood character
- Predominantly Hispanic (66%)
- Race & ethnicity
- Hispanic / Latino 66% Two or more races 28% White 17% Black 16% Native American 1%
- Hispanic origin (detail)
- Mexican 57% Puerto Rican 1% Cuban 1%
- Common ancestry
- Italian 2% Slovak 1%
- Foreign-born
- 14% · Canada
- Languages at home
- 59% English-only · Spanish 41%
Political lean MEDSL · Bexar
- 2024 margin
- Lean D (+9.8) · D 54.3% · R 44.6% · Other 1.1%
- 2008→2024 swing
- +4.2pp toward D · 2008: 5.6pp · 2024: 9.8pp
- All cycles
- 2024: D+9.8 2020: D+18.2 2016: D+13.5 2012: D+4.6 2008: D+5.6
Not yet ingested
- Civics
- —
Market trends
- HPI YoY
- ▲ 53.82%
- Current HPI
- 253.3196
- Rent YoY
- ▲ 8.20%
- Metro
- San Antonio-New Braunfels, TX
- State GDP YoY
- ▲ 3.95%
- F500 in state
- 110
Industry mix (Fortune 500 HQ in TX)
| Industry | F500 HQs | Revenue |
|---|---|---|
| Energy | 16 | $1,198B |
|
||
| Technology | 5 | $198B |
|
||
| Engineering / Construction | 4 | $72B |
|
||
| Energy Services | 3 | $60B |
|
||
| Utilities | 3 | $41B |
|
||
| Healthcare | 2 | $330B |
|
||
Price history
5 events — show timeline
- 2026-04-30 Contingent — LERA
- 2026-04-13 Relisted — LERA
- 2026-04-04 Contingent — LERA
- 2026-04-01 Listed $199,000 LERA
- 2020-11-17 Sold (Public Records) — Public Records
Property tax history
+14.1%/yrLatest (2025): $6,081 · +10.0% YoY. Source: county tax records.
Cash-flow waterfall
monthlySold comps — $/sqft
last 12 mo · ≤1 miLoading sold comps…