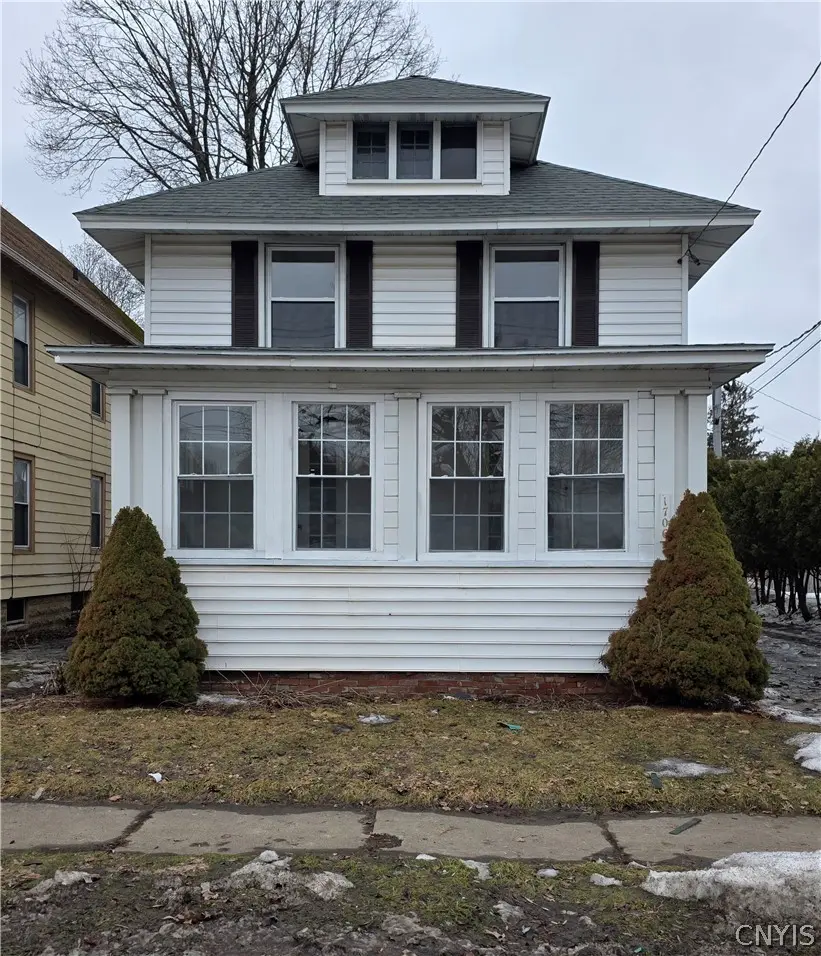
1706 Oneida St · Utica, NY
Flood risk 1/10 · Minimal
- FEMA flood zone
- X (unshaded)
- Chance of flooding over 30 yrs
- 0.0%
- Est. flood insurance / yr
- $473 – $860
Fire risk 3/10 · Minor
- Est. fire insurance / yr
- $691 – $1,283
Heat risk 3/10 · Minor
- Hot days now (above 95°F)
- 7 days/yr
- Hot days in 30 yrs
- 16 days/yr
Wind risk 1/10 · Minimal
- Chance of severe wind over 30 yrs
- 1.0%
Air-quality risk 2/10 · Minimal
- Unhealthy air days now
- 0 days/yr
- Unhealthy air days in 30 yrs
- 2 days/yr
Risk factors via First Street. Map © Google.
Why this score? — see what drove the C grade
The composite is a weighted blend of 9 inputs, each scored 0–100. Each bar is that input's sub-score; the figure is the points it added to the 100-point composite (weight × sub-score).
- Cash flow +22.8/30.0
- Appreciation +10.0/10.0
- DSCR +7.3/10.0
- 1% rule +4.9/10.0
- Livability +4.0/5.0
- Schools +2.9/10.0
- Rent growth +2.5/5.0
- Condition / age +2.5/5.0
- ARV discount +0.0/15.0
$255,000
🖨 Deal sheet 📄 Offer letter ✓ Due diligence
Listing remarks MLS
South Utica home located just across from Val Bialas Ski Center. Recently remodeled with updates completed in the last few months, including a new roof on the house and garage, new hardwood flooring, updated kitchen with granite countertops and stainless steel appliances, new bathrooms, some new walls, windows and doors, and fresh interior paint.
Key facts
- Hardwood flooring
- Updated kitchen
- Granite countertops
Tags
Neighborhood map
What this means for you Summary
Snapshot
- This is a 4-bed/1.0-bath single-family listed at $255k.
Deal economics
- At list price, monthly cash flow is $443 ($5k/yr) — positive.
- The deal already cash-flows at list — no discount required.
- To meet the 1% rule (rent ≥ 1% of price), the offer needs to be $253k (0.6% below list).
- Recommended offer: $251k (1.5% below list) — sets the bar for market timing.
Location & tenants
- Location reads 80/100 on livability (#104 in NY, #1,589 nationally) — a professional / high-income tenant draw. Strengths: commute A+, cost of living A+, housing A+; Watch: employment D, schools D-, crime F.
- Utica City School District (urban): math 33% / reading 38% proficiency, ranked #562 of 590 in NY (top 95%) — families likely to look elsewhere, expect single-tenant / working-renter base with shorter leases; 71% free/reduced lunch — lower-income household profile, screen leases tightly.
- Market conditions: 143 active listings in the ZIP; 4 comparable units currently listed for rent nearby; rentals lingering (median 44d on market — plan ~5-8 weeks vacancy on turnover, expect pricing pressure); 100% of comp listings sitting > 30 days — soft ceiling on asking rent; 204 units permitted in Oneida County in 2024 (68 in 5+ unit buildings).
- At $2,535/mo this rent would consume 58% of the median local household income ($53k/yr) (locally 2251% of renters already pay >50% of income on rent) — very limited rent-growth headroom before tenants either downsize or default.
Forward outlook
- In year one you build about $27k of equity ($2k loan paydown + $26k appreciation (10.0% local appreciation)).
- Oneida County population projected at -12% by 2050 — secular population decline; favor cash flow + early exit over multi-decade hold.
- At projected returns (10.0% appreciation + 3.0% rent growth), your $71k cash investment doubles in ~3 years — after that, you're playing with house money.
- By year 2, paydown + projected appreciation supports a ~$44k cash-out refi (75% LTV) — recoverable capital for the next deal without selling this one.
Negotiation context
- It's been on market 18 days — a 2% lower offer ($251k) is reasonable based on typical stale-listing flexibility.
- 5 sale attempts since 16y ago; this cycle's ask has dropped $20k (7%) from the opening price — seller is motivated, your offer sets the floor, not the list.
- Current owner paid $118k; list at $255k implies a 116% gain — meaningful room to come down on a strong offer.
Risks & watch-outs
- Watch-outs: built in 1930 — expect roof / HVAC / electrical / plumbing capex.
Questions for the listing agent
- Built in 1930 — when were the roof, HVAC, electrical panel, plumbing, and water heater last replaced?
- Is there a deadline driving the sale (1031 exchange, divorce, estate, relocation)? That informs how much negotiation room exists.
- Schools are D-rated, which usually means shorter tenancies and higher turnover. Who's the typical renter profile here, and what's been the actual vacancy rate?
- Crime grade is F in this area — have there been break-ins, vandalism, or insurance claims at this property in the last 3 years? What carrier currently insures it and at what premium?
- What's the average days-on-market for RENTAL listings here right now (not sales)? A rising rental-DOM trend means longer vacancies and softer asking-rent achievability than the comps imply.
- What's the recent tenant-quality profile in this submarket — average credit score on applications, eviction rate, late-payment / NSF rate, and stable-employment percentage? A property-management company in the area should have these aggregated.
- How much new for-sale + rental construction is in the pipeline within 1–3 miles? Heavy new supply typically softens prices + rents 12–24 months out; constrained supply supports both.
Investment metrics
- 1% rule
- 0.99% ✗
- Cap rate
- 8.38%
- Cash-on-cash
- 7.44%
- DSCR
- 1.33
- GRM
- 8.4
CMA / ARV
- ARV (median comp)
- $207,258
- List price
- $255,000
- Delta
- 23.04%
- Verdict
- OVERPRICED
- Comps
- 20 within 1.0 mi
Show comp detail 12 sales within ~0.75 mi
| Address | Dist | Beds/Ba | Sqft | Sold | Price | $/sf | Match |
|---|---|---|---|---|---|---|---|
| 1803 Baker Ave | 0.13mi | 3/2.0 (-1) | 1,638 (-0%) | 1mo | $223,000 | $136 | 84 |
| 12 Rose Pl | 0.48mi | 3/1.5 (-1) | 1,616 (-2%) | 5mo | $185,600 | $115 | 63 |
| 804 Symonds Pl | 0.63mi | 4/1.5 | 1,661 (+1%) | 4mo | $180,000 | $108 | 63 |
| 18 Avery Pl | 0.46mi | 4/2.0 | 1,694 (+3%) | 9mo | $200,000 | $118 | 61 |
| 1913 Bradford Ave | 0.34mi | 4/1.0 | 1,440 (-12%) | 6mo | $206,700 | $144 | 58 |
| 28 Prospect St | 0.60mi | 4/1.5 | 1,703 (+4%) | 9mo | $163,500 | $96 | 56 |
| 1915 Bradford Ave | 0.34mi | 4/1.0 | 1,440 (-12%) | 11mo | $190,000 | $132 | 54 |
| 225 Pleasant St | 0.51mi | 3/2.0 (-1) | 1,600 (-3%) | 11mo | $187,620 | $117 | 54 |
| 56 Ballantyne Brae | 0.65mi | 3/1.5 (-1) | 1,736 (+6%) | 8mo | $234,500 | $135 | 47 |
| 2026 Howe St | 0.51mi | 3/1.0 (-1) | 1,458 (-11%) | 9mo | $159,000 | $109 | 45 |
| 803 Mildred Ave | 0.62mi | 4/2.0 | 1,423 (-13%) | 2mo | $115,000 | $81 | 44 |
| 34 Auburn Ave | 0.43mi | 3/2.0 (-1) | 1,416 (-14%) | 10mo | $210,940 | $149 | 40 |
Match score weights: distance 35% · size 25% · config 20% · recency 20%. Top-matched comps best support the ARV.
Projected returns pro-forma
10.0% appreciation · 3.0% rent growth · sell at horizon
- IRR
- 29.7%
- Equity multiple
- 3.34×
- Total profit
- $166,979
- Equity at exit
- $229,724
- IRR
- 25.7%
- Equity multiple
- 7.57×
- Total profit
- $469,389
- Equity at exit
- $495,409
Cash invested: $71,400 (down + closing). Projections, not guarantees.
Landlord ↔ Tenant lean methodology
- Overall (STATE)
- 15 Strongly Tenant-Friendly
- State New York
- 15 Strongly Tenant-Friendly · D+10
- County
- — inherits STATE
- City
- — inherits STATE
ZIP-level market 13501
- Home prices YoY
- 5.6%
- Active inventory
- 143
- Price-to-rent
- 8.4×
Monthly cashflow live
- Estimated rent
- $2,535 medium interval (Pro) →
- Mortgage (P&I)
- −$1,337
- Tax from tax record
- −$116 /mo · $1,398/yr
- Insurance
- −$106
- HOA
- −$0
- Vacancy / Maint / Mgmt
- −$532
- Net cashflow
- $443
Break-even live
UW: 25.0% down · 7.5% · 30yr · 1.5% tax · 5.0% vac · 8.0% maint · 8.0% mgmt
Financing live
Cash to close
- Down payment
- $63,750
- Closing costs
- $7,650
- Reserves months
- —
- Total cash needed
- —
Loan-product check · same deal, 3 products live
Conventional
25% down · 7.5% · 30yr
- Down + closing
- —
- Monthly P&I
- —
- Monthly cashflow
- —
- DSCR
- —
- Eligible?
- —
Personal DTI + credit; lowest rate.
DSCR
20% down · 8.5% · 30yr
- Down + closing
- —
- Monthly P&I
- —
- Monthly cashflow
- —
- DSCR
- —
- Eligible?
- —
No personal income docs; deal must DSCR.
Hard money
10% down · 12.0% · 12mo
- Down + closing
- —
- Monthly P&I
- —
- Monthly cashflow
- —
- DSCR
- —
- Eligible?
- —
Short-term bridge; refi at stabilization.
Rent comps 4 comps
| Address | Beds | Baths | Sqft | Rent | $/sqft | DOM | Units | Dist |
|---|---|---|---|---|---|---|---|---|
| 1804 Storrs Ave Utica, NY | 3.0 | 1.5 | 1633 | $3,000 | $1.84 | 43d | 1 | 0.12mi |
| 1503 Fox Pl Utica, NY | 3.0 | 1.0 | 1119 | $2,000 | $1.79 | 43d | 1 | 1.06mi |
| 1124 Dudley Ave Unit 1 Utica, NY | 3.0 | 1.0 | 1300 | $1,400 | $1.08 | 43d | 1 | 1.20mi |
| 1224 Whitesboro St Unit 1 Utica, NY | 3.0 | 1.0 | 1100 | $1,125 | $1.02 | 43d | 1 | 1.46mi |
Listing history 26 events
-
2026-06-19days on market $255,000 Active 18 DOM
-
2026-06-18days on market $255,000 Active 17 DOM
-
2026-06-17days on market $255,000 Active 16 DOM
-
2026-06-16days on market $255,000 Active 15 DOM
-
2026-06-15days on market $255,000 Active 14 DOM
-
2026-06-14days on market $255,000 Active 12 DOM
-
2026-06-13days on market $255,000 Active 11 DOM
-
2026-06-10days on market $255,000 Active 9 DOM
-
2026-06-09days on market $255,000 Active 8 DOM
-
2026-06-08days on market $255,000 Active 7 DOM
-
2026-06-07days on market $255,000 Active 6 DOM
-
2026-06-03days on market $255,000 Active 2 DOM
-
2026-06-02days on market $255,000 Active 1 DOM
-
2026-04-24price $255,000 348-char remark
Show marketing remark (348 chars)
South Utica home located just across from Val Bialas Ski Center. Recently remodeled with updates completed in the last few months, including a new roof on the house and garage, new hardwood flooring, updated kitchen with granite countertops and stainless steel appliances, new bathrooms, some new walls, windows and doors, and fresh interior paint.
-
2026-03-08$275,000 Active 348-char remark
Show marketing remark (348 chars)
South Utica home located just across from Val Bialas Ski Center. Recently remodeled with updates completed in the last few months, including a new roof on the house and garage, new hardwood flooring, updated kitchen with granite countertops and stainless steel appliances, new bathrooms, some new walls, windows and doors, and fresh interior paint.
-
2025-12-10soldstatus $118,000 Closed
-
2025-10-02status Pending
-
2025-10-02$120,000 Active
-
2019-09-03soldstatus $42,500
-
2019-07-17historical
-
2019-07-15$25,500
-
2019-07-12$25,500
-
2011-02-01soldstatus $63,000
-
2011-01-31soldstatus $67,000
-
2010-09-08$69,900
-
2010-05-26soldstatus $45,000
ⓘ Source: listings_history table (triggers on properties + properties_extension) + one-shot
backfill from property_details.listing_events for pre-trigger history.
Tax reassessment forecast NY · Partial reset (capped growth)
- Current annual tax
- $1,398 · $116/mo
- Projected year-2 tax
- $2,854 · $238/mo
- Expected delta
- +$1,456/yr (+$121/mo · 104.1%)
ⓘ Screening estimate from a state-policy table — verify with the county assessor before closing.
Climate risk First Street
- Flood 1/10 Low FEMA zone X (unshaded) · 0% chance over 30 yrs
- Wildfire 3/10 Moderate
- Heat 3/10 Moderate 7 d/yr ≥95°F today · 16 d/yr by 30 yrs out
- Wind 1/10 Low 100% chance of damaging wind over 30 yrs
- Air quality 2/10 Low 0 unhealthy d/yr today · 2 by 30 yrs out
Nearby sold comps map
Loading sold comps map…
Walkable amenities ~0.75 mi
Loading nearby amenities…
Taxation est. · year 1
- Rental income
- $30,418
- − Mortgage interest
- −$14,284
- − Property taxes
- −$1,398
- − Insurance
- −$1,275
- − Repairs & maintenance
- −$2,433
- − Management
- −$2,433
- − Depreciation
- −$7,418
- Taxable income
- $1,176
- Est. tax owed @ 24.0%
- −$282
- After-tax cash flow
- $5,028/yr
For passive investors: Depreciation is non-cash, so a rental often shows a tax loss while cash-flowing — sheltering income. Rental losses are passive: they offset passive income freely, and up to $25,000/yr can offset ordinary (W-2) income if you actively participate and your MAGI is under $100k (phasing out to $0 by $150k); unused losses carry forward. On sale, claimed depreciation is recaptured at up to 25%, and gains may owe capital-gains tax (a 1031 exchange can defer both). Figures are a year-1 estimate at your 24.0% rate — not tax advice; consult a CPA.
Schools (NCES district)
- District
- Utica City School District
- NCES district ID
- 3629370
- Math proficiency
- 33% ▼ -7.00%
- Reading proficiency
- 38% ▲ 2.00%
- Median HH income
- $31,834
- Composite
- 29.01/100
- National rank
- #6613
- State rank
- #562 of 590 in NY
Livability — Utica
- Score
- 80/100
- State rank
- #104
- US rank
- #1589
Category grades
Schools grade is shown separately in the Schools card above.
Census & demographics
- Census place
- Utica, NY
- County
- Oneida County · 89,710 people
- City population
- 72,968
- Metro
- Utica-Rome, NY
- Population (ZIP)
- 38,931
- Household income
- $52,548
- Rent vs Own
- Severe rent burden
- 2251.0
Population outlook (Oneida County) Hauer SSP2
- Today (2025)
- 225,223 people
- By 2030
- 220,384 · -2.1%
- By 2040
- 209,071 · -7.2%
- By 2050
- 197,920 · -12.1%
- By 2075
- 175,541 · -22.1%
- By 2100
- 148,491 · -34.1%
Race, ethnicity, and origin ACS 2023
- Neighborhood character
- Highly diverse neighborhood (Simpson 0.70)
- Race & ethnicity
- White 49% Two or more races 15% Hispanic / Latino 14% Black 14% Asian 14%
- Hispanic origin (detail)
- Puerto Rican 8% Dominican 4%
- Common ancestry
- American 8% Romanian 3% Lithuanian 1%
- Foreign-born
- 25% · Canada, Philippines, Vietnam
- Languages at home
- 62% English-only · Other Asian/Pacific 11% Russian/Polish/Slavic 10% Spanish 9%
Political lean MEDSL · Oneida
- 2024 margin
- Strong R (+21.3) · D 39.4% · R 60.6%
- 2008→2024 swing
- -15.2pp toward R · 2008: -6.1pp · 2024: -21.3pp
- All cycles
- 2024: R+21.3 2020: R+15.5 2016: R+21.1 2012: R+5.3 2008: R+6.1
Not yet ingested
- Civics
- —
Market trends
- HPI YoY
- ▲ 20.28%
- Current HPI
- 382.3726
- Rent YoY
- —
- Metro
- Utica-Rome, NY
- State GDP YoY
- ▲ 2.60%
- F500 in state
- 92
Industry mix (Fortune 500 HQ in NY)
| Industry | F500 HQs | Revenue |
|---|---|---|
| Financial Services | 10 | $950B |
|
||
| Consumer Goods | 9 | $162B |
|
||
| Insurance | 4 | $225B |
|
||
| Telecommunications | 2 | $144B |
|
||
| Pharmaceuticals | 2 | $112B |
|
||
| Media / Entertainment | 2 | $69B |
|
||
Price history
+466.7% since first listed13 events — show timeline
- 2026-04-24 Price Changed $255,000 CNYIS
- 2026-03-08 Listed $275,000 CNYIS
- 2025-12-10 Sold (MLS) $118,000 CNYIS
- 2025-10-02 Pending — CNYIS
- 2025-10-02 Listed $120,000 CNYIS
- 2019-09-03 Sold (MLS) $42,500 CNYIS
- 2019-07-17 Listing Removed — CNYIS
- 2019-07-15 Listed $25,500 CNYIS
- 2019-07-12 Listed $25,500 CNYIS
- 2011-02-01 Sold (Public Records) $63,000 Public Records
- 2011-01-31 Sold (MLS) $67,000 CNYIS
- 2010-09-08 Listed $69,900 CNYIS
- 2010-05-26 Sold (Public Records) $45,000 Public Records
Property tax history
-0.3%/yrLatest (2025): $1,398 · -33.5% YoY. Source: county tax records.
Cash-flow waterfall
monthlySold comps — $/sqft
last 12 mo · ≤1 miLoading sold comps…