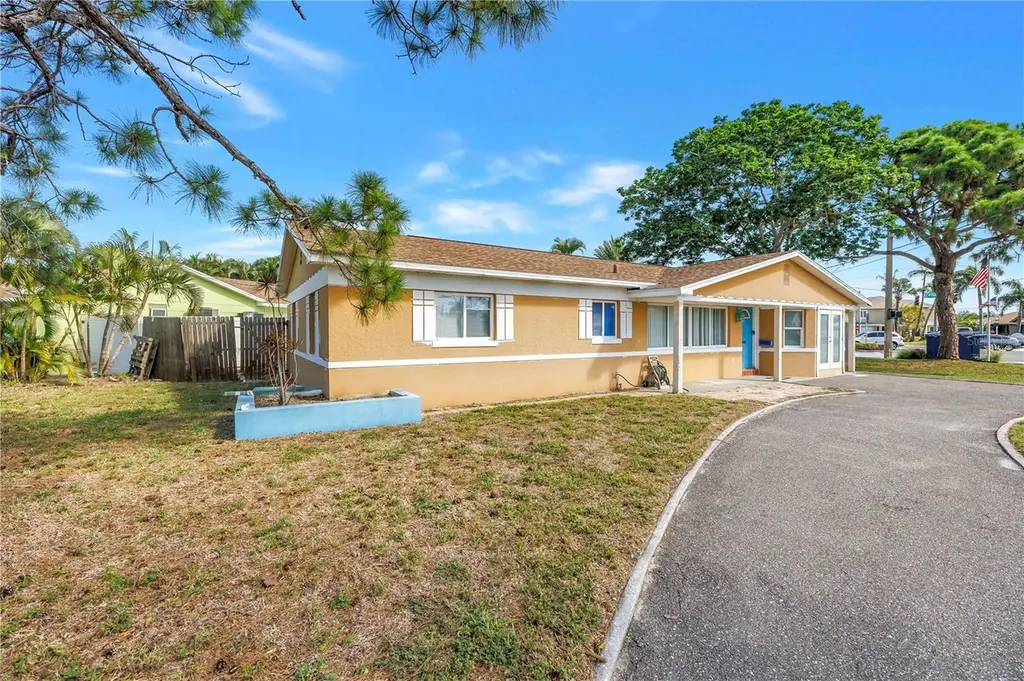
7901 Causeway Blvd S · St. Petersburg, FL
Flood risk 9/10 · Severe
- FEMA flood zone
- AE
- Chance of flooding over 30 yrs
- 0.99%
- Est. flood insurance / yr
- $1,737 – $8,500
Fire risk 1/10 · Minimal
- Est. fire insurance / yr
- $947 – $1,759
Heat risk 10/10 · Severe
- Hot days now (above 106°F)
- 7 days/yr
- Hot days in 30 yrs
- 25 days/yr
Wind risk 10/10 · Severe
- Chance of severe wind over 30 yrs
- 99.0%
Air-quality risk 4/10 · Minor
- Unhealthy air days now
- 4 days/yr
- Unhealthy air days in 30 yrs
- 4 days/yr
Risk factors via First Street. Map © Google.
Why this score? — see what drove the C+ grade
The composite is a weighted blend of 9 inputs, each scored 0–100. Each bar is that input's sub-score; the figure is the points it added to the 100-point composite (weight × sub-score).
- Cash flow +21.8/30.0
- ARV discount +15.0/15.0
- DSCR +7.0/10.0
- 1% rule +4.6/10.0
- Schools +4.3/10.0
- Livability +2.5/5.0
- Condition / age +2.5/5.0
- Rent growth +2.3/5.0
- Appreciation +0.0/10.0
$358,250
🖨 Deal sheet (PDF) 📄 Offer letter ✓ Due diligence
Listing remarks
Incredible opportunity to renovate or rebuild your dream home just one mile from the sugar sands of Treasure Island Beach! Situated on a corner lot in the highly sought-after Causeway Isles neighborhood, this flood-damaged property offers incredible potential for investors, builders, or buyers looking to create their own coastal retreat. The home was remediated immediately following the 2024 storms and features a 2022 roof, new 200 amp electric panel, along with hard-wired electrical, and building permits already in place. Whether you're planning a renovation or envisioning a custom rebuild, these improvements provide a strong head start on bringing your vision to life. Enjoy the best of Fl
Key facts
- Building permits
- Corner lot
- 2022 roof
Tags
Property features AI
Finance
- Other: Total lot approximately 0.18 acres (80 x 100); Private in-ground pool
- Financial info: Lease restrictions apply
- HOA & community: No association; Pets allowed; Association approval not required
Exterior
- Utilities: Public water; Public sewer; Cable available; Electricity available and connected; Phone available
- Home design: Single family residence; One story; South facing; Homestead property
- Construction: Block construction; Shingle roof; Slab foundation; Built area approximately 1,775 square feet
- Exterior features: Other exterior features; Corner lot; Paved public road access; Wood fencing
Interior
- Kitchen: Electric water heater
- Bedrooms: 3 bedrooms
- Flooring: Other flooring
- Bathrooms: 2 full bathrooms
- Heating & cooling: Central heating; Central air conditioning
- Interior features: Other interior features; Family room
- Laundry & utility: Laundry inside
Neighborhood map
What this means for you Summary
Snapshot
- This is a 3-bed/2.0-bath single-family listed at $358k.
Deal economics
- At list price, monthly cash flow is $130 ($2k/yr) — positive.
- The deal already cash-flows at list — no discount required.
- To meet the 1% rule (rent ≥ 1% of price), the offer needs to be $344k (3.9% below list).
- Recommended offer: $344k (3.9% below list) — sets the bar for 1% rule.
- Cap rate 8.2% vs local median 2.6% in St. Petersburg — top-decile yield for the area; either an underpriced asset or a hidden risk that comps aren't pricing in. Stress-test before assuming the spread holds.
Location & tenants
- Location reads: area grade C — affects rentability + tenant quality, not the cash-flow math above.
- Pinellas (suburban): math 51% / reading 51% proficiency, ranked #31 of 73 in FL (top 42%) — acceptable for families but not a draw, mixed tenant base, ~2y average lease.
- Zoned schools: Azalea Elementary School (math 57% / reading 52%, grade C, #892 of 2,144 statewide, top 44%, 507 students, 60% FRL); Azalea Middle School (math 26% / reading 27%, grade F, #503 of 571 statewide, top 88%, 678 students, 74% FRL); Boca Ciega High School (math 24% / reading 33%, grade F, #458 of 667 statewide, top 69%, 1,423 students, 64% FRL) — zoned schools average 66% FRL vs 48% district-wide (18 pts higher); higher-poverty schools than district average — tighter screening recommended.
- Zoned-school proficiency averages 36% at this address vs 51% district-wide (-14 pts) — the specific schools serving this property underperform the Pinellas average; the district grade overstates school quality for this exact location.
- Market conditions: Rents soft (-0.6%/yr); 462 active listings in the ZIP; 40 comparable units currently listed for rent nearby; rentals at typical pace (median 27d on market — plan ~3-4 weeks tenant-placement turnaround); 2,676 units permitted in Pinellas County in 2024 (1,422 in 5+ unit buildings).
- At $3,442/mo this rent would consume 59% of the median local household income ($70k/yr) (locally 1371% of renters already pay >50% of income on rent) — very limited rent-growth headroom before tenants either downsize or default.
Forward outlook
- Local home prices are declining (-3.0%/yr); year-one equity from $2k of loan paydown is wiped out by about $11k of value loss. Plan a longer hold.
- Pinellas County population projected at +14% by 2050 — modest demand growth; plan on rents tracking national, not racing it.
Negotiation context
- Only 12 days on market — expect competitive offers; lowballing is unlikely to land.
- Current owner paid $78k; list at $358k implies a 359% gain — meaningful room to come down on a strong offer.
Risks & watch-outs
- Watch-outs: flood insurance adds $427/mo; built in 1956 — expect roof / HVAC / electrical / plumbing capex.
- Climate carrying-cost: in FEMA flood zone AE (mandatory federal flood insurance); severe wind risk, 99% chance of damaging wind over 30y; extreme-heat days projected 7→25/yr by 2055 (HVAC capex compounding) — expect insurance premiums to compound above CPI over the hold.
Questions for the listing agent
- Built in 1956 — when were the roof, HVAC, electrical panel, plumbing, and water heater last replaced?
- What's the actual annual flood-insurance premium (NFIP or private), and is the property in a SFHA with mandatory coverage?
- Is there a deadline driving the sale (1031 exchange, divorce, estate, relocation)? That informs how much negotiation room exists.
- What's the average days-on-market for RENTAL listings here right now (not sales)? A rising rental-DOM trend means longer vacancies and softer asking-rent achievability than the comps imply.
- What's the recent tenant-quality profile in this submarket — average credit score on applications, eviction rate, late-payment / NSF rate, and stable-employment percentage? A property-management company in the area should have these aggregated.
- How much new for-sale + rental construction is in the pipeline within 1–3 miles? Heavy new supply typically softens prices + rents 12–24 months out; constrained supply supports both.
Investment metrics
- 1% rule
- 0.96% ✗
- Cap rate
- 8.16%
- Cash-on-cash
- 6.66%
- DSCR
- 1.30
- GRM
- 8.7
CMA / ARV
- ARV (on-the-fly)
- $608,505
- Comps found
- 12
Show comp detail 12 sales within ~0.75 mi
| Address | Dist | Beds/Ba | Sqft | Sold | Price | $/sf | Match |
|---|---|---|---|---|---|---|---|
| 7898 Causeway Blvd N | 0.05mi | 3/2.0 | 1,566 (-8%) | 2mo | $417,000 | $266 | 83 |
| 7861 1st Ave S | 0.11mi | 3/3.0 | 1,608 (-5%) | 6mo | $795,000 | $494 | 77 |
| 213 Park St N | 0.35mi | 3/2.0 | 1,630 (-4%) | 4mo | $377,500 | $232 | 74 |
| 7952 1st Ave S | 0.15mi | 3/3.0 | 1,840 (+9%) | 12mo | $659,000 | $358 | 64 |
| 140 79th St S | 0.14mi | 3/2.0 | 1,488 (-12%) | 19mo | $650,000 | $437 | 58 |
| 7075 Sunset Dr S | 0.70mi | 3/2.0 | 1,742 (+3%) | 11mo | $575,000 | $330 | 54 |
| 7320 Burlington Ave N | 0.49mi | 3/2.0 | 1,877 (+11%) | 13mo | $714,000 | $380 | 48 |
| 10350 Paradise Blvd | 0.74mi | 3/2.0 | 1,586 (-6%) | 9mo | $800,000 | $504 | 48 |
| 7212 Burlington Ave N | 0.58mi | 3/2.0 | 1,507 (-11%) | 10mo | $625,000 | $415 | 46 |
| 7200 3rd Ave N | 0.62mi | 3/2.0 | 1,880 (+11%) | 14mo | $675,000 | $359 | 42 |
| 601 75th St N | 0.66mi | 4/2.5 (+1) | 1,859 (+10%) | 11mo | $315,000 | $169 | 36 |
| 7127 3rd Ave N | 0.67mi | 4/2.5 (+1) | 1,930 (+14%) | 10mo | $650,000 | $337 | 31 |
Match score weights: distance 35% · size 25% · config 20% · recency 20%. Top-matched comps best support the ARV.
Projected returns pro-forma
-3.0% appreciation · 0.0% rent growth · sell at horizon
- IRR
- -17.4%
- Equity multiple
- 0.40×
- Total profit
- $-59,732
- Equity at exit
- $53,416
- IRR
- -16.7%
- Equity multiple
- 0.20×
- Total profit
- $-79,835
- Equity at exit
- $30,975
Cash invested: $100,310 (down + closing). Projections, not guarantees.
Landlord ↔ Tenant lean methodology
- Overall (STATE)
- 87 Strongly Landlord-Friendly
- State Florida
- 87 Strongly Landlord-Friendly · R+3
- County
- — inherits STATE
- City
- — inherits STATE
ZIP-level market 33707
- Rents YoY
- -0.6%
- Active inventory
- 462
- Price-to-rent
- 8.7×
Monthly cashflow live
- Estimated rent
- $3,442 high interval (Pro) →
- Mortgage (P&I)
- −$1,879
- Tax from tax record
- −$135 /mo · $1,618/yr
- Insurance
- −$149
- Flood insurance flood zone
- −$427 /mo · $5,118/yr
- HOA
- −$0
- Vacancy / Maint / Mgmt
- −$723
- Net cashflow
- $130
Break-even live
Sensitivity live
| Price | -10% $333 | -5% $232 | +0% $130 | +5% $29 | +10% $-73 |
|---|---|---|---|---|---|
| Rent | -10% $-142 | -5% $-6 | +0% $130 | +5% $266 | +10% $402 |
| Rate | -1.0pp $311 | -0.5pp $221 | base $130 | +0.5pp $37 | +1.0pp $-57 |
UW: 25.0% down · 7.5% · 30yr · 1.5% tax · 5.0% vac · 8.0% maint · 8.0% mgmt
Financing live
Cash to close
- Down payment
- $89,562
- Closing costs
- $10,748
- Reserves months
- —
- Total cash needed
- —
Loan-product check · same deal, 3 products live
Conventional
25% down · 7.5% · 30yr
- Down + closing
- —
- Monthly P&I
- —
- Monthly cashflow
- —
- DSCR
- —
- Eligible?
- —
Personal DTI + credit; lowest rate.
DSCR
20% down · 8.5% · 30yr
- Down + closing
- —
- Monthly P&I
- —
- Monthly cashflow
- —
- DSCR
- —
- Eligible?
- —
No personal income docs; deal must DSCR.
Hard money
10% down · 12.0% · 12mo
- Down + closing
- —
- Monthly P&I
- —
- Monthly cashflow
- —
- DSCR
- —
- Eligible?
- —
Short-term bridge; refi at stabilization.
Rent comps 40 comps
| Address | Beds | Baths | Sqft | Rent | $/sqft | DOM | Units | Dist |
|---|---|---|---|---|---|---|---|---|
| 7930 Causeway Blvd S Saint Petersburg, FL | 3.0 | 2.0 | 1454 | $3,900 | $2.68 | 6d | 1 | 0.10mi |
| 500 Treasure Island Cswy Treasure Island, FL | 1.0–2.0 | 1.5–2.0 | 1096 | $2,900 | $2.64 | 6d | 4 | 0.52mi |
| 511 Sandy Hook Rd Treasure Island, FL | 4.0 | 3.5 | 2025 | $4,000 | $1.98 | 26d | 1 | 0.66mi |
| 7887 9th Ave S Saint Petersburg, FL | 4.0 | 2.5 | 1961 | $4,500 | $2.29 | 26d | 1 | 0.67mi |
| 10355 Paradise Blvd Treasure Island, FL | 1.0–2.0 | 1.0–2.0 | 1067 | $3,000 | $2.81 | 0d | 6 | 0.72mi |
| 507 Plaza Seville Ct Unit 514 Treasure Island, FL | 2.0 | 2.0 | 1145 | $2,495 | $2.18 | 9d | 1 | 0.78mi |
| 7004 Grevilla Ave S Unit 7004 South Pasadena, FL | 3.0 | 2.5 | 2017 | $3,800 | $1.88 | 26d | 1 | 0.91mi |
| 7050 Sunset Dr S #716 South Pasadena, FL | 2.0 | 2.0 | 1180 | $2,250 | $1.91 | 26d | 1 | 0.94mi |
| 6860 Park St S South Pasadena, FL | 2.0 | 2.0 | 1500 | $2,500 | $1.67 | 26d | 1 | 0.97mi |
| 7401 13th Ave N Saint Petersburg, FL | 4.0 | 2.0 | 1464 | $3,100 | $2.12 | 6d | 1 | 1.01mi |
| 7401 13th Ave N Saint Petersburg, FL | 4.0 | 2.0 | 1464 | $3,100 | $2.12 | 26d | 1 | 1.01mi |
| 11240 7th St E Treasure Island, FL | 3.0 | 3.0 | 1771 | $9,000 | $5.08 | 6d | 1 | 1.07mi |
| 11405 8th St E Treasure Island, FL | 4.0 | 3.0 | 2077 | $6,500 | $3.13 | 26d | 1 | 1.09mi |
| 11400 8th St E Treasure Island, FL | 3.0 | 2.0 | 1876 | $7,900 | $4.21 | 6d | 1 | 1.10mi |
| 865 115th Ave Treasure Island, FL | 3.0 | 3.0 | 1942 | $3,000 | $1.54 | 6d | 1 | 1.10mi |
| 7600 16th Ave N Saint Petersburg, FL | 2.0 | 1.0 | 1243 | $2,200 | $1.77 | 14d | 1 | 1.14mi |
| 9415 Blind Pass Rd #1006 St Pete Beach, FL | 2.0 | 2.0 | 1310 | $3,500 | $2.67 | 14d | 1 | 1.15mi |
| 9495 Blind Pass Rd #203 St Pete Beach, FL | 2.0 | 2.0 | 1270 | $3,800 | $2.99 | 26d | 1 | 1.16mi |
| 9495 Blind Pass Rd #1208 St Pete Beach, FL | 2.0 | 2.0 | 1430 | $3,700 | $2.59 | 9d | 1 | 1.16mi |
| 11140 5th St E Treasure Island, FL | 2.0 | 3.0 | 1787 | $3,700 | $2.07 | 26d | 1 | 1.17mi |
| 8041 Sailboat Key Blvd S #402 St Pete Beach, FL | 3.0 | 2.0 | 2000 | $5,000 | $2.50 | 26d | 1 | 1.18mi |
| 7645 Sun Island Dr S #101 South Pasadena, FL | 2.0 | 2.0 | 1385 | $3,200 | $2.31 | 26d | 1 | 1.20mi |
| 6660 Date Palm Ave S Unit 1018211P St. Petersburg, FL | 3.0 | 2.0 | 1345 | $7,268 | $5.40 | 0d | 1 | 1.20mi |
| 1308 70th St N Unit 1308 St. Petersburg, FL | 2.0 | 1.5 | 1100 | $2,500 | $2.27 | 26d | 1 | 1.20mi |
| 7910 Sun Island Dr S #101 South Pasadena, FL | 2.0 | 2.0 | 1170 | $2,500 | $2.14 | 26d | 1 | 1.21mi |
| 904 67th St S Saint Petersburg, FL | 3.0 | 1.0 | 1169 | $2,750 | $2.35 | 16d | 1 | 1.22mi |
| 8040 Sailboat Key Blvd S #203 St Pete Beach, FL | 2.0 | 2.0 | 1265 | $2,600 | $2.06 | 18d | 1 | 1.23mi |
| 9525 Blind Pass Rd #902 St Pete Beach, FL | 2.0 | 2.0 | 1175 | $3,900 | $3.32 | 26d | 1 | 1.23mi |
| 7700 Sun Island Dr S #503 South Pasadena, FL | 2.0 | 2.0 | 1215 | $2,395 | $1.97 | 26d | 1 | 1.23mi |
| 7625 Sun Island Dr S #108 South Pasadena, FL | 2.0 | 2.0 | 1170 | $3,000 | $2.56 | 26d | 1 | 1.24mi |
| 1473 Durling Dr S South Pasadena, FL | 3.0 | 2.0 | 1264 | $4,000 | $3.16 | 26d | 1 | 1.24mi |
| 7920 Sun Island Dr S #205 South Pasadena, FL | 3.0 | 2.0 | 1575 | $3,350 | $2.13 | 6d | 1 | 1.25mi |
| 1790 Russell Dr N Saint Petersburg, FL | 3.0 | 2.0 | 1277 | $2,800 | $2.19 | 6d | 1 | 1.25mi |
| 7540 Bay Island Dr S South Pasadena, FL | 2.0 | 1.0–2.0 | 827 | $2,900 | $3.50 | 13d | 3 | 1.26mi |
| 1328 Pasadena Ave S #206 South Pasadena, FL | 2.0 | 2.0 | 1100 | $2,700 | $2.45 | 26d | 1 | 1.29mi |
| 795 119th Ave Treasure Island, FL | 3.0 | 3.0 | 2192 | $6,500 | $2.97 | 26d | 1 | 1.33mi |
| 7405 Bay Island Dr S South Pasadena, FL | 2.0–3.0 | 2.0 | 1192 | $3,500 | $2.94 | 6d | 2 | 1.33mi |
| 7600 Sun Island Dr S South Pasadena, FL | 2.0 | 2.0 | 1400 | $2,350 | $1.68 | 6d | 1 | 1.34mi |
| 7600 Sun Island Dr S #205 South Pasadena, FL | 2.0 | 2.0 | 1250 | $2,190 | $1.75 | 26d | 1 | 1.35mi |
| 7984 Sailboat Key Blvd S #502 South Pasadena, FL | 2.0 | 2.0 | 1145 | $3,500 | $3.06 | 14d | 1 | 1.35mi |
Listing history 8 events
-
2026-06-22days on market $358,250 Active 12 DOM
-
2026-06-18days on market $358,250 Active 9 DOM
-
2026-06-17days on market $358,250 Active 8 DOM
-
2026-06-16days on market $358,250 Active 7 DOM
-
2026-06-15days on market $358,250 Active 6 DOM
-
2026-06-13days on market $358,250 Active 4 DOM
-
2026-06-10remarks 699-char remark
-
2026-06-10$358,250 Active 1 DOM
ⓘ Source: listings_history table (triggers on properties + properties_extension) + one-shot
backfill from property_details.listing_events for pre-trigger history.
Tax reassessment forecast FL · Resets to sale price
- Current annual tax
- $1,618 · $135/mo
- Projected year-2 tax
- $2,973 · $248/mo
- Expected delta
- +$1,356/yr (+$113/mo · 83.8%)
ⓘ Screening estimate from a state-policy table — verify with the county assessor before closing.
Climate risk First Street
- Flood 9/10 Extreme FEMA zone AE · 99% chance over 30 yrs
- Wildfire 1/10 Low
- Heat 10/10 Extreme 7 d/yr ≥106°F today · 25 d/yr by 30 yrs out
- Wind 10/10 Extreme 99% chance of damaging wind over 30 yrs
- Air quality 4/10 Moderate 4 unhealthy d/yr today · 4 by 30 yrs out
Nearby sold comps map
Loading sold comps map…
Walkable amenities ~0.75 mi
Loading nearby amenities…
Taxation est. · year 1
- Rental income
- $41,308
- − Mortgage interest
- −$20,068
- − Property taxes
- −$1,618
- − Insurance
- −$6,910
- − Repairs & maintenance
- −$3,305
- − Management
- −$3,305
- − Depreciation
- −$10,422
- Taxable loss
- −$4,318
- Est. tax savings @ 24.0%
- +$1,036
- After-tax cash flow
- $2,598/yr
For passive investors: Depreciation is non-cash, so a rental often shows a tax loss while cash-flowing — sheltering income. Rental losses are passive: they offset passive income freely, and up to $25,000/yr can offset ordinary (W-2) income if you actively participate and your MAGI is under $100k (phasing out to $0 by $150k); unused losses carry forward. On sale, claimed depreciation is recaptured at up to 25%, and gains may owe capital-gains tax (a 1031 exchange can defer both). Figures are a year-1 estimate at your 24.0% rate — not tax advice; consult a CPA.
Schools (NCES district)
- District
- Pinellas
- NCES district ID
- 1201560
- Math proficiency
- 51% ▼ -5.00%
- Reading proficiency
- 51% ▼ -3.00%
- Median HH income
- $46,270
- Composite
- 43.27/100
- National rank
- #3046
- State rank
- #31 of 73 in FL
Livability — St. Petersburg
No livability data for this city. (Only ~50 U.S. cities are tracked.)
Census & demographics
- Census place
- St. Petersburg, FL
- County
- Pinellas County · 939,478 people
- City population
- 249,151
- Metro
- Tampa-St. Petersburg-Clearwater, FL
- Population (ZIP)
- 24,324
- Household income
- $69,951
- Rent vs Own
- Severe rent burden
- 1371.0
Population outlook (Pinellas County) Hauer SSP2
- Today (2025)
- 1,027,532 people
- By 2030
- 1,063,586 · +3.5%
- By 2040
- 1,125,020 · +9.5%
- By 2050
- 1,168,637 · +13.7%
- By 2075
- 1,265,188 · +23.1%
- By 2100
- 1,260,357 · +22.7%
Race, ethnicity, and origin ACS 2023
- Neighborhood character
- Predominantly White (81%)
- Race & ethnicity
- White 81% Two or more races 7% Hispanic / Latino 7% Black 6% Asian 2%
- Hispanic origin (detail)
- Mexican 2% Puerto Rican 1% Cuban 1%
- Common ancestry
- Romanian 5% Lithuanian 3% Slovak 3%
- Foreign-born
- 11% · Canada, Vietnam
- Languages at home
- 89% English-only · Spanish 5% Russian/Polish/Slavic 1% French/Haitian/Cajun 1%
Political lean MEDSL · Pinellas
- 2024 margin
- Lean R (+5.2) · D 46.9% · R 52.1%
- 2008→2024 swing
- -13.5pp toward R · 2008: 8.3pp · 2024: -5.2pp
- All cycles
- 2024: R+5.2 2020: D+0.2 2016: R+1.1 2012: D+5.6 2008: D+8.3
Not yet ingested
- Civics
- —
Market trends
- HPI YoY
- ▼ -555.96%
- Current HPI
- 359.4858
- Rent YoY
- ▼ -0.61%
- Metro
- Tampa-St. Petersburg-Clearwater, FL
- State GDP YoY
- ▲ 3.28%
- F500 in state
- 36
Industry mix (Fortune 500 HQ in FL)
| Industry | F500 HQs | Revenue |
|---|---|---|
| Industrial Technology | 2 | $29B |
|
||
| Insurance | 2 | $17B |
|
||
| Retail | 1 | $60B |
|
||
| Technology Distribution | 1 | $58B |
|
||
| Homebuilding | 1 | $35B |
|
||
| Technology Manufacturing | 1 | $35B |
|
||
Price history
+497.1% since first listed3 events — show timeline
- 2026-06-09 Listed $358,250 Stellar MLS as Distributed by MLS Grid
- 1994-12-27 Sold (Public Records) $78,000 Public Records
- 1985-11-01 Sold (Public Records) $60,000 Public Records
Property tax history
-5.5%/yrLatest (2025): $1,618 · -9.8% YoY. Source: county tax records.
Cash-flow waterfall
monthlySold comps — $/sqft
last 12 mo · ≤1 miLoading sold comps…