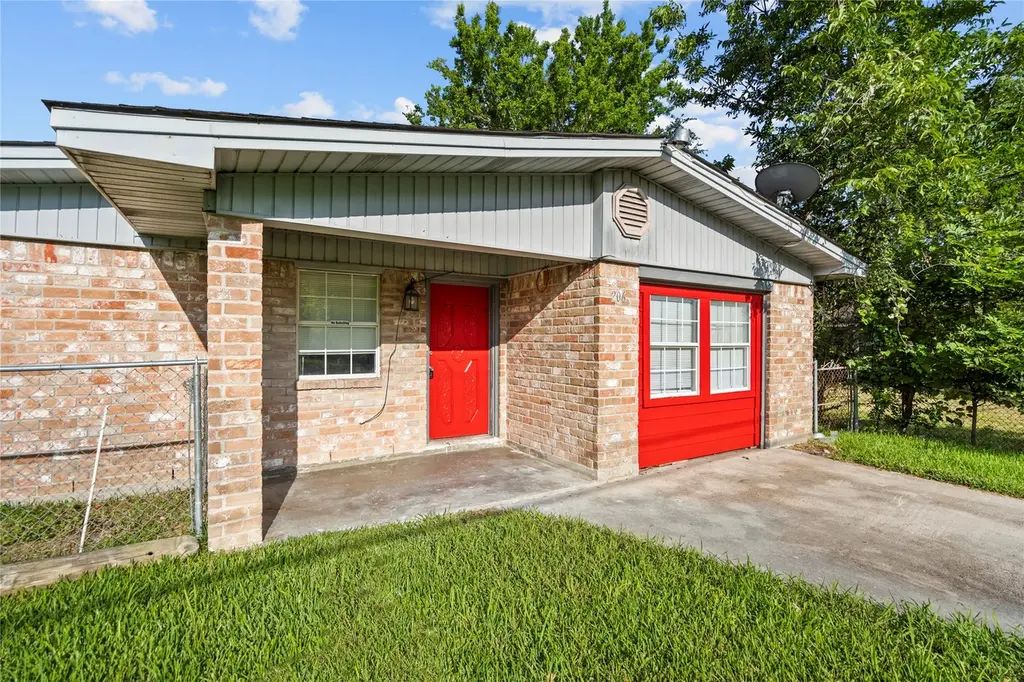
206 S Texas St · Texas City, TX
Flood risk 6/10 · Moderate
- FEMA flood zone
- X (shaded)
- Chance of flooding over 30 yrs
- 0.54%
- Est. flood insurance / yr
- $507 – $1,088
Fire risk 2/10 · Minimal
- Est. fire insurance / yr
- $1,222 – $2,270
Heat risk 10/10 · Severe
- Hot days now (above 110°F)
- 7 days/yr
- Hot days in 30 yrs
- 27 days/yr
Wind risk 10/10 · Severe
- Chance of severe wind over 30 yrs
- 99.0%
Air-quality risk 3/10 · Minor
- Unhealthy air days now
- 2 days/yr
- Unhealthy air days in 30 yrs
- 2 days/yr
Risk factors via First Street. Map © Google.
Why this score? — see what drove the C grade
The composite is a weighted blend of 9 inputs, each scored 0–100. Each bar is that input's sub-score; the figure is the points it added to the 100-point composite (weight × sub-score).
- Cash flow +19.8/30.0
- ARV discount +10.9/15.0
- 1% rule +6.7/10.0
- DSCR +6.3/10.0
- Rent growth +3.7/5.0
- Livability +3.1/5.0
- Condition / age +2.5/5.0
- Schools +2.4/10.0
- Appreciation +0.0/10.0
$179,900
🖨 Deal sheet 📄 Offer letter ✓ Due diligence
Listing remarks MLS
Amazing 4 bedroom 3 bath ready for move in! Large lot. Kitchen opens up to the dining area. Arched doorway, tile flooring and plenty of closet/storage space. Spacious bedrooms. Large backyard & fresh paint. Make an appointment to view today!
Key facts
- 7,135 sq ft lot
- Built 1972
- Listed 169 days
Neighborhood map
What this means for you Summary
Snapshot
- This is a 4-bed/2.0-bath single-family listed at $180k.
Deal economics
- At list price, monthly cash flow is $215 ($3k/yr) — positive.
- The deal already cash-flows at list — no discount required.
- Meets the 1% rule at list price ($2k rent vs $180k).
- Recommended offer: $158k (12.0% below list) — sets the bar for market timing.
- Cap rate 7.7% vs local median 4.3% in Texas City — top-decile yield for the area; either an underpriced asset or a hidden risk that comps aren't pricing in. Stress-test before assuming the spread holds.
Location & tenants
- Location reads 62/100 on livability (#907 in TX) — a middle-class / working-renter tenant base. Strengths: cost of living A+, housing A+; Watch: crime D+, schools F, amenities F.
- Texas City ISD (suburban): math 28% / reading 29% proficiency, ranked #655 of 826 in TX (top 79%) — low school quality limits family demand, transient renter base, plan for 1-2y turnover; 66% free/reduced lunch — lower-income household profile, screen leases tightly.
- Market conditions: Rents rising fast (+4.7%/yr); 240 active listings in the ZIP; 6 comparable units currently listed for rent nearby; rentals at typical pace (median 24d on market — plan ~3-4 weeks tenant-placement turnaround); 3,258 units permitted in Galveston County in 2024 (0 in 5+ unit buildings).
- This rent runs 37% of the median local income ($69k/yr) — at the standard rent-burdened threshold; future hikes will face affordability resistance.
Forward outlook
- Local home prices are declining (-3.0%/yr); year-one equity from $1k of loan paydown is wiped out by about $5k of value loss. Plan a longer hold.
- Galveston County population projected at +43% by 2050 — long-run rental-demand tailwind backs the buy-and-hold thesis.
Negotiation context
- It's been on market 170 days — a 12% lower offer ($158k) is reasonable based on typical stale-listing flexibility.
- 5 sale attempts since 13y ago; this cycle's ask has dropped $41k (19%) from the opening price — seller is motivated, your offer sets the floor, not the list.
Risks & watch-outs
- Watch-outs: property tax is 2.9% of price.
- Climate carrying-cost: major flood risk; severe wind risk, 99% chance of damaging wind over 30y; extreme-heat days projected 7→27/yr by 2055 (HVAC capex compounding) — expect insurance premiums to compound above CPI over the hold.
Questions for the listing agent
- It's been on market 170 days. Have you received any prior offers? Is the seller open to a 12% concession, seller financing, or rate buy-down credit?
- Built in 1972 — when were the roof, HVAC, electrical panel, plumbing, and water heater last replaced?
- Property tax is high relative to price — has the assessment been appealed recently, and will the sale trigger a re-assessment?
- Why hasn't it sold? Are there any deal-killer items the seller is aware of (foundation, flood, title, zoning, code violations)?
- Is there a deadline driving the sale (1031 exchange, divorce, estate, relocation)? That informs how much negotiation room exists.
- Schools are F-rated, which usually means shorter tenancies and higher turnover. Who's the typical renter profile here, and what's been the actual vacancy rate?
- Crime grade is D in this area — have there been break-ins, vandalism, or insurance claims at this property in the last 3 years? What carrier currently insures it and at what premium?
- What's the average days-on-market for RENTAL listings here right now (not sales)? A rising rental-DOM trend means longer vacancies and softer asking-rent achievability than the comps imply.
- What's the recent tenant-quality profile in this submarket — average credit score on applications, eviction rate, late-payment / NSF rate, and stable-employment percentage? A property-management company in the area should have these aggregated.
- How much new for-sale + rental construction is in the pipeline within 1–3 miles? Heavy new supply typically softens prices + rents 12–24 months out; constrained supply supports both.
Investment metrics
- 1% rule
- 1.17% ✓
- Cap rate
- 7.73%
- Cash-on-cash
- 5.13%
- DSCR
- 1.23
- GRM
- 7.1
CMA / ARV
- ARV (median comp)
- $194,595
- List price
- $179,900
- Delta
- -7.55%
- Verdict
- FAIR
- Comps
- 20 within 1.0 mi
Show comp detail 12 sales within ~0.75 mi
| Address | Dist | Beds/Ba | Sqft | Sold | Price | $/sf | Match |
|---|---|---|---|---|---|---|---|
| 112 S Rose St | 0.17mi | 4/3.0 | 1,812 (-3%) | 9mo | $244,900 | $135 | 76 |
| 6913 Carver | 0.09mi | 3/2.5 (-1) | 1,676 (-10%) | 2mo | $219,900 | $131 | 70 |
| 7426 Nightingale Cir | 0.52mi | 4/2.0 | 1,757 (-6%) | 1mo | $215,000 | $122 | 65 |
| 2012 Bellview | 0.55mi | 4/3.0 | 1,812 (-3%) | 1mo | $254,900 | $141 | 65 |
| 2832 Ashley St | 0.43mi | 3/2.0 (-1) | 1,750 (-6%) | 1mo | $289,000 | $165 | 63 |
| 114 S Rose St | 0.17mi | 3/2.5 (-1) | 1,676 (-10%) | 6mo | $229,900 | $137 | 63 |
| 26 N Golden Oak Dr | 0.51mi | 4/2.0 | 1,940 (+4%) | 10mo | $225,000 | $116 | 62 |
| 121 Lake Rd | 0.63mi | 3/2.0 (-1) | 1,909 (+2%) | 4mo | $68,000 | $36 | 58 |
| 6026 Diamond Ct | 0.68mi | 4/2.5 | 2,012 (+8%) | 4mo | $145,000 | $72 | 50 |
| 7224 Oriole St | 0.48mi | 3/2.0 (-1) | 1,629 (-13%) | 7mo | $285,000 | $175 | 45 |
| 3116 Mckinney Dr | 0.57mi | 4/2.0 | 2,116 (+13%) | 7mo | $165,000 | $78 | 45 |
| 8002 W Red Oak Ln | 0.70mi | 4/2.0 | 1,609 (-14%) | 4mo | $229,000 | $142 | 41 |
Match score weights: distance 35% · size 25% · config 20% · recency 20%. Top-matched comps best support the ARV.
Projected returns pro-forma
-3.0% appreciation · 4.67% rent growth · sell at horizon
- IRR
- -6.1%
- Equity multiple
- 0.77×
- Total profit
- $-11,682
- Equity at exit
- $26,824
- IRR
- 5.7%
- Equity multiple
- 1.46×
- Total profit
- $23,381
- Equity at exit
- $15,554
Cash invested: $50,372 (down + closing). Projections, not guarantees.
Landlord ↔ Tenant lean methodology
- Overall (STATE)
- 87 Strongly Landlord-Friendly
- State Texas
- 87 Strongly Landlord-Friendly · R+5
- County
- — inherits STATE
- City
- — inherits STATE
ZIP-level market 77591
- Home prices YoY
- -5.6%
- Rents YoY
- 4.7%
- Active inventory
- 240
- Price-to-rent
- 7.1×
Monthly cashflow live
- Estimated rent
- $2,103 high interval (Pro) →
- Mortgage (P&I)
- −$943
- Tax from tax record
- −$427 /mo · $5,128/yr
- Insurance
- −$75
- HOA
- −$0
- Vacancy / Maint / Mgmt
- −$442
- Net cashflow
- $215
Break-even live
UW: 25.0% down · 7.5% · 30yr · 1.5% tax · 5.0% vac · 8.0% maint · 8.0% mgmt
Financing live
Cash to close
- Down payment
- $44,975
- Closing costs
- $5,397
- Reserves months
- —
- Total cash needed
- —
Loan-product check · same deal, 3 products live
Conventional
25% down · 7.5% · 30yr
- Down + closing
- —
- Monthly P&I
- —
- Monthly cashflow
- —
- DSCR
- —
- Eligible?
- —
Personal DTI + credit; lowest rate.
DSCR
20% down · 8.5% · 30yr
- Down + closing
- —
- Monthly P&I
- —
- Monthly cashflow
- —
- DSCR
- —
- Eligible?
- —
No personal income docs; deal must DSCR.
Hard money
10% down · 12.0% · 12mo
- Down + closing
- —
- Monthly P&I
- —
- Monthly cashflow
- —
- DSCR
- —
- Eligible?
- —
Short-term bridge; refi at stabilization.
Rent comps 6 comps
| Address | Beds | Baths | Sqft | Rent | $/sqft | DOM | Units | Dist |
|---|---|---|---|---|---|---|---|---|
| 14403 Daniel Shores Dr La Marque, TX | 4.0 | 3.0–3.5 | 1872 | $2,600 | $1.39 | 1d | 12 | 0.89mi |
| 1006 E Camp Cir La Marque, TX | 3.0 | 1.0 | 1230 | $1,500 | $1.22 | 24d | 1 | 0.91mi |
| 8208 Ash Rd Texas City, TX | 4.0 | 2.0 | 1701 | $1,795 | $1.06 | 43d | 1 | 0.98mi |
| 203 Beatrice St La Marque, TX | 3.0 | 1.0 | 1304 | $1,395 | $1.07 | 24d | 1 | 1.08mi |
| 1401 Austin St La Marque, TX | 4.0 | 3.0 | 1542 | $2,400 | $1.56 | 43d | 1 | 1.18mi |
| 1230 Kirsten St La Marque, TX | 3.0 | 2.0 | 1704 | $1,660 | $0.97 | 2d | 1 | 1.38mi |
Listing history 28 events
-
2026-06-18days on market $179,900 Active 170 DOM
-
2026-06-17days on market $179,900 Active 169 DOM
-
2026-06-16days on market $179,900 Active 168 DOM
-
2026-06-15price $179,900 Active 167 DOM
-
2026-06-15days on market $184,900 Active 167 DOM
-
2026-06-13days on market $184,900 Active 165 DOM
-
2026-06-09days on market $184,900 Active 161 DOM
-
2026-06-08days on market $184,900 Active 160 DOM
-
2026-06-07pricedays on market $184,900 Active 159 DOM
-
2026-06-04days on market $189,900 Active 156 DOM
-
2026-06-03days on market $189,900 Active 155 DOM
-
2026-06-02days on market $189,900 Active 154 DOM
-
2026-06-01days on market $189,900 Active 153 DOM
-
2026-05-31days on market $189,900 Active 152 DOM
-
2026-05-06price $189,900 246-char remark
Show marketing remark (246 chars)
Amazing 4 bedroom 3 bath ready for move in! Large lot. Kitchen opens up to the dining area. Arched doorway, tile flooring and plenty of closet/storage space. Spacious bedrooms. Large backyard & fresh paint. Make an appointment to view today!
-
2026-01-21price $194,900 246-char remark
Show marketing remark (246 chars)
Amazing 4 bedroom 3 bath ready for move in! Large lot. Kitchen opens up to the dining area. Arched doorway, tile flooring and plenty of closet/storage space. Spacious bedrooms. Large backyard & fresh paint. Make an appointment to view today!
-
2025-12-30$221,000 Active 246-char remark
Show marketing remark (246 chars)
Amazing 4 bedroom 3 bath ready for move in! Large lot. Kitchen opens up to the dining area. Arched doorway, tile flooring and plenty of closet/storage space. Spacious bedrooms. Large backyard & fresh paint. Make an appointment to view today!
-
2024-04-26historical $1,700
-
2024-04-06$1,700
-
2023-06-16historical
-
2023-06-14$195,000 Active
-
2023-04-13historical
-
2023-01-25price $194,100
-
2022-11-07$195,000 Active
-
2013-03-06soldstatus
-
2013-02-06historical
-
2013-01-01$34,900
-
1996-07-18soldstatus
ⓘ Source: listings_history table (triggers on properties + properties_extension) + one-shot
backfill from property_details.listing_events for pre-trigger history.
Tax reassessment forecast TX · Resets to sale price
- Current annual tax
- $5,128 · $427/mo
- Projected year-2 tax
- $5,128 · $427/mo
- Expected delta
- $0/yr ($0/mo · 0.0%)
ⓘ Screening estimate from a state-policy table — verify with the county assessor before closing.
Climate risk First Street
- Flood 6/10 Major FEMA zone X (shaded) · 54% chance over 30 yrs
- Wildfire 2/10 Low
- Heat 10/10 Extreme 7 d/yr ≥110°F today · 27 d/yr by 30 yrs out
- Wind 10/10 Extreme 99% chance of damaging wind over 30 yrs
- Air quality 3/10 Moderate 2 unhealthy d/yr today · 2 by 30 yrs out
Nearby sold comps map
Loading sold comps map…
Walkable amenities ~0.75 mi
Loading nearby amenities…
Taxation est. · year 1
- Rental income
- $25,232
- − Mortgage interest
- −$10,077
- − Property taxes
- −$5,128
- − Insurance
- −$900
- − Repairs & maintenance
- −$2,019
- − Management
- −$2,019
- − Depreciation
- −$5,233
- Taxable loss
- −$143
- Est. tax savings @ 24.0%
- +$34
- After-tax cash flow
- $2,620/yr
For passive investors: Depreciation is non-cash, so a rental often shows a tax loss while cash-flowing — sheltering income. Rental losses are passive: they offset passive income freely, and up to $25,000/yr can offset ordinary (W-2) income if you actively participate and your MAGI is under $100k (phasing out to $0 by $150k); unused losses carry forward. On sale, claimed depreciation is recaptured at up to 25%, and gains may owe capital-gains tax (a 1031 exchange can defer both). Figures are a year-1 estimate at your 24.0% rate — not tax advice; consult a CPA.
Schools (NCES district)
- District
- Texas City ISD
- NCES district ID
- 4842510
- Math proficiency
- 28% ▼ -10.00%
- Reading proficiency
- 29% ▼ -4.00%
- Median HH income
- $44,875
- Composite
- 24.47/100
- National rank
- #7664
- State rank
- #655 of 826 in TX
Livability — Texas City
- Score
- 62/100
- State rank
- #907
- US rank
- #16268
Category grades
Schools grade is shown separately in the Schools card above.
Census & demographics
- Census place
- Texas City, TX
- County
- Galveston County · 357,330 people
- City population
- 49,936
- Metro
- Houston-The Woodlands-Sugar Land, TX
- Population (ZIP)
- 18,294
- Household income
- $68,593
- Rent vs Own
- Severe rent burden
- 718.0
Population outlook (Galveston County) Hauer SSP2
- Today (2025)
- 390,640 people
- By 2030
- 425,226 · +8.9%
- By 2040
- 493,765 · +26.4%
- By 2050
- 559,698 · +43.3%
- By 2075
- 719,260 · +84.1%
- By 2100
- 819,628 · +109.8%
Race, ethnicity, and origin ACS 2023
- Neighborhood character
- Diverse neighborhood (Simpson 0.65)
- Race & ethnicity
- Black 50% White 26% Hispanic / Latino 19% Two or more races 9% Asian 2%
- Hispanic origin (detail)
- Mexican 15%
- Common ancestry
- Lithuanian 2% Romanian 1% Slovak 1%
- Foreign-born
- 7% · Canada, China
- Languages at home
- 88% English-only · Spanish 9% Other Indo-European 1% Chinese 1%
Political lean MEDSL · Galveston
- 2024 margin
- Strong R (+27.4) · D 35.7% · R 63.1% · Other 1.2%
- 2008→2024 swing
- -7.9pp toward R · 2008: -19.5pp · 2024: -27.4pp
- All cycles
- 2024: R+27.4 2020: R+22.6 2016: R+22.6 2012: R+26.9 2008: R+19.5
Not yet ingested
- Civics
- —
Market trends
- HPI YoY
- ▼ -14.63%
- Current HPI
- 247.1905
- Rent YoY
- ▲ 4.67%
- Metro
- Houston-The Woodlands-Sugar Land, TX
- State GDP YoY
- ▲ 3.95%
- F500 in state
- 110
Industry mix (Fortune 500 HQ in TX)
| Industry | F500 HQs | Revenue |
|---|---|---|
| Energy | 16 | $1,198B |
|
||
| Technology | 5 | $198B |
|
||
| Engineering / Construction | 4 | $72B |
|
||
| Energy Services | 3 | $60B |
|
||
| Utilities | 3 | $41B |
|
||
| Healthcare | 2 | $330B |
|
||
Price history
+444.1% since first listed14 events — show timeline
- 2026-05-06 Price Changed $189,900 HARMLS
- 2026-01-21 Price Changed $194,900 HARMLS
- 2025-12-30 Listed $221,000 HARMLS
- 2024-04-26 Rental Removed $1,700 HARMLS
- 2024-04-06 Listed for Rent $1,700 HARMLS
- 2023-06-16 Listing Removed — HARMLS
- 2023-06-14 Listed $195,000 HARMLS
- 2023-04-13 Listing Removed — HARMLS
- 2023-01-25 Price Changed $194,100 HARMLS
- 2022-11-07 Listed $195,000 HARMLS
- 2013-03-06 Sold (MLS) — HARMLS
- 2013-02-06 Listing Removed — HARMLS
- 2013-01-01 Listed $34,900 HARMLS
- 1996-07-18 Sold (Public Records) — Public Records
Property tax history
+17.3%/yrLatest (2025): $5,128 · +7.8% YoY. Source: county tax records.
Cash-flow waterfall
monthlySold comps — $/sqft
last 12 mo · ≤1 miLoading sold comps…