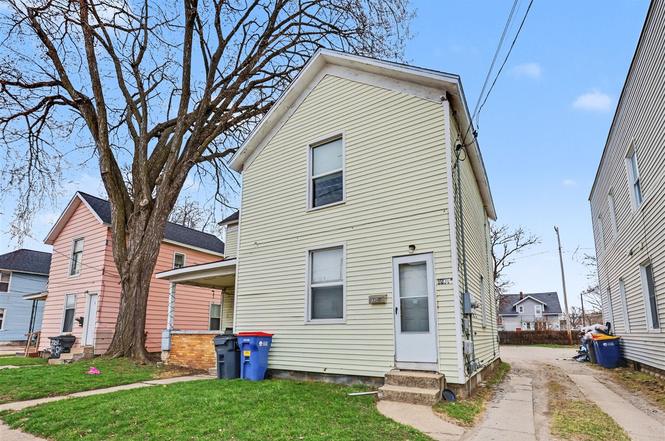
1236 Alpine Ave NW · Grand Rapids, MI
Flood risk 4/10 · Minor
- FEMA flood zone
- X (shaded)
- Chance of flooding over 30 yrs
- 0.22%
- Est. flood insurance / yr
- $473 – $860
Fire risk 1/10 · Minimal
- Est. fire insurance / yr
- $784 – $1,456
Heat risk 3/10 · Minor
- Hot days now (above 96°F)
- 7 days/yr
- Hot days in 30 yrs
- 16 days/yr
Wind risk 2/10 · Minimal
- Chance of severe wind over 30 yrs
- —
Air-quality risk 3/10 · Minor
- Unhealthy air days now
- 2 days/yr
- Unhealthy air days in 30 yrs
- 3 days/yr
Risk factors via First Street. Map © Google.
Why this score? — see what drove the D+ grade
The composite is a weighted blend of 9 inputs, each scored 0–100. Each bar is that input's sub-score; the figure is the points it added to the 100-point composite (weight × sub-score).
- Cash flow +19.4/30.0
- ARV discount +7.5/15.0
- DSCR +6.1/10.0
- 1% rule +4.7/10.0
- Livability +4.2/5.0
- Rent growth +3.2/5.0
- Condition / age +2.5/5.0
- Schools +1.9/10.0
- Appreciation +0.0/10.0
$225,000
🖨 Deal sheet 📄 Offer letter ✓ Due diligence
Listing remarks MLS
Add to your investment portfolio with this duplex, offered as part of a larger multifamily package on Alpine Avenue. Each unit features 2 bedrooms and 1 bathroom, providing a desirable floor plan that appeals to a wide range of tenants. The property offers consistent rental income, separate living spaces, and strong long-term investment potential in one of Grand Rapids' established rental corridors. Conveniently located near downtown Grand Rapids, major employers, shopping, dining, and public transportation, this duplex benefits from continued tenant demand and easy access to everyday amenities. There is room to increase rents through unit improvement. Purchase individually or combine with the neighboring multifamily properties for a rare opportunity to acquire multiple income-producing units in a contiguous portfolio.
Key facts
- 6,534 sq ft lot
- 4 parking spots
- Built 1890
Tags
Property features AI
Finance
- Other: Zoned residential; Lot frontage 49'; Lot size about 0.15 acres
- Financial info: Two-unit building; One unit listed as occupied; other unit not occupied; Reported rent for one unit: $995
- HOA & community: Landlord/association pays trash removal and water/sewer
Exterior
- Utilities: Natural gas
- Home design: Multi-family property; Built in 1890
- Construction: Basement foundation
- Exterior features: Vinyl siding
Interior
- Heating & cooling: Forced air heating
- Interior features: Basement (Mi Basement)
Neighborhood map
What this means for you Summary
Snapshot
- This is a 4-bed/2.0-bath single-family listed at $225k.
Deal economics
- At list price, monthly cash flow is $252 ($3k/yr) — positive.
- The deal already cash-flows at list — no discount required.
- To meet the 1% rule (rent ≥ 1% of price), the offer needs to be $218k (3.1% below list).
- Recommended offer: $218k (3.1% below list) — sets the bar for 1% rule.
- Cap rate 7.6% vs local median 4.5% in Grand Rapids — top-decile yield for the area; either an underpriced asset or a hidden risk that comps aren't pricing in. Stress-test before assuming the spread holds.
Location & tenants
- Location reads 83/100 on livability (#44 in MI, #939 nationally) — a professional / high-income tenant draw. Strengths: amenities A+, commute A+, cost of living A+; Watch: employment C-, crime F.
- Grand Rapids Public Schools (urban): math 15% / reading 29% proficiency, ranked #451 of 540 in MI (top 84%) — low school quality limits family demand, transient renter base, plan for 1-2y turnover; 80% free/reduced lunch — lower-income household profile, screen leases tightly.
- Market conditions: Rents rising (+2.6%/yr); 153 active listings in the ZIP; 13 comparable units currently listed for rent nearby; rentals lingering (median 44d on market — plan ~5-8 weeks vacancy on turnover, expect pricing pressure); 92% of comp listings sitting > 30 days — soft ceiling on asking rent; 2,253 units permitted in Kent County in 2024 (969 in 5+ unit buildings).
- This rent runs 37% of the median local income ($70k/yr) — at the standard rent-burdened threshold; future hikes will face affordability resistance.
Forward outlook
- Local home prices are declining (-3.0%/yr); year-one equity from $2k of loan paydown is wiped out by about $7k of value loss. Plan a longer hold.
- Kent County population projected at +22% by 2050 — long-run rental-demand tailwind backs the buy-and-hold thesis.
Negotiation context
- Only 4 days on market — expect competitive offers; lowballing is unlikely to land.
- 2 sale attempts with the ask held roughly flat each time — persistent listings suggest the price (not the market) is what's stuck; bring a comps-based counter.
Risks & watch-outs
- Watch-outs: built in 1890 — expect roof / HVAC / electrical / plumbing capex.
Questions for the listing agent
- Built in 1890 — when were the roof, HVAC, electrical panel, plumbing, and water heater last replaced?
- Is there a deadline driving the sale (1031 exchange, divorce, estate, relocation)? That informs how much negotiation room exists.
- Crime grade is F in this area — have there been break-ins, vandalism, or insurance claims at this property in the last 3 years? What carrier currently insures it and at what premium?
- The area grade is low — what's the realistic commute time and amenity access for the typical tenant pool here? Any planned neighborhood developments (good or bad) we should know about?
- What's the average days-on-market for RENTAL listings here right now (not sales)? A rising rental-DOM trend means longer vacancies and softer asking-rent achievability than the comps imply.
- What's the recent tenant-quality profile in this submarket — average credit score on applications, eviction rate, late-payment / NSF rate, and stable-employment percentage? A property-management company in the area should have these aggregated.
- How much new for-sale + rental construction is in the pipeline within 1–3 miles? Heavy new supply typically softens prices + rents 12–24 months out; constrained supply supports both.
Investment metrics
- 1% rule
- 0.97% ✗
- Cap rate
- 7.64%
- Cash-on-cash
- 4.79%
- DSCR
- 1.21
- GRM
- 8.6
CMA / ARV
No comps found within radius.
Projected returns pro-forma
-3.0% appreciation · 2.64% rent growth · sell at horizon
- IRR
- -9.2%
- Equity multiple
- 0.66×
- Total profit
- $-21,233
- Equity at exit
- $33,548
- IRR
- -0.3%
- Equity multiple
- 0.98×
- Total profit
- $-1,127
- Equity at exit
- $19,454
Cash invested: $63,000 (down + closing). Projections, not guarantees.
Landlord ↔ Tenant lean methodology
- Overall (STATE)
- 62 Landlord-Friendly
- State Michigan
- 62 Landlord-Friendly · EVEN
- County
- — inherits STATE
- City
- — inherits STATE
ZIP-level market 49504
- Rents YoY
- 2.6%
- Active inventory
- 153
- Price-to-rent
- 8.6×
Monthly cashflow live
- Estimated rent
- $2,181 high interval (Pro) →
- Mortgage (P&I)
- −$1,180
- Tax from tax record
- −$198 /mo · $2,373/yr
- Insurance
- −$94
- HOA
- −$0
- Vacancy / Maint / Mgmt
- −$458
- Net cashflow
- $252
Break-even live
UW: 25.0% down · 7.5% · 30yr · 1.5% tax · 5.0% vac · 8.0% maint · 8.0% mgmt
Financing live
Cash to close
- Down payment
- $56,250
- Closing costs
- $6,750
- Reserves months
- —
- Total cash needed
- —
Loan-product check · same deal, 3 products live
Conventional
25% down · 7.5% · 30yr
- Down + closing
- —
- Monthly P&I
- —
- Monthly cashflow
- —
- DSCR
- —
- Eligible?
- —
Personal DTI + credit; lowest rate.
DSCR
20% down · 8.5% · 30yr
- Down + closing
- —
- Monthly P&I
- —
- Monthly cashflow
- —
- DSCR
- —
- Eligible?
- —
No personal income docs; deal must DSCR.
Hard money
10% down · 12.0% · 12mo
- Down + closing
- —
- Monthly P&I
- —
- Monthly cashflow
- —
- DSCR
- —
- Eligible?
- —
Short-term bridge; refi at stabilization.
Rent comps 13 comps
| Address | Beds | Baths | Sqft | Rent | $/sqft | DOM | Units | Dist |
|---|---|---|---|---|---|---|---|---|
| 734 Crosby St NW Unit 1 Grand Rapids, MI | 3.0 | 1.0 | 1057 | $1,800 | $1.70 | 44d | 1 | 0.07mi |
| 927 Arianna St NW Grand Rapids, MI | 4.0 | 3.0 | 1500 | $3,000 | $2.00 | 44d | 1 | 0.25mi |
| 1044 Muskegon Ave NW Unit 2 Grand Rapids, MI | 3.0 | 1.0 | 1100 | $1,800 | $1.64 | 44d | 1 | 0.30mi |
| 523 Crosby St NW Grand Rapids, MI | 5.0 | 2.0 | 1701 | $2,200 | $1.29 | 44d | 1 | 0.36mi |
| 1429 Quarry Ave NW Unit 1 Grand Rapids, MI | 3.0 | 1.5 | 1200 | $1,800 | $1.50 | 44d | 1 | 0.39mi |
| 1335 Hamilton Ave NW Unit 2 Grand Rapids, MI | 3.0 | 1.0 | 1124 | $1,395 | $1.24 | 44d | 1 | 0.41mi |
| 1756 Tamarack Ave NW Grand Rapids, MI | 3.0 | 2.0 | 1700 | $2,195 | $1.29 | 44d | 1 | 0.73mi |
| 700 Broadway Ave NW Unit 1 Grand Rapids, MI | 4.0 | 2.0 | 1450 | $2,795 | $1.93 | 44d | 1 | 0.81mi |
| 50 Mathews Ct NE Grand Rapids, MI | 3.0 | 1.5 | 1100 | $1,850 | $1.68 | 44d | 1 | 1.11mi |
| 135 Page St NE Grand Rapids, MI | 3.0 | 2.0 | 1100 | $3,100 | $2.82 | 44d | 1 | 1.17mi |
| 138 Travis St NE Grand Rapids, MI | 4.0 | 2.0 | 1800 | $2,395 | $1.33 | 11d | 1 | 1.24mi |
| 728 Fairview Ave NE Grand Rapids, MI | 4.0 | 2.0 | 2000 | $2,100 | $1.05 | 44d | 1 | 1.27mi |
| 200 Gold Ave NW Grand Rapids, MI | 3.0 | 1.0 | 1112 | $1,549 | $1.39 | 44d | 1 | 1.31mi |
Listing history 6 events
-
2026-06-18days on market $225,000 Active 4 DOM
-
2026-06-17days on market $225,000 Active 3 DOM
-
2026-06-16days on market $225,000 Active 2 DOM
-
2026-06-15$225,000 Active 1 DOM
-
2026-06-15remarks 699-char remark
-
2026-06-15$225,000 Active 1 DOM
ⓘ Source: listings_history table (triggers on properties + properties_extension) + one-shot
backfill from property_details.listing_events for pre-trigger history.
Tax reassessment forecast MI · Partial reset (capped growth)
- Current annual tax
- $2,373 · $198/mo
- Projected year-2 tax
- $2,919 · $243/mo
- Expected delta
- +$546/yr (+$45/mo · 23.0%)
ⓘ Screening estimate from a state-policy table — verify with the county assessor before closing.
Climate risk First Street
- Flood 4/10 Moderate FEMA zone X (shaded) · 22% chance over 30 yrs
- Wildfire 1/10 Low
- Heat 3/10 Moderate 7 d/yr ≥96°F today · 16 d/yr by 30 yrs out
- Wind 2/10 Low
- Air quality 3/10 Moderate 2 unhealthy d/yr today · 3 by 30 yrs out
Nearby sold comps map
Loading sold comps map…
Walkable amenities ~0.75 mi
Loading nearby amenities…
Taxation est. · year 1
- Rental income
- $26,175
- − Mortgage interest
- −$12,603
- − Property taxes
- −$2,373
- − Insurance
- −$1,125
- − Repairs & maintenance
- −$2,094
- − Management
- −$2,094
- − Depreciation
- −$6,545
- Taxable loss
- −$660
- Est. tax savings @ 24.0%
- +$159
- After-tax cash flow
- $3,179/yr
For passive investors: Depreciation is non-cash, so a rental often shows a tax loss while cash-flowing — sheltering income. Rental losses are passive: they offset passive income freely, and up to $25,000/yr can offset ordinary (W-2) income if you actively participate and your MAGI is under $100k (phasing out to $0 by $150k); unused losses carry forward. On sale, claimed depreciation is recaptured at up to 25%, and gains may owe capital-gains tax (a 1031 exchange can defer both). Figures are a year-1 estimate at your 24.0% rate — not tax advice; consult a CPA.
Schools (NCES district)
- District
- Grand Rapids Public Schools
- NCES district ID
- 2616440
- Math proficiency
- 15% ▼ -5.00%
- Reading proficiency
- 29% ▼ -1.00%
- Median HH income
- $40,612
- Composite
- 18.62/100
- National rank
- #8899
- State rank
- #451 of 540 in MI
Livability — Grand Rapids
- Score
- 83/100
- State rank
- #44
- US rank
- #939
Category grades
Schools grade is shown separately in the Schools card above.
Census & demographics
- Census place
- Grand Rapids, MI
- County
- Kent County · 533,805 people
- City population
- 181,325
- Metro
- Grand Rapids-Kentwood, MI
- Population (ZIP)
- 40,036
- Household income
- $70,119
- Rent vs Own
- Severe rent burden
- 2132.0
Population outlook (Kent County) Hauer SSP2
- Today (2025)
- 712,484 people
- By 2030
- 748,618 · +5.1%
- By 2040
- 814,777 · +14.4%
- By 2050
- 868,556 · +21.9%
- By 2075
- 966,487 · +35.7%
- By 2100
- 967,975 · +35.9%
Race, ethnicity, and origin ACS 2023
- Neighborhood character
- Predominantly White (70%)
- Race & ethnicity
- White 70% Hispanic / Latino 16% Two or more races 10% Black 8% Asian 2%
- Hispanic origin (detail)
- Mexican 12% Puerto Rican 1%
- Common ancestry
- Romanian 11% Iranian 10% Lithuanian 3%
- Foreign-born
- 8% · Canada, South Korea, China
- Languages at home
- 88% English-only · Spanish 9% Other Indo-European 1%
Political lean MEDSL · Kent
- 2024 margin
- Lean D (+5.4) · D 51.8% · R 46.5% · Other 1.7%
- 2008→2024 swing
- +4.8pp toward D · 2008: 0.5pp · 2024: 5.4pp
- All cycles
- 2024: D+5.4 2020: D+6.1 2016: R+3.1 2012: R+7.9 2008: D+0.5
Not yet ingested
- Civics
- —
Market trends
- HPI YoY
- ▼ -274.76%
- Current HPI
- 313.231
- Rent YoY
- ▲ 2.64%
- Metro
- Grand Rapids-Kentwood, MI
- State GDP YoY
- ▲ 1.37%
- F500 in state
- 28
Industry mix (Fortune 500 HQ in MI)
| Industry | F500 HQs | Revenue |
|---|---|---|
| Automotive Parts | 3 | $48B |
|
||
| Automotive | 2 | $372B |
|
||
| Chemicals | 1 | $45B |
|
||
| Automotive Retail | 1 | $29B |
|
||
| Healthcare / Medical Devices | 1 | $23B |
|
||
| Automotive Technology | 1 | $20B |
|
||
Price history
+0.0% since first listed3 events — show timeline
- 2026-06-13 Listed $225,000 REALCOMP
- 2026-06-13 Listed $225,000 MiRealSource-MiMLS
- 2022-03-11 Price Changed $995 RENT.
Property tax history
+5.1%/yrLatest (2025): $2,373 · +2.7% YoY. Source: county tax records.
Cash-flow waterfall
monthlySold comps — $/sqft
last 12 mo · ≤1 miLoading sold comps…