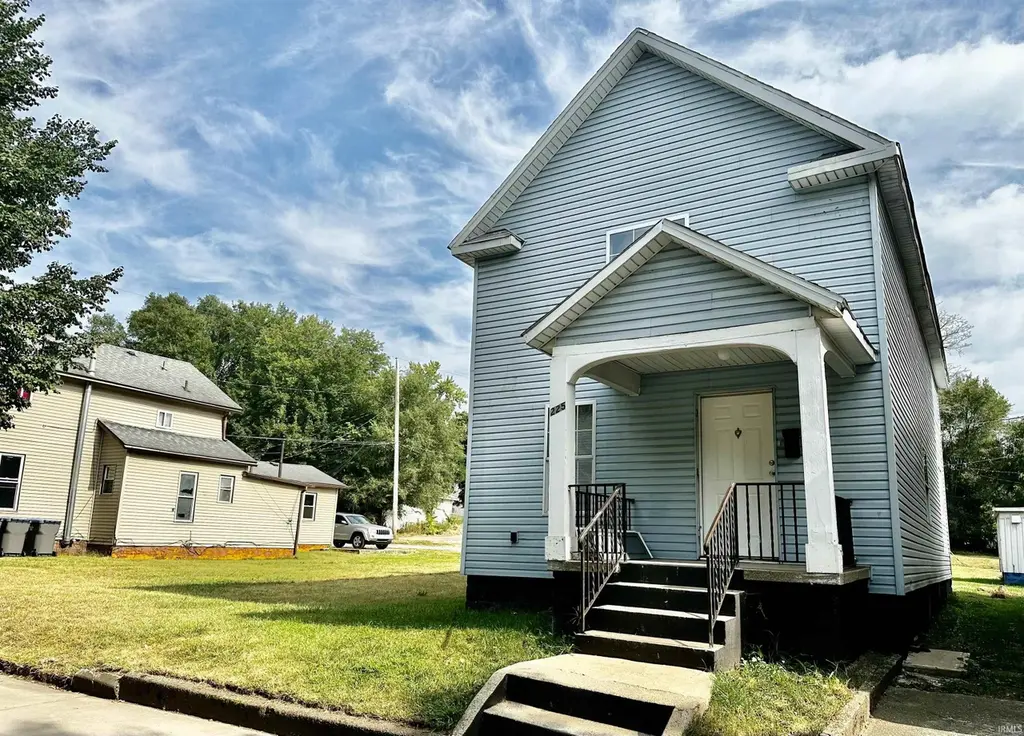
225 W Washington St · Elkhart, IN
Flood risk 10/10 · Severe
- FEMA flood zone
- X (shaded)
- Chance of flooding over 30 yrs
- 0.99%
- Est. flood insurance / yr
- $473 – $860
Fire risk 1/10 · Minimal
- Est. fire insurance / yr
- $717 – $1,331
Heat risk 3/10 · Minor
- Hot days now (above 101°F)
- 7 days/yr
- Hot days in 30 yrs
- 16 days/yr
Wind risk 2/10 · Minimal
- Chance of severe wind over 30 yrs
- —
Air-quality risk 3/10 · Minor
- Unhealthy air days now
- 2 days/yr
- Unhealthy air days in 30 yrs
- 3 days/yr
Risk factors via First Street. Map © Google.
Why this score? — see what drove the F grade
The composite is a weighted blend of 9 inputs, each scored 0–100. Each bar is that input's sub-score; the figure is the points it added to the 100-point composite (weight × sub-score).
- Cash flow +10.8/30.0
- Livability +3.4/5.0
- DSCR +3.1/10.0
- 1% rule +2.6/10.0
- Rent growth +2.5/5.0
- Condition / age +2.5/5.0
- Schools +1.8/10.0
- ARV discount +0.0/15.0
- Appreciation +0.0/10.0
$162,900
🖨 Deal sheet (PDF) 📄 Offer letter ✓ Due diligence
Listing remarks MLS
Just minutes from downtown Elkhart’s Riverwalk, dining, shopping, parks, and the Aquatic Center, this updated 4-bedroom, 2-bath home offers both convenience and comfort. Featuring all new flooring, fresh paint throughout, and a newer kitchen with stainless steel appliances included. Opportunity awaits with an additional 41x160 adjacent lot to the east available for purchase. Don’t miss your chance to see it!
Key facts
- Fresh paint
- Newer kitchen
- New flooring
Tags
Neighborhood map
What this means for you Summary
Snapshot
- This is a 2-bed/1.0-bath single-family listed at $163k.
Deal economics
- At list price, monthly cash flow is $-129 ($-2k/yr) — negative.
- To cash-flow at today's rent, offer at most $140k (14.0% below list).
- To meet the 1% rule (rent ≥ 1% of price), the offer needs to be $124k (24.0% below list).
- Recommended offer: $124k (24.0% below list) — sets the bar for 1% rule.
- Cap rate 5.7% vs local median 4.0% in Elkhart — top-decile yield for the area; either an underpriced asset or a hidden risk that comps aren't pricing in. Stress-test before assuming the spread holds.
Location & tenants
- Location reads 68/100 on livability (#224 in IN) — a middle-class / working-renter tenant base. Strengths: cost of living A+, housing A+, health & safety A+; Watch: amenities C-, crime F, commute F.
- Elkhart Community Schools (urban): math 18% / reading 25% proficiency, ranked #271 of 301 in IN (top 90%) — low school quality limits family demand, transient renter base, plan for 1-2y turnover.
- Zoned schools: Beardsley Elementary School (math 9% / reading 8%, grade F, #939 of 994 statewide, top 95%, 457 students, 73% FRL); North Side Middle School (math 15% / reading 31%, grade F, #263 of 330 statewide, top 80%, 627 students, 72% FRL).
- Market conditions: 150 active listings in the ZIP; 5 comparable units currently listed for rent nearby; rentals at typical pace (median 23d on market — plan ~3-4 weeks tenant-placement turnaround); 40% of comp listings sitting > 30 days — soft ceiling on asking rent; 484 units permitted in Elkhart County in 2024 (136 in 5+ unit buildings).
Forward outlook
- Local home prices are declining (-3.0%/yr); year-one equity from $1k of loan paydown is wiped out by about $5k of value loss. Plan a longer hold.
- Elkhart County population projected at +7% by 2050 — modest demand growth; plan on rents tracking national, not racing it.
Negotiation context
- It's been on market 69 days — a 6% lower offer ($153k) is reasonable based on typical stale-listing flexibility.
- 5 sale attempts since 2y ago with the ask held roughly flat each time — persistent listings suggest the price (not the market) is what's stuck; bring a comps-based counter.
- Current owner paid $32k; list at $163k implies a 417% gain — meaningful room to come down on a strong offer.
Risks & watch-outs
- Watch-outs: flood insurance adds $56/mo; built in 1900 — expect roof / HVAC / electrical / plumbing capex.
- Climate carrying-cost: severe flood risk — expect insurance premiums to compound above CPI over the hold.
Questions for the listing agent
- What do current leases actually rent for vs. the listed asking? Can we see a recent rent roll and the last 12 months of T-12 income?
- It's been on market 69 days. Have you received any prior offers? Is the seller open to a 24% concession, seller financing, or rate buy-down credit?
- Built in 1900 — when were the roof, HVAC, electrical panel, plumbing, and water heater last replaced?
- What's the actual annual flood-insurance premium (NFIP or private), and is the property in a SFHA with mandatory coverage?
- Why hasn't it sold? Are there any deal-killer items the seller is aware of (foundation, flood, title, zoning, code violations)?
- Is there a deadline driving the sale (1031 exchange, divorce, estate, relocation)? That informs how much negotiation room exists.
- Schools are F-rated, which usually means shorter tenancies and higher turnover. Who's the typical renter profile here, and what's been the actual vacancy rate?
- Crime grade is F in this area — have there been break-ins, vandalism, or insurance claims at this property in the last 3 years? What carrier currently insures it and at what premium?
- The area grade is low — what's the realistic commute time and amenity access for the typical tenant pool here? Any planned neighborhood developments (good or bad) we should know about?
- What's the average days-on-market for RENTAL listings here right now (not sales)? A rising rental-DOM trend means longer vacancies and softer asking-rent achievability than the comps imply.
- What's the recent tenant-quality profile in this submarket — average credit score on applications, eviction rate, late-payment / NSF rate, and stable-employment percentage? A property-management company in the area should have these aggregated.
- How much new for-sale + rental construction is in the pipeline within 1–3 miles? Heavy new supply typically softens prices + rents 12–24 months out; constrained supply supports both.
Investment metrics
- 1% rule
- 0.76% ✗
- Cap rate
- 5.75%
- Cash-on-cash
- -1.94%
- DSCR
- 0.91
- GRM
- 11.0
CMA / ARV
- ARV (median comp)
- $109,703
- List price
- $162,900
- Delta
- 48.49%
- Verdict
- OVERPRICED
- Comps
- 20 within 1.0 mi
Show comp detail 12 sales within ~0.75 mi
| Address | Dist | Beds/Ba | Sqft | Sold | Price | $/sf | Match |
|---|---|---|---|---|---|---|---|
| 531 W Beardsley Ave | 0.43mi | 2/2.0 | 1,596 (+6%) | 3mo | $125,000 | $78 | 64 |
| 182 S Shore Dr | 0.67mi | 3/2.0 (+1) | 1,500 (-1%) | 1mo | $257,000 | $171 | 58 |
| 413 N Vine St | 0.63mi | 3/1.5 (+1) | 1,564 (+3%) | 0mo | $220,000 | $141 | 58 |
| 510 W Franklin St | 0.42mi | 2/1.0 | 1,703 (+13%) | 2mo | $105,000 | $62 | 57 |
| 505 N Vine St | 0.64mi | 3/2.0 (+1) | 1,550 (+2%) | 2mo | $205,000 | $132 | 55 |
| 915 Fulton St | 0.60mi | 3/1.0 (+1) | 1,418 (-6%) | 2mo | $90,000 | $63 | 55 |
| 329 E Simonton St | 0.67mi | 2/1.0 | 1,380 (-9%) | 0mo | $168,000 | $122 | 54 |
| 207 Myrtle St | 0.52mi | 3/1.5 (+1) | 1,676 (+11%) | 1mo | $250,000 | $149 | 50 |
| 300 Union St | 0.74mi | 3/1.0 (+1) | 1,589 (+5%) | 2mo | $60,000 | $38 | 50 |
| 501 N Ward St | 0.70mi | 3/1.0 (+1) | 1,387 (-8%) | 4mo | $69,000 | $50 | 45 |
| 1118 Cedar St | 0.73mi | 3/2.0 (+1) | 1,400 (-7%) | 5mo | $55,000 | $39 | 41 |
| 190 S Shore Dr | 0.67mi | 3/1.0 (+1) | 1,292 (-15%) | 2mo | $120,000 | $93 | 38 |
Match score weights: distance 35% · size 25% · config 20% · recency 20%. Top-matched comps best support the ARV.
Projected returns pro-forma
-3.0% appreciation · 3.0% rent growth · sell at horizon
- IRR
- -22.0%
- Equity multiple
- 0.24×
- Total profit
- $-34,623
- Equity at exit
- $24,289
- IRR
- -15.9%
- Equity multiple
- 0.11×
- Total profit
- $-40,720
- Equity at exit
- $14,085
Cash invested: $45,612 (down + closing). Projections, not guarantees.
Landlord ↔ Tenant lean methodology
- Overall (STATE)
- 90 Strongly Landlord-Friendly
- State Indiana
- 90 Strongly Landlord-Friendly · R+11
- County
- — inherits STATE
- City
- — inherits STATE
ZIP-level market 46516
- Active inventory
- 150
- Price-to-rent
- 11.0×
Monthly cashflow live
- Estimated rent
- $1,239 high interval (Pro) →
- Mortgage (P&I)
- −$854
- Tax from tax record
- −$130 /mo · $1,560/yr
- Insurance
- −$68
- Flood insurance flood zone
- −$56 /mo · $666/yr
- HOA
- −$0
- Vacancy / Maint / Mgmt
- −$260
- Net cashflow
- $-129
Break-even live
Sensitivity live
| Price | -10% $-37 | -5% $-83 | +0% $-129 | +5% $-175 | +10% $-221 |
|---|---|---|---|---|---|
| Rent | -10% $-227 | -5% $-178 | +0% $-129 | +5% $-80 | +10% $-31 |
| Rate | -1.0pp $-47 | -0.5pp $-88 | base $-129 | +0.5pp $-171 | +1.0pp $-214 |
UW: 25.0% down · 7.5% · 30yr · 1.5% tax · 5.0% vac · 8.0% maint · 8.0% mgmt
Financing live
Cash to close
- Down payment
- $40,725
- Closing costs
- $4,887
- Reserves months
- —
- Total cash needed
- —
Loan-product check · same deal, 3 products live
Conventional
25% down · 7.5% · 30yr
- Down + closing
- —
- Monthly P&I
- —
- Monthly cashflow
- —
- DSCR
- —
- Eligible?
- —
Personal DTI + credit; lowest rate.
DSCR
20% down · 8.5% · 30yr
- Down + closing
- —
- Monthly P&I
- —
- Monthly cashflow
- —
- DSCR
- —
- Eligible?
- —
No personal income docs; deal must DSCR.
Hard money
10% down · 12.0% · 12mo
- Down + closing
- —
- Monthly P&I
- —
- Monthly cashflow
- —
- DSCR
- —
- Eligible?
- —
Short-term bridge; refi at stabilization.
Rent comps 5 comps
| Address | Beds | Baths | Sqft | Rent | $/sqft | DOM | Units | Dist |
|---|---|---|---|---|---|---|---|---|
| 209 S 2nd St Unit B Elkhart, IN | 1.0 | 1.0 | 1200 | $1,100 | $0.92 | 45d | 1 | 0.27mi |
| 660 Stamp Dr Elkhart, IN | 2.0 | 1.0 | 1120 | $1,250 | $1.12 | 23d | 1 | 0.50mi |
| 200 Jr. Achievement Dr Elkhart, IN | 1.0–2.0 | 1.0–2.0 | 946 | $1,770 | $1.87 | 23d | 10 | 0.59mi |
| 1023 Cone St Elkhart, IN | 2.0 | 1.0 | 1112 | $1,200 | $1.08 | 46d | 1 | 0.69mi |
| 1568 W Franklin St Elkhart, IN | 3.0 | 2.0 | 1486 | $1,600 | $1.08 | 23d | 1 | 1.21mi |
Listing history 22 events
-
2026-06-10status $162,900 Pending 69 DOM
-
2026-06-09days on market $162,900 Active 69 DOM
-
2026-06-08days on market $162,900 Active 68 DOM
-
2026-06-07days on market $162,900 Active 67 DOM
-
2026-06-05days on market $162,900 Active 64 DOM
-
2026-06-03days on market $162,900 Active 63 DOM
-
2026-06-02days on market $162,900 Active 62 DOM
-
2026-06-01days on market $162,900 Active 61 DOM
-
2026-05-31days on market $162,900 Active 60 DOM
-
2026-05-30days on market $162,900 Active 59 DOM
-
2026-04-01$162,900 Active 423-char remark
Show marketing remark (423 chars)
Just minutes from downtown Elkhart’s Riverwalk, dining, shopping, parks, and the Aquatic Center, this updated 4-bedroom, 2-bath home offers both convenience and comfort. Featuring all new flooring, fresh paint throughout, and a newer kitchen with stainless steel appliances included. Opportunity awaits with an additional 41x160 adjacent lot to the east available for purchase. Don’t miss your chance to see it!
-
2025-10-30price $165,900
-
2025-09-22price $169,900
-
2025-09-03$174,900 Active
-
2025-08-23status Active
-
2025-08-23historical
-
2025-08-15price $179,900
-
2025-02-28status Active
-
2024-08-24$185,000 Active
-
2001-11-09soldstatus $31,500
-
2001-10-22soldstatus $48,000
-
2001-09-14soldstatus $52,000
ⓘ Source: listings_history table (triggers on properties + properties_extension) + one-shot
backfill from property_details.listing_events for pre-trigger history.
Tax reassessment forecast IN · Partial reset (capped growth)
- Current annual tax
- $1,560 · $130/mo
- Projected year-2 tax
- $1,560 · $130/mo
- Expected delta
- $0/yr ($0/mo · 0.0%)
ⓘ Screening estimate from a state-policy table — verify with the county assessor before closing.
Climate risk First Street
- Flood 10/10 Extreme FEMA zone X (shaded) · 99% chance over 30 yrs
- Wildfire 1/10 Low
- Heat 3/10 Moderate 7 d/yr ≥101°F today · 16 d/yr by 30 yrs out
- Wind 2/10 Low
- Air quality 3/10 Moderate 2 unhealthy d/yr today · 3 by 30 yrs out
Nearby sold comps map
Loading sold comps map…
Walkable amenities ~0.75 mi
Loading nearby amenities…
Taxation est. · year 1
- Rental income
- $14,862
- − Mortgage interest
- −$9,125
- − Property taxes
- −$1,560
- − Insurance
- −$1,481
- − Repairs & maintenance
- −$1,189
- − Management
- −$1,189
- − Depreciation
- −$4,739
- Taxable loss
- −$4,421
- Est. tax savings @ 24.0%
- +$1,061
- After-tax cash flow
- $-490/yr
For passive investors: Depreciation is non-cash, so a rental often shows a tax loss while cash-flowing — sheltering income. Rental losses are passive: they offset passive income freely, and up to $25,000/yr can offset ordinary (W-2) income if you actively participate and your MAGI is under $100k (phasing out to $0 by $150k); unused losses carry forward. On sale, claimed depreciation is recaptured at up to 25%, and gains may owe capital-gains tax (a 1031 exchange can defer both). Figures are a year-1 estimate at your 24.0% rate — not tax advice; consult a CPA.
Schools (NCES district)
- District
- Elkhart Community Schools
- NCES district ID
- 1803270
- Math proficiency
- 18% ▼ -12.00%
- Reading proficiency
- 25% ▼ -9.00%
- Median HH income
- $42,881
- Composite
- 18.45/100
- National rank
- #8928
- State rank
- #271 of 301 in IN
Livability — Elkhart
- Score
- 68/100
- State rank
- #224
- US rank
- #9852
Category grades
Schools grade is shown separately in the Schools card above.
Census & demographics
- Census place
- Elkhart, IN
- County
- Elkhart County · 107,928 people
- City population
- 74,260
- Metro
- Elkhart-Goshen, IN
- Population (ZIP)
- 31,871
- Household income
- $56,492
- Rent vs Own
- Severe rent burden
- 995.0
Population outlook (Elkhart County) Hauer SSP2
- Today (2025)
- 213,761 people
- By 2030
- 218,103 · +2.0%
- By 2040
- 225,381 · +5.4%
- By 2050
- 229,447 · +7.3%
- By 2075
- 232,856 · +8.9%
- By 2100
- 214,088 · +0.2%
Race, ethnicity, and origin ACS 2023
- Neighborhood character
- Diverse neighborhood (Simpson 0.56)
- Race & ethnicity
- White 60% Hispanic / Latino 26% Black 9% Two or more races 8% Asian 1%
- Hispanic origin (detail)
- Mexican 15%
- Common ancestry
- Romanian 2% Iranian 2% Lithuanian 2%
- Foreign-born
- 15% · Canada
- Languages at home
- 77% English-only · Spanish 19% Other Indo-European 3%
Political lean MEDSL · Elkhart
- 2024 margin
- Solid R (+32.4) · D 33.1% · R 65.5% · Other 1.4%
- 2008→2024 swing
- -21.2pp toward R · 2008: -11.2pp · 2024: -32.4pp
- All cycles
- 2024: R+32.4 2020: R+28.1 2016: R+32.4 2012: R+26.5 2008: R+11.2
Not yet ingested
- Civics
- —
Market trends
- HPI YoY
- ▼ -233.42%
- Current HPI
- 239.2508
- Rent YoY
- —
- Metro
- Elkhart-Goshen, IN
- State GDP YoY
- ▲ 2.90%
- F500 in state
- 18
Industry mix (Fortune 500 HQ in IN)
| Industry | F500 HQs | Revenue |
|---|---|---|
| Industrial Machinery | 2 | $37B |
|
||
| Healthcare | 1 | $177B |
|
||
| Pharmaceuticals | 1 | $45B |
|
||
| Metals / Steel | 1 | $18B |
|
||
| Agriculture | 1 | $17B |
|
||
| Packaging | 1 | $12B |
|
||
Price history
+213.3% since first listed12 events — show timeline
- 2026-04-01 Listed $162,900 IRMLS
- 2025-10-30 Price Changed $165,900 IRMLS
- 2025-09-22 Price Changed $169,900 IRMLS
- 2025-09-03 Listed $174,900 IRMLS
- 2025-08-23 Relisted — IRMLS
- 2025-08-23 Delisted — IRMLS
- 2025-08-15 Price Changed $179,900 IRMLS
- 2025-02-28 Relisted — IRMLS
- 2024-08-24 Listed $185,000 IRMLS
- 2001-11-09 Sold (Public Records) $31,500 Public Records
- 2001-10-22 Sold (Public Records) $48,000 Public Records
- 2001-09-14 Sold (Public Records) $52,000 Public Records
Property tax history
+3.2%/yrLatest (2025): $1,560 · +23.7% YoY. Source: county tax records.
Cash-flow waterfall
monthlySold comps — $/sqft
last 12 mo · ≤1 miLoading sold comps…