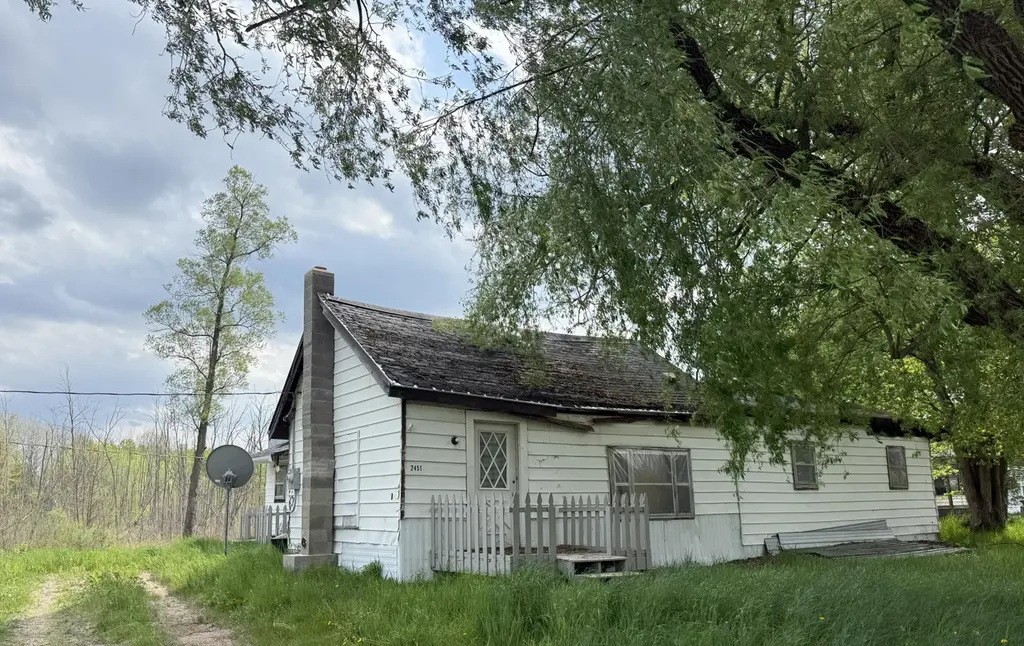
2451 US Highway 10 · Evart, MI
Flood risk 1/10 · Minimal
- FEMA flood zone
- —
- Chance of flooding over 30 yrs
- 0.0%
- Est. flood insurance / yr
- —
Fire risk 4/10 · Minor
- Est. fire insurance / yr
- $784 – $1,456
Heat risk 1/10 · Minimal
- Hot days now (above 94°F)
- 7 days/yr
- Hot days in 30 yrs
- 14 days/yr
Wind risk 1/10 · Minimal
- Chance of severe wind over 30 yrs
- —
Air-quality risk 2/10 · Minimal
- Unhealthy air days now
- 1 days/yr
- Unhealthy air days in 30 yrs
- 2 days/yr
Risk factors via First Street. Map © Google.
Why this score? — see what drove the B+ grade
The composite is a weighted blend of 9 inputs, each scored 0–100. Each bar is that input's sub-score; the figure is the points it added to the 100-point composite (weight × sub-score).
- Cash flow +30.0/30.0
- 1% rule +10.0/10.0
- DSCR +10.0/10.0
- Appreciation +10.0/10.0
- ARV discount +7.5/15.0
- Livability +3.6/5.0
- Rent growth +2.5/5.0
- Schools +2.5/10.0
- Condition / age +2.5/5.0
$45,000
🖨 Deal sheet 📄 Offer letter ✓ Due diligence
Listing remarks
Bring your rustic vision to life on this 2.5-acre parcel located directly on US-10 in Sears. The property features a house that needs significant work—ideal for a full renovation or potential tear-down, depending on your plans. Enjoy the quiet charm of a rural setting with easy road access. Perfect for investors, DIY enthusiasts, or anyone looking to create a peaceful homestead in the countryside. Great location, big potential—sold as-is.
Key facts
- 2.5-acre parcel
- Potential tear-down
- Full renovation
Tags
Neighborhood map
What this means for you Summary
Snapshot
- This is a 3-bed/1.0-bath single-family listed at $45k.
Deal economics
- At list price, monthly cash flow is $756 ($9k/yr) — positive.
- The deal already cash-flows at list — no discount required.
- Meets the 1% rule at list price ($1k rent vs $45k).
- Recommended offer: $40k (12.0% below list) — sets the bar for market timing.
- Cap rate 26.5% vs local median 3.4% in Evart — top-decile yield for the area; either an underpriced asset or a hidden risk that comps aren't pricing in. Stress-test before assuming the spread holds.
Location & tenants
- Location reads 72/100 on livability (#262 in MI) — a middle-class / working-renter tenant base. Strengths: cost of living A+, housing A+, health & safety A+; Watch: schools F, amenities F, commute F.
- Evart Public Schools (rural): math 27% / reading 34% proficiency, ranked #367 of 540 in MI (top 68%) — families likely to look elsewhere, expect single-tenant / working-renter base with shorter leases; 60% free/reduced lunch — lower-income household profile, screen leases tightly.
- Market conditions: 14 active listings in the ZIP; 5 units permitted in Osceola County in 2024 (0 in 5+ unit buildings).
Forward outlook
- In year one you build about $5k of equity ($311 loan paydown + $4k appreciation (10.0% local appreciation)).
- Osceola County population projected at -24% by 2050 — secular population decline; favor cash flow + early exit over multi-decade hold.
- At projected returns (10.0% appreciation + 3.0% rent growth), your $13k cash investment doubles in ~1 year — after that, you're playing with house money.
- By year 7, paydown + projected appreciation supports a ~$35k cash-out refi (75% LTV) — recoverable capital for the next deal without selling this one.
Negotiation context
- It's been on market 388 days — a 12% lower offer ($40k) is reasonable based on typical stale-listing flexibility.
- 5 sale attempts; this cycle's ask has dropped $15k (25%) from the opening price — seller is motivated, your offer sets the floor, not the list.
Questions for the listing agent
- It's been on market 388 days. Have you received any prior offers? Is the seller open to a 12% concession, seller financing, or rate buy-down credit?
- Why hasn't it sold? Are there any deal-killer items the seller is aware of (foundation, flood, title, zoning, code violations)?
- Is there a deadline driving the sale (1031 exchange, divorce, estate, relocation)? That informs how much negotiation room exists.
- Schools are F-rated, which usually means shorter tenancies and higher turnover. Who's the typical renter profile here, and what's been the actual vacancy rate?
- What's the average days-on-market for RENTAL listings here right now (not sales)? A rising rental-DOM trend means longer vacancies and softer asking-rent achievability than the comps imply.
- What's the recent tenant-quality profile in this submarket — average credit score on applications, eviction rate, late-payment / NSF rate, and stable-employment percentage? A property-management company in the area should have these aggregated.
- How much new for-sale + rental construction is in the pipeline within 1–3 miles? Heavy new supply typically softens prices + rents 12–24 months out; constrained supply supports both.
Investment metrics
- 1% rule
- 3.00% ✓
- Cap rate
- 26.46%
- Cash-on-cash
- 72.03%
- DSCR
- 4.20
- GRM
- 2.8
CMA / ARV
- ARV (median comp)
- $284,149
- List price
- $45,000
- Delta
- -84.16%
- Verdict
- UNDERPRICED
- Comps
- 1 within 2.0 mi
Projected returns pro-forma
10.0% appreciation · 3.0% rent growth · sell at horizon
- IRR
- 82.8%
- Equity multiple
- 6.77×
- Total profit
- $72,696
- Equity at exit
- $40,540
- IRR
- 77.2%
- Equity multiple
- 14.99×
- Total profit
- $176,240
- Equity at exit
- $87,425
Cash invested: $12,600 (down + closing). Projections, not guarantees.
Landlord ↔ Tenant lean methodology
- Overall (STATE)
- 62 Landlord-Friendly
- State Michigan
- 62 Landlord-Friendly · EVEN
- County
- — inherits STATE
- City
- — inherits STATE
ZIP-level market 49679
- Home prices YoY
- 5.4%
- Active inventory
- 14
- Price-to-rent
- 2.8×
Monthly cashflow live
- Estimated rent
- $1,351 medium interval (Pro) →
- Mortgage (P&I)
- −$236
- Tax est. 1.5%
- −$56 /mo · $675/yr
- Insurance
- −$19
- HOA
- −$0
- Vacancy / Maint / Mgmt
- −$284
- Net cashflow
- $756
Break-even live
UW: 25.0% down · 7.5% · 30yr · 1.5% tax · 5.0% vac · 8.0% maint · 8.0% mgmt
Financing live
Cash to close
- Down payment
- $11,250
- Closing costs
- $1,350
- Reserves months
- —
- Total cash needed
- —
Loan-product check · same deal, 3 products live
Conventional
25% down · 7.5% · 30yr
- Down + closing
- —
- Monthly P&I
- —
- Monthly cashflow
- —
- DSCR
- —
- Eligible?
- —
Personal DTI + credit; lowest rate.
DSCR
20% down · 8.5% · 30yr
- Down + closing
- —
- Monthly P&I
- —
- Monthly cashflow
- —
- DSCR
- —
- Eligible?
- —
No personal income docs; deal must DSCR.
Hard money
10% down · 12.0% · 12mo
- Down + closing
- —
- Monthly P&I
- —
- Monthly cashflow
- —
- DSCR
- —
- Eligible?
- —
Short-term bridge; refi at stabilization.
Listing history 35 events
-
2026-06-19days on market $45,000 Active 388 DOM
-
2026-06-18days on market $45,000 Active 387 DOM
-
2026-06-17days on market $45,000 Active 386 DOM
-
2026-06-16days on market $45,000 Active 385 DOM
-
2026-06-15days on market $45,000 Active 384 DOM
-
2026-06-14days on market $45,000 Active 382 DOM
-
2026-06-12days on market $45,000 Active 381 DOM
-
2026-06-09days on market $45,000 Active 378 DOM
-
2026-06-08days on market $45,000 Active 377 DOM
-
2026-06-07days on market $45,000 Active 376 DOM
-
2026-06-05days on market $45,000 Active 374 DOM
-
2026-06-04days on market $45,000 Active 372 DOM
-
2026-06-02days on market $45,000 Active 371 DOM
-
2026-06-01days on market $45,000 Active 370 DOM
-
2026-05-31days on market $45,000 Active 369 DOM
-
2026-05-31days on market $45,000 Active 368 DOM
-
2026-05-17historical
-
2026-05-16historical
-
2026-03-31status Active
-
2026-03-27historical
-
2025-11-18status Active
-
2025-11-18status Active
-
2025-11-17historical
-
2025-11-16historical
-
2025-08-01price $45,000
-
2025-07-31price $45,000
-
2025-07-31price $45,000
-
2025-06-24price $49,999
-
2025-06-24price $49,999
-
2025-06-24price $49,999
-
2025-05-30price $54,900
-
2025-05-29price $54,900
-
2025-05-29price $54,900
-
2025-05-16$60,000 Active
-
2025-05-16$60,000 Active
ⓘ Source: listings_history table (triggers on properties + properties_extension) + one-shot
backfill from property_details.listing_events for pre-trigger history.
Climate risk First Street
- Flood 1/10 Low 0% chance over 30 yrs
- Wildfire 4/10 Moderate
- Heat 1/10 Low 7 d/yr ≥94°F today · 14 d/yr by 30 yrs out
- Wind 1/10 Low
- Air quality 2/10 Low 1 unhealthy d/yr today · 2 by 30 yrs out
Nearby sold comps map
Loading sold comps map…
Walkable amenities ~0.75 mi
Loading nearby amenities…
Taxation est. · year 1
- Rental income
- $16,212
- − Mortgage interest
- −$2,521
- − Property taxes
- −$675
- − Insurance
- −$225
- − Repairs & maintenance
- −$1,297
- − Management
- −$1,297
- − Depreciation
- −$1,309
- Taxable income
- $8,888
- Est. tax owed @ 24.0%
- −$2,133
- After-tax cash flow
- $6,942/yr
For passive investors: Depreciation is non-cash, so a rental often shows a tax loss while cash-flowing — sheltering income. Rental losses are passive: they offset passive income freely, and up to $25,000/yr can offset ordinary (W-2) income if you actively participate and your MAGI is under $100k (phasing out to $0 by $150k); unused losses carry forward. On sale, claimed depreciation is recaptured at up to 25%, and gains may owe capital-gains tax (a 1031 exchange can defer both). Figures are a year-1 estimate at your 24.0% rate — not tax advice; consult a CPA.
Schools (NCES district)
- District
- Evart Public Schools
- NCES district ID
- 2613560
- Math proficiency
- 27% ▲ 2.00%
- Reading proficiency
- 34% ▬ 0.00%
- Median HH income
- $37,734
- Composite
- 25.42/100
- National rank
- #7455
- State rank
- #367 of 540 in MI
Livability — Evart
- Score
- 72/100
- State rank
- #262
- US rank
- #6440
Category grades
Schools grade is shown separately in the Schools card above.
Census & demographics
- Population (ZIP)
- 1,332
Population outlook (Osceola County) Hauer SSP2
- Today (2025)
- 21,724 people
- By 2030
- 20,769 · -4.4%
- By 2040
- 18,720 · -13.8%
- By 2050
- 16,611 · -23.5%
- By 2075
- 11,942 · -45.0%
- By 2100
- 7,546 · -65.3%
Race, ethnicity, and origin ACS 2023
- Neighborhood character
- Predominantly White (90%)
- Race & ethnicity
- White 90% Two or more races 4% Black 3% Hispanic / Latino 3%
- Common ancestry
- Romanian 3% Iranian 2% Lithuanian 2%
- Foreign-born
- 0%
- Languages at home
- 88% English-only · German/W. Germanic 10% Spanish 2%
Political lean MEDSL · Osceola
- 2024 margin
- Solid R (+47.9) · D 25.2% · R 73.1% · Other 1.7%
- 2008→2024 swing
- -37.7pp toward R · 2008: -10.1pp · 2024: -47.9pp
- All cycles
- 2024: R+47.9 2020: R+46.3 2016: R+43.7 2012: R+21.0 2008: R+10.1
Not yet ingested
- Civics
- —
Market trends
- HPI YoY
- ▲ 14.14%
- Current HPI
- 277.4887
- Rent YoY
- —
- Metro
- —
- State GDP YoY
- ▲ 1.37%
- F500 in state
- 28
Industry mix (Fortune 500 HQ in MI)
| Industry | F500 HQs | Revenue |
|---|---|---|
| Automotive Parts | 3 | $48B |
|
||
| Automotive | 2 | $372B |
|
||
| Chemicals | 1 | $45B |
|
||
| Automotive Retail | 1 | $29B |
|
||
| Healthcare / Medical Devices | 1 | $23B |
|
||
| Automotive Technology | 1 | $20B |
|
||
Price history
-25.0% since first listed19 events — show timeline
- 2026-05-17 Listing Removed — MiRealSource-MiMLS
- 2026-05-16 Listing Removed — REALCOMP
- 2026-03-31 Relisted — REALCOMP
- 2026-03-27 Listing Removed — REALCOMP
- 2025-11-18 Relisted — REALCOMP
- 2025-11-18 Relisted — MiRealSource-MiMLS
- 2025-11-17 Listing Removed — MiRealSource-MiMLS
- 2025-11-16 Listing Removed — REALCOMP
- 2025-08-01 Price Changed $45,000 MiRealSource-MiMLS
- 2025-07-31 Price Changed $45,000 REALCOMP
- 2025-07-31 Price Changed $45,000 SW Michigan MLS
- 2025-06-24 Price Changed $49,999 MiRealSource-MiMLS
- 2025-06-24 Price Changed $49,999 REALCOMP
- 2025-06-24 Price Changed $49,999 SW Michigan MLS
- 2025-05-30 Price Changed $54,900 MiRealSource-MiMLS
- 2025-05-29 Price Changed $54,900 REALCOMP
- 2025-05-29 Price Changed $54,900 SW Michigan MLS
- 2025-05-16 Listed $60,000 REALCOMP
- 2025-05-16 Listed $60,000 MiRealSource-MiMLS
Cash-flow waterfall
monthlySold comps — $/sqft
last 12 mo · ≤1 miLoading sold comps…