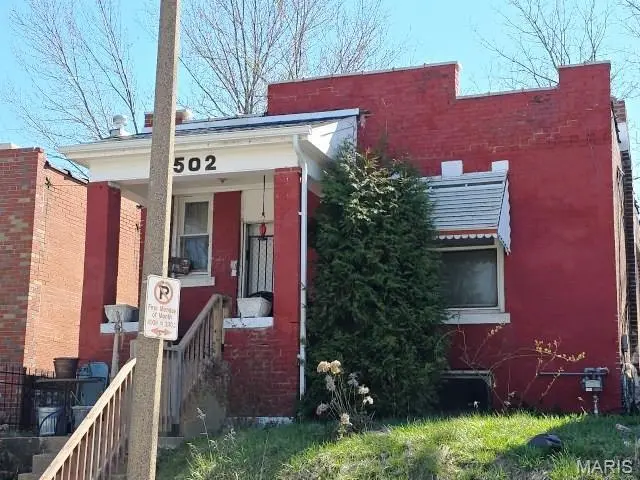
3502 Cora Ave · St. Louis, MO
Flood risk 1/10 · Minimal
- FEMA flood zone
- X (unshaded)
- Chance of flooding over 30 yrs
- 0.0%
- Est. flood insurance / yr
- $473 – $860
Fire risk 1/10 · Minimal
- Est. fire insurance / yr
- $1,054 – $1,958
Heat risk 5/10 · Moderate
- Hot days now (above 107°F)
- 7 days/yr
- Hot days in 30 yrs
- 21 days/yr
Wind risk 2/10 · Minimal
- Chance of severe wind over 30 yrs
- 1.0%
Air-quality risk 4/10 · Minor
- Unhealthy air days now
- 5 days/yr
- Unhealthy air days in 30 yrs
- 6 days/yr
Risk factors via First Street. Map © Google.
Why this score? — see what drove the B- grade
The composite is a weighted blend of 9 inputs, each scored 0–100. Each bar is that input's sub-score; the figure is the points it added to the 100-point composite (weight × sub-score).
- Cash flow +30.0/30.0
- DSCR +10.0/10.0
- 1% rule +9.2/10.0
- ARV discount +7.5/15.0
- Appreciation +3.3/10.0
- Rent growth +2.5/5.0
- Livability +2.5/5.0
- Condition / age +2.5/5.0
- Schools +1.2/10.0
$71,000
🖨 Deal sheet 📄 Offer letter ✓ Due diligence
Listing remarks
Brick bungalow with a covered front porch and fenced back yard. Full brick, tax records reflect two bedrooms and one bathroom. Unable to access the interior of the house. No interior access to the property. Seller is sellingthe property occupied, no interior access for viewing. Please do not go on the property. OCCUPIED, SOLD-AS IS/ WHERE IS with NOACCESS TO PROPERTY, DO NOT DISTURB OCCUPANTS. It is a criminal offense to trespass on this property. Buyer agrees to take theproperty AS-IS including indemnifying the seller related to any occupancy related title exceptions.
Key facts
- Covered front porch
- Full brick
- Fenced back yard
Tags
Property features AI
Finance
- Financial info: Lease not considered; Second mortgage not indicated; Property listed at auction
Exterior
- Utilities: Public water; Public sewer; Electric service: Ameren
- Home design: Single-family residence; One level
- Construction: Brick construction
- Exterior features: City lot
Interior
- Bedrooms: 2 bedrooms on the main level
- Bathrooms: 1 full bathroom on the main level
- Heating & cooling: No heating listed; Cooling described as Other
- Interior features: Full basement
Neighborhood map
What this means for you Summary
Snapshot
- This is a 2-bed/1.0-bath single-family listed at $71k.
Deal economics
- At list price, monthly cash flow is $372 ($4k/yr) — positive.
- The deal already cash-flows at list — no discount required.
- Meets the 1% rule at list price ($1k rent vs $71k).
- Recommended offer: $69k (3.0% below list) — sets the bar for market timing.
- Cap rate 12.6% vs local median 5.0% in St. Louis — top-decile yield for the area; either an underpriced asset or a hidden risk that comps aren't pricing in. Stress-test before assuming the spread holds.
Location & tenants
- Location reads: area grade B — affects rentability + tenant quality, not the cash-flow math above.
- St. Louis City (urban): math 10% / reading 18% proficiency, ranked #312 of 324 in MO (top 96%) — low school quality limits family demand, transient renter base, plan for 1-2y turnover; 80% free/reduced lunch — lower-income household profile, screen leases tightly.
- Zoned schools: Hickey Elem. (math 2% / reading 8%, grade F, #1,072 of 1,115 statewide, top 98%, 273 students, 99% FRL); Sumner High (math 2% / reading 2%, grade F, #520 of 521 statewide, top 100%, 264 students, 99% FRL) — zoned schools average 99% FRL vs 80% district-wide (18 pts higher); higher-poverty schools than district average — tighter screening recommended.
- Market conditions: 97 active listings in the ZIP; 23 comparable units currently listed for rent nearby; rentals lingering (median 44d on market — plan ~5-8 weeks vacancy on turnover, expect pricing pressure); 57% of comp listings sitting > 30 days — soft ceiling on asking rent; lower-income renter base — watch delinquency; 294 units permitted in St. Louis city in 2024 (227 in 5+ unit buildings).
- This rent runs 39% of the median local income ($31k/yr) — at the standard rent-burdened threshold; future hikes will face affordability resistance.
Forward outlook
- Local home prices are declining (-3.0%/yr); year-one equity from $491 of loan paydown is wiped out by about $2k of value loss. Plan a longer hold.
- St. Louis County population projected to shrink 6% by 2050 — rents likely to lag national; underwrite the cash flow, not the appreciation.
- At projected returns (-3.0% appreciation + 3.0% rent growth), your $20k cash investment doubles in ~6 years — after that, you're playing with house money.
Negotiation context
- It's been on market 43 days — a 3% lower offer ($69k) is reasonable based on typical stale-listing flexibility.
- Current owner paid $45k; list at $71k implies a 58% gain — meaningful room to come down on a strong offer.
Risks & watch-outs
- Watch-outs: built in 1917 — expect roof / HVAC / electrical / plumbing capex.
- Climate carrying-cost: extreme-heat days projected 7→21/yr by 2055 (HVAC capex compounding) — expect insurance premiums to compound above CPI over the hold.
Questions for the listing agent
- It's been on market 43 days. Have you received any prior offers? Is the seller open to a 3% concession, seller financing, or rate buy-down credit?
- Built in 1917 — when were the roof, HVAC, electrical panel, plumbing, and water heater last replaced?
- Is there a deadline driving the sale (1031 exchange, divorce, estate, relocation)? That informs how much negotiation room exists.
- What's the average days-on-market for RENTAL listings here right now (not sales)? A rising rental-DOM trend means longer vacancies and softer asking-rent achievability than the comps imply.
- What's the recent tenant-quality profile in this submarket — average credit score on applications, eviction rate, late-payment / NSF rate, and stable-employment percentage? A property-management company in the area should have these aggregated.
- How much new for-sale + rental construction is in the pipeline within 1–3 miles? Heavy new supply typically softens prices + rents 12–24 months out; constrained supply supports both.
Investment metrics
- 1% rule
- 1.42% ✓
- Cap rate
- 12.58%
- Cash-on-cash
- 22.45%
- DSCR
- 2.00
- GRM
- 5.9
CMA / ARV
- ARV (median comp)
- $36,255
- List price
- $71,000
- Delta
- 95.83%
- Verdict
- OVERPRICED
- Comps
- 20 within 1.0 mi
Show comp detail 12 sales within ~0.75 mi
| Address | Dist | Beds/Ba | Sqft | Sold | Price | $/sf | Match |
|---|---|---|---|---|---|---|---|
| 4729 Margaretta Ave | 0.39mi | 2/1.0 | 982 (-5%) | 2mo | $9,900 | $10 | 72 |
| 4610 Lexington Ave | 0.06mi | 3/1.5 (+1) | 945 (-9%) | 8mo | $35,000 | $37 | 69 |
| 4533 Lexington Ave | 0.15mi | 3/1.0 (+1) | 1,175 (+14%) | 3mo | $105,900 | $90 | 63 |
| 4610 Penrose St | 0.57mi | 3/1.5 (+1) | 1,053 (+2%) | 3mo | $80,000 | $76 | 61 |
| 4853 Lee Ave | 0.62mi | 2/1.0 | 1,092 (+6%) | 3mo | $29,900 | $27 | 60 |
| 4650 Saint Louis Ave | 0.31mi | 2/1.0 | 902 (-13%) | 10mo | $20,000 | $22 | 56 |
| 4416 San Francisco Ave | 0.40mi | 2/1.5 | 1,167 (+13%) | 6mo | $29,900 | $26 | 53 |
| 4275 E Ashland Ave | 0.65mi | 2/1.0 | 938 (-9%) | 2mo | $99,900 | $107 | 53 |
| 4400 San Francisco Ave | 0.43mi | 2/1.0 | 1,167 (+13%) | 8mo | $7,000 | $6 | 53 |
| 4547 Bessie Ave | 0.66mi | 2/1.0 | 906 (-12%) | 4mo | $39,500 | $44 | 46 |
| 4607 Lee Ave | 0.53mi | 3/1.5 (+1) | 912 (-12%) | 4mo | $25,000 | $27 | 46 |
| 4843 Lee Ave | 0.61mi | 3/1.0 (+1) | 1,170 (+13%) | 2mo | $71,500 | $61 | 44 |
Match score weights: distance 35% · size 25% · config 20% · recency 20%. Top-matched comps best support the ARV.
Projected returns pro-forma
-3.0% appreciation · 3.0% rent growth · sell at horizon
- IRR
- 15.2%
- Equity multiple
- 1.61×
- Total profit
- $12,160
- Equity at exit
- $10,586
- IRR
- 23.9%
- Equity multiple
- 3.06×
- Total profit
- $40,987
- Equity at exit
- $6,139
Cash invested: $19,880 (down + closing). Projections, not guarantees.
Landlord ↔ Tenant lean methodology
- Overall (STATE)
- 81 Strongly Landlord-Friendly
- State Missouri
- 81 Strongly Landlord-Friendly · R+10
- County
- — inherits STATE
- City
- — inherits STATE
ZIP-level market 63115
- Home prices YoY
- -2.6%
- Active inventory
- 97
- Price-to-rent
- 5.9×
Monthly cashflow live
- Estimated rent
- $1,006 high interval (Pro) →
- Mortgage (P&I)
- −$372
- Tax from tax record
- −$21 /mo · $251/yr
- Insurance
- −$30
- HOA
- −$0
- Vacancy / Maint / Mgmt
- −$211
- Net cashflow
- $372
Break-even live
UW: 25.0% down · 7.5% · 30yr · 1.5% tax · 5.0% vac · 8.0% maint · 8.0% mgmt
Financing live
Cash to close
- Down payment
- $17,750
- Closing costs
- $2,130
- Reserves months
- —
- Total cash needed
- —
Loan-product check · same deal, 3 products live
Conventional
25% down · 7.5% · 30yr
- Down + closing
- —
- Monthly P&I
- —
- Monthly cashflow
- —
- DSCR
- —
- Eligible?
- —
Personal DTI + credit; lowest rate.
DSCR
20% down · 8.5% · 30yr
- Down + closing
- —
- Monthly P&I
- —
- Monthly cashflow
- —
- DSCR
- —
- Eligible?
- —
No personal income docs; deal must DSCR.
Hard money
10% down · 12.0% · 12mo
- Down + closing
- —
- Monthly P&I
- —
- Monthly cashflow
- —
- DSCR
- —
- Eligible?
- —
Short-term bridge; refi at stabilization.
Rent comps 23 comps
| Address | Beds | Baths | Sqft | Rent | $/sqft | DOM | Units | Dist |
|---|---|---|---|---|---|---|---|---|
| 4627 Maffitt Ave Saint Louis, MO | 2.0 | 1.0 | 704 | $795 | $1.13 | 43d | 1 | 0.32mi |
| 4642 Farlin Ave Unit 1F St. Louis, MO | 2.0 | 1.0 | 1056 | $800 | $0.76 | 43d | 1 | 0.41mi |
| 4040 Shreve Ave Saint Louis, MO | 3.0 | 1.0 | 1201 | $1,250 | $1.04 | 43d | 1 | 0.49mi |
| 4497 Lee Ave Saint Louis, MO | 3.0 | 2.0 | 1012 | $1,000 | $0.99 | 16d | 1 | 0.60mi |
| 4493 Bessie Ave Saint Louis, MO | 3.0 | 1.0 | 880 | $1,250 | $1.42 | 43d | 1 | 0.71mi |
| 4847 Calvin Ave Saint Louis, MO | 3.0 | 2.0 | 1000 | $1,473 | $1.47 | 2d | 1 | 0.85mi |
| 4223 Red Bud Ave Unit 1F St. Louis, MO | 2.0 | 1.0 | 1167 | $895 | $0.77 | 43d | 1 | 0.93mi |
| 2603 Belle Glade Ave Saint Louis, MO | 2.0 | 1.0 | 945 | $800 | $0.85 | 4d | 1 | 0.96mi |
| 4426 Holly Ave Unit B St. Louis, MO | 2.0 | 1.0 | 1000 | $1,100 | $1.10 | 14d | 1 | 1.00mi |
| 1708 Annie Malone Dr Saint Louis, MO | 3.0 | 1.5 | 924 | $1,500 | $1.62 | 43d | 1 | 1.03mi |
| 4460 Bircher Blvd Saint Louis, MO | 1.0 | 1.0 | 1100 | $725 | $0.66 | 10d | 1 | 1.06mi |
| 1232 N Euclid Ave Saint Louis, MO | 3.0 | 1.5 | 982 | $1,395 | $1.42 | 43d | 1 | 1.14mi |
| 2831 Abner Pl Unit 7 St. Louis, MO | 2.0 | 1.0 | 968 | $1,250 | $1.29 | 23d | 1 | 1.15mi |
| 4919 Thekla Ave Saint Louis, MO | 2.0 | 1.0 | 931 | $700 | $0.75 | 43d | 1 | 1.20mi |
| 5333 Patton Ave St. Louis, MO | 3.0 | 1.5 | 1262 | $1,250 | $0.99 | 43d | 1 | 1.27mi |
| 1965 Arlington Ave Saint Louis, MO | 3.0 | 1.0 | 980 | $1,300 | $1.33 | 4d | 1 | 1.31mi |
| 1324 Academy Ave Unit C St. Louis, MO | 1.0 | 1.0 | 1000 | $890 | $0.89 | 43d | 1 | 1.34mi |
| 3819 Kossuth Ave Saint Louis, MO | 1.0 | 1.5 | 816 | $725 | $0.89 | 23d | 1 | 1.37mi |
| 763 Walton Ave Unit 763 St. Louis, MO | 2.0 | 1.0 | 1100 | $1,100 | $1.00 | 43d | 1 | 1.39mi |
| 1420 Union Blvd Unit 2F St. Louis, MO | 2.0 | 1.0 | 1096 | $995 | $0.91 | 43d | 1 | 1.42mi |
| 4908 W Florissant Ave Apt A St. Louis, MO | 1.0 | 1.0 | 750 | $695 | $0.93 | 43d | 1 | 1.43mi |
| 5345 Wells Ave Unit 2ND St. Louis, MO | 3.0 | 1.0 | 1127 | $1,095 | $0.97 | 23d | 1 | 1.45mi |
| 5203 Page Blvd Unit 5201 1st Floor St. Louis, MO | 2.0 | 1.0 | 1000 | $750 | $0.75 | 14d | 1 | 1.48mi |
Listing history 18 events
-
2026-06-18days on market $71,000 Active 43 DOM
-
2026-06-17days on market $71,000 Active 42 DOM
-
2026-06-16days on market $71,000 Active 41 DOM
-
2026-06-15days on market $71,000 Active 40 DOM
-
2026-06-13days on market $71,000 Active 38 DOM
-
2026-06-09days on market $71,000 Active 34 DOM
-
2026-06-08days on market $71,000 Active 33 DOM
-
2026-06-07days on market $71,000 Active 32 DOM
-
2026-06-05days on market $71,000 Active 29 DOM
-
2026-06-03days on market $71,000 Active 28 DOM
-
2026-06-02days on market $71,000 Active 27 DOM
-
2026-06-01days on market $71,000 Active 26 DOM
-
2026-05-31days on market $71,000 Active 25 DOM
-
2026-05-06$76,000 Active 575-char remark
-
2002-09-10soldstatus $45,000
-
2000-09-27soldstatus
-
2000-04-10soldstatus
-
2000-04-10soldstatus
ⓘ Source: listings_history table (triggers on properties + properties_extension) + one-shot
backfill from property_details.listing_events for pre-trigger history.
Tax reassessment forecast MO · Resets to sale price
- Current annual tax
- $251 · $21/mo
- Projected year-2 tax
- $689 · $57/mo
- Expected delta
- +$438/yr (+$37/mo · 174.8%)
ⓘ Screening estimate from a state-policy table — verify with the county assessor before closing.
Climate risk First Street
- Flood 1/10 Low FEMA zone X (unshaded) · 0% chance over 30 yrs
- Wildfire 1/10 Low
- Heat 5/10 Major 7 d/yr ≥107°F today · 21 d/yr by 30 yrs out
- Wind 2/10 Low 100% chance of damaging wind over 30 yrs
- Air quality 4/10 Moderate 5 unhealthy d/yr today · 6 by 30 yrs out
Nearby sold comps map
Loading sold comps map…
Walkable amenities ~0.75 mi
Loading nearby amenities…
Taxation est. · year 1
- Rental income
- $12,073
- − Mortgage interest
- −$3,977
- − Property taxes
- −$251
- − Insurance
- −$355
- − Repairs & maintenance
- −$966
- − Management
- −$966
- − Depreciation
- −$2,065
- Taxable income
- $3,493
- Est. tax owed @ 24.0%
- −$838
- After-tax cash flow
- $3,625/yr
For passive investors: Depreciation is non-cash, so a rental often shows a tax loss while cash-flowing — sheltering income. Rental losses are passive: they offset passive income freely, and up to $25,000/yr can offset ordinary (W-2) income if you actively participate and your MAGI is under $100k (phasing out to $0 by $150k); unused losses carry forward. On sale, claimed depreciation is recaptured at up to 25%, and gains may owe capital-gains tax (a 1031 exchange can defer both). Figures are a year-1 estimate at your 24.0% rate — not tax advice; consult a CPA.
Schools (NCES district)
- District
- St. Louis City
- NCES district ID
- 2929280
- Math proficiency
- 10% ▼ -6.00%
- Reading proficiency
- 18% ▼ -3.00%
- Median HH income
- $35,685
- Composite
- 11.54/100
- National rank
- #9699
- State rank
- #312 of 324 in MO
Livability — St. Louis
No livability data for this city. (Only ~50 U.S. cities are tracked.)
Census & demographics
- Census place
- St. Louis, MO
- County
- Saint Louis City · 254,015 people
- City population
- 283,259
- Metro
- St. Louis, MO-IL
- Population (ZIP)
- 14,488
- Household income
- $30,622
- Rent vs Own
- Severe rent burden
- 1655.0
Population outlook (St. Louis County) Hauer SSP2
- Today (2025)
- 315,737 people
- By 2030
- 313,865 · -0.6%
- By 2040
- 305,439 · -3.3%
- By 2050
- 296,529 · -6.1%
- By 2075
- 271,028 · -14.2%
- By 2100
- 255,359 · -19.1%
Race, ethnicity, and origin ACS 2023
- Neighborhood character
- Predominantly Black (95%)
- Race & ethnicity
- Black 95% White 2% Two or more races 2%
- Foreign-born
- 0%
Political lean MEDSL · St. Louis
- 2024 margin
- Solid D (+64.7) · D 81.4% · R 16.7% · Other 2.0%
- 2008→2024 swing
- -3.5pp toward R · 2008: 68.2pp · 2024: 64.7pp
- All cycles
- 2024: D+64.7 2020: D+66.2 2016: D+63.7 2012: D+66.6 2008: D+68.2
Not yet ingested
- Civics
- —
Market trends
- HPI YoY
- ▼ -3.42%
- Current HPI
- 127.3403
- Rent YoY
- —
- Metro
- St. Louis, MO-IL
- State GDP YoY
- ▲ 1.84%
- F500 in state
- 20
Industry mix (Fortune 500 HQ in MO)
| Industry | F500 HQs | Revenue |
|---|---|---|
| Healthcare | 1 | $163B |
|
||
| Insurance | 1 | $21B |
|
||
| Industrial Technology | 1 | $17B |
|
||
| Retail | 1 | $16B |
|
||
| Industrial Distribution | 1 | $10B |
|
||
| Utilities | 1 | $9B |
|
||
Price history
+57.8% since first listed6 events — show timeline
- 2026-05-29 Price Changed $71,000 MARIS as Distributed by MLS Grid
- 2026-05-06 Listed $76,000 MARIS as Distributed by MLS Grid
- 2002-09-10 Sold (Public Records) $45,000 Public Records
- 2000-09-27 Sold (Public Records) — Public Records
- 2000-04-10 Sold (Public Records) — Public Records
- 2000-04-10 Sold (Public Records) — Public Records
Property tax history
-1.1%/yrLatest (2024): $251 · +4.6% YoY. Source: county tax records.
Cash-flow waterfall
monthlySold comps — $/sqft
last 12 mo · ≤1 miLoading sold comps…