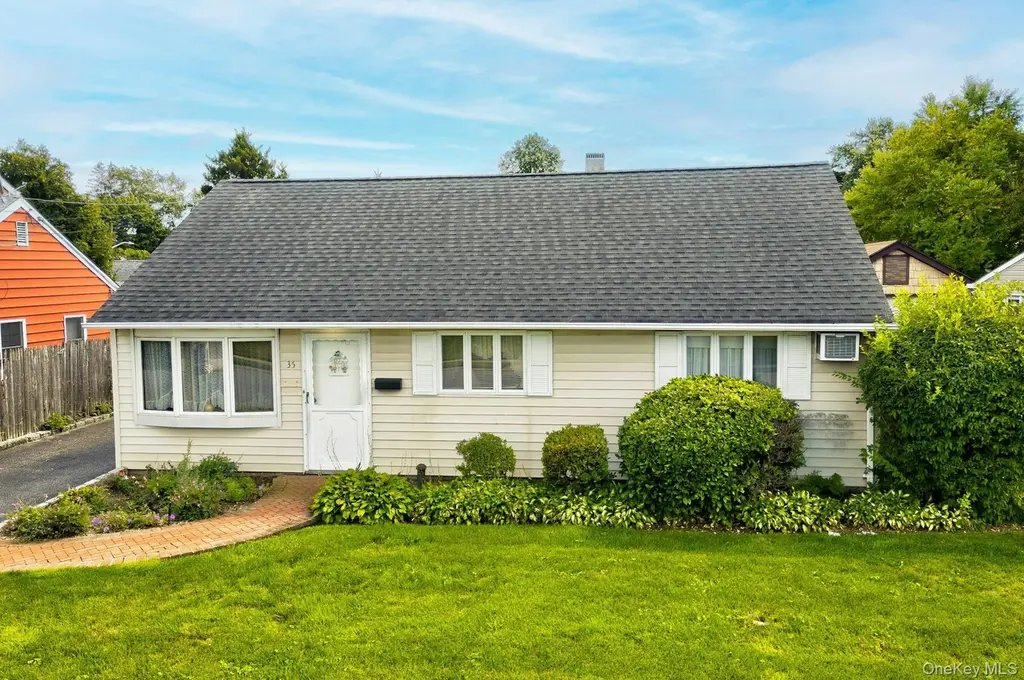
35 Vernon St · Plainview, NY
Flood risk 1/10 · Minimal
- FEMA flood zone
- X (unshaded)
- Chance of flooding over 30 yrs
- 0.0%
- Est. flood insurance / yr
- $507 – $1,088
Fire risk 1/10 · Minimal
- Est. fire insurance / yr
- $691 – $1,283
Heat risk 5/10 · Moderate
- Hot days now (above 95°F)
- 7 days/yr
- Hot days in 30 yrs
- 16 days/yr
Wind risk 6/10 · Moderate
- Chance of severe wind over 30 yrs
- 58.0%
Air-quality risk 4/10 · Minor
- Unhealthy air days now
- 5 days/yr
- Unhealthy air days in 30 yrs
- 7 days/yr
Risk factors via First Street. Map © Google.
Why this score? — see what drove the D- grade
The composite is a weighted blend of 9 inputs, each scored 0–100. Each bar is that input's sub-score; the figure is the points it added to the 100-point composite (weight × sub-score).
- ARV discount +15.0/15.0
- Schools +8.0/10.0
- Cash flow +5.5/30.0
- Livability +4.2/5.0
- Rent growth +2.5/5.0
- Condition / age +2.5/5.0
- 1% rule +0.7/10.0
- DSCR +0.0/10.0
- Appreciation +0.0/10.0
$828,000
🖨 Deal sheet 📄 Offer letter ✓ Due diligence
Listing remarks MLS
Welcome to 35 Vernon Street in Plainview, a charming and affordable ranch-style home in the desirable Plainview-Old Bethpage School District. This well-maintained residence offers 3 bedrooms, 1 full bath, a bright living room with a bay window, an eat-in kitchen, and a convenient laundry room—all on one level. Additional features include a full attic with pull-down stairs for storage, a private yard, inground sprinklers, a covered patio perfect for entertaining, and a detached 1.5-car garage with driveway parking. No basement. The home is equipped with oil heating (tank outside above grade), two through-wall air conditioning units, and is ideally located near schools, parks, shopping, and dining, with easy access to major roadways.
Key facts
- 5,400 sq ft lot
- Built 2026
- Listed 77 days
Neighborhood map
What this means for you Summary
Snapshot
- This is a 5-bed/1.0-bath single-family listed at $828k.
Deal economics
- At list price, monthly cash flow is $-2k ($-21k/yr) — negative.
- To cash-flow at today's rent, offer at most $515k (37.8% below list).
- To meet the 1% rule (rent ≥ 1% of price), the offer needs to be $469k (43.4% below list).
- Recommended offer: $469k (43.4% below list) — sets the bar for 1% rule.
- Cap rate 3.7% vs local median 2.7% in Plainview — top-decile yield for the area; either an underpriced asset or a hidden risk that comps aren't pricing in. Stress-test before assuming the spread holds.
Location & tenants
- Location reads 85/100 on livability (#36 in NY, #554 nationally) — a professional / high-income tenant draw. Strengths: schools A+, commute A+, employment A+; Watch: cost of living F.
- Plainview-Old Bethpage Central School District (suburban): math 88% / reading 86% proficiency, ranked #20 of 590 in NY (top 3%) — strong family-tenant draw, lease renewals of 3-5y typical; only 4% free/reduced lunch — higher-income household profile.
- Market conditions: 158 active listings in the ZIP; high-income renter base; 824 units permitted in Nassau County in 2024 (153 in 5+ unit buildings).
- This rent runs 30% of the median local income ($188k/yr) — at the standard rent-burdened threshold; future hikes will face affordability resistance.
Forward outlook
- Local home prices are declining (-3.0%/yr); year-one equity from $6k of loan paydown is wiped out by about $25k of value loss. Plan a longer hold.
- Nassau County population projected at +7% by 2050 — modest demand growth; plan on rents tracking national, not racing it.
Negotiation context
- It's been on market 77 days — a 6% lower offer ($778k) is reasonable based on typical stale-listing flexibility.
- 2 sale attempts with the ask held roughly flat each time — persistent listings suggest the price (not the market) is what's stuck; bring a comps-based counter.
- Current owner paid $610k; 36% above their basis — modest negotiation headroom, anchor on the comps not their cost.
Risks & watch-outs
- Climate carrying-cost: major wind risk, 58% chance of damaging wind over 30y; extreme-heat days projected 7→16/yr by 2055 (HVAC capex compounding) — expect insurance premiums to compound above CPI over the hold.
Questions for the listing agent
- What do current leases actually rent for vs. the listed asking? Can we see a recent rent roll and the last 12 months of T-12 income?
- It's been on market 77 days. Have you received any prior offers? Is the seller open to a 43% concession, seller financing, or rate buy-down credit?
- Why hasn't it sold? Are there any deal-killer items the seller is aware of (foundation, flood, title, zoning, code violations)?
- Is there a deadline driving the sale (1031 exchange, divorce, estate, relocation)? That informs how much negotiation room exists.
- Schools are A-rated — typically a magnet for longer-tenancy family renters. What's the average tenant stay here, and is there a school-zone premium baked into asking?
- The area grade is low — what's the realistic commute time and amenity access for the typical tenant pool here? Any planned neighborhood developments (good or bad) we should know about?
- What's the average days-on-market for RENTAL listings here right now (not sales)? A rising rental-DOM trend means longer vacancies and softer asking-rent achievability than the comps imply.
- What's the recent tenant-quality profile in this submarket — average credit score on applications, eviction rate, late-payment / NSF rate, and stable-employment percentage? A property-management company in the area should have these aggregated.
- How much new for-sale + rental construction is in the pipeline within 1–3 miles? Heavy new supply typically softens prices + rents 12–24 months out; constrained supply supports both.
Investment metrics
- 1% rule
- 0.57% ✗
- Cap rate
- 3.72%
- Cash-on-cash
- -9.18%
- DSCR
- 0.59
- GRM
- 14.7
CMA / ARV
- ARV (median comp)
- $1,271,500
- List price
- $828,000
- Delta
- -34.88%
- Verdict
- UNDERPRICED
- Comps
- 20 within 1.0 mi
Projected returns pro-forma
-3.0% appreciation · 3.0% rent growth · sell at horizon
- IRR
- -32.7%
- Equity multiple
- -0.07×
- Total profit
- $-247,178
- Equity at exit
- $123,457
- IRR
- -38.7%
- Equity multiple
- -0.56×
- Total profit
- $-360,971
- Equity at exit
- $71,590
Cash invested: $231,840 (down + closing). Projections, not guarantees.
Landlord ↔ Tenant lean methodology
- Overall (STATE)
- 15 Strongly Tenant-Friendly
- State New York
- 15 Strongly Tenant-Friendly · D+10
- County
- — inherits STATE
- City
- — inherits STATE
ZIP-level market 11803
- Active inventory
- 158
- Price-to-rent
- 14.7×
Monthly cashflow live
- Estimated rent
- $4,691 medium interval (Pro) →
- Mortgage (P&I)
- −$4,342
- Tax from tax record
- −$791 /mo · $9,497/yr
- Insurance
- −$345
- HOA
- −$0
- Vacancy / Maint / Mgmt
- −$985
- Net cashflow
- $-1,773
Break-even live
UW: 25.0% down · 7.5% · 30yr · 1.5% tax · 5.0% vac · 8.0% maint · 8.0% mgmt
Financing live
Cash to close
- Down payment
- $207,000
- Closing costs
- $24,840
- Reserves months
- —
- Total cash needed
- —
Loan-product check · same deal, 3 products live
Conventional
25% down · 7.5% · 30yr
- Down + closing
- —
- Monthly P&I
- —
- Monthly cashflow
- —
- DSCR
- —
- Eligible?
- —
Personal DTI + credit; lowest rate.
DSCR
20% down · 8.5% · 30yr
- Down + closing
- —
- Monthly P&I
- —
- Monthly cashflow
- —
- DSCR
- —
- Eligible?
- —
No personal income docs; deal must DSCR.
Hard money
10% down · 12.0% · 12mo
- Down + closing
- —
- Monthly P&I
- —
- Monthly cashflow
- —
- DSCR
- —
- Eligible?
- —
Short-term bridge; refi at stabilization.
Listing history 18 events
-
2026-06-18days on market $828,000 Active 77 DOM
-
2026-06-17days on market $828,000 Active 76 DOM
-
2026-06-16days on market $828,000 Active 75 DOM
-
2026-06-15days on market $828,000 Active 74 DOM
-
2026-06-13days on market $828,000 Active 72 DOM
-
2026-06-13days on market $828,000 Active 71 DOM
-
2026-06-09days on market $828,000 Active 68 DOM
-
2026-06-08days on market $828,000 Active 67 DOM
-
2026-06-07days on market $828,000 Active 66 DOM
-
2026-06-04days on market $828,000 Active 63 DOM
-
2026-06-03days on market $828,000 Active 62 DOM
-
2026-06-02days on market $828,000 Active 61 DOM
-
2026-06-01days on market $828,000 Active 60 DOM
-
2026-05-31days on market $828,000 Active 59 DOM
-
2026-03-18$828,000 Active
-
2025-12-03soldstatus $610,000 Closed 747-char remark
Show marketing remark (747 chars)
Welcome to 35 Vernon Street in Plainview, a charming and affordable ranch-style home in the desirable Plainview-Old Bethpage School District. This well-maintained residence offers 3 bedrooms, 1 full bath, a bright living room with a bay window, an eat-in kitchen, and a convenient laundry room—all on one level. Additional features include a full attic with pull-down stairs for storage, a private yard, inground sprinklers, a covered patio perfect for entertaining, and a detached 1.5-car garage with driveway parking. No basement. The home is equipped with oil heating (tank outside above grade), two through-wall air conditioning units, and is ideally located near schools, parks, shopping, and dining, with easy access to major roadways.
-
2025-10-02status Pending 747-char remark
Show marketing remark (747 chars)
Welcome to 35 Vernon Street in Plainview, a charming and affordable ranch-style home in the desirable Plainview-Old Bethpage School District. This well-maintained residence offers 3 bedrooms, 1 full bath, a bright living room with a bay window, an eat-in kitchen, and a convenient laundry room—all on one level. Additional features include a full attic with pull-down stairs for storage, a private yard, inground sprinklers, a covered patio perfect for entertaining, and a detached 1.5-car garage with driveway parking. No basement. The home is equipped with oil heating (tank outside above grade), two through-wall air conditioning units, and is ideally located near schools, parks, shopping, and dining, with easy access to major roadways.
-
2025-09-03$639,000 Active 747-char remark
Show marketing remark (747 chars)
Welcome to 35 Vernon Street in Plainview, a charming and affordable ranch-style home in the desirable Plainview-Old Bethpage School District. This well-maintained residence offers 3 bedrooms, 1 full bath, a bright living room with a bay window, an eat-in kitchen, and a convenient laundry room—all on one level. Additional features include a full attic with pull-down stairs for storage, a private yard, inground sprinklers, a covered patio perfect for entertaining, and a detached 1.5-car garage with driveway parking. No basement. The home is equipped with oil heating (tank outside above grade), two through-wall air conditioning units, and is ideally located near schools, parks, shopping, and dining, with easy access to major roadways.
ⓘ Source: listings_history table (triggers on properties + properties_extension) + one-shot
backfill from property_details.listing_events for pre-trigger history.
Tax reassessment forecast NY · Partial reset (capped growth)
- Current annual tax
- $9,497 · $791/mo
- Projected year-2 tax
- $11,745 · $979/mo
- Expected delta
- +$2,248/yr (+$187/mo · 23.7%)
ⓘ Screening estimate from a state-policy table — verify with the county assessor before closing.
Climate risk First Street
- Flood 1/10 Low FEMA zone X (unshaded) · 0% chance over 30 yrs
- Wildfire 1/10 Low
- Heat 5/10 Major 7 d/yr ≥95°F today · 16 d/yr by 30 yrs out
- Wind 6/10 Major 58% chance of damaging wind over 30 yrs
- Air quality 4/10 Moderate 5 unhealthy d/yr today · 7 by 30 yrs out
Nearby sold comps map
Loading sold comps map…
Walkable amenities ~0.75 mi
Loading nearby amenities…
Taxation est. · year 1
- Rental income
- $56,286
- − Mortgage interest
- −$46,381
- − Property taxes
- −$9,497
- − Insurance
- −$4,140
- − Repairs & maintenance
- −$4,503
- − Management
- −$4,503
- − Depreciation
- −$24,087
- Taxable loss
- −$36,825
- Est. tax savings @ 24.0%
- +$8,838
- After-tax cash flow
- $-12,439/yr
For passive investors: Depreciation is non-cash, so a rental often shows a tax loss while cash-flowing — sheltering income. Rental losses are passive: they offset passive income freely, and up to $25,000/yr can offset ordinary (W-2) income if you actively participate and your MAGI is under $100k (phasing out to $0 by $150k); unused losses carry forward. On sale, claimed depreciation is recaptured at up to 25%, and gains may owe capital-gains tax (a 1031 exchange can defer both). Figures are a year-1 estimate at your 24.0% rate — not tax advice; consult a CPA.
Schools (NCES district)
- District
- Plainview-Old Bethpage Central School District
- NCES district ID
- 3623220
- Math proficiency
- 88% ▲ 1.00%
- Reading proficiency
- 86% ▲ 7.00%
- Median HH income
- $122,932
- Composite
- 80.45/100
- National rank
- #47
- State rank
- #20 of 590 in NY
Livability — Plainview
- Score
- 85/100
- State rank
- #36
- US rank
- #554
Category grades
Schools grade is shown separately in the Schools card above.
Census & demographics
- Census place
- Plainview, NY
- County
- Nassau County · 653,051 people
- City population
- 29,713
- Metro
- New York-Newark-Jersey City, NY-NJ-PA
- Population (ZIP)
- 29,713
- Household income
- $187,514
- Rent vs Own
- Severe rent burden
- 169.0
Population outlook (Nassau County) Hauer SSP2
- Today (2025)
- 1,409,302 people
- By 2030
- 1,431,482 · +1.6%
- By 2040
- 1,471,607 · +4.4%
- By 2050
- 1,502,845 · +6.6%
- By 2075
- 1,575,403 · +11.8%
- By 2100
- 1,554,356 · +10.3%
Race, ethnicity, and origin ACS 2023
- Neighborhood character
- Predominantly White (74%)
- Race & ethnicity
- White 74% Asian 19% Hispanic / Latino 4% Two or more races 3%
- Common ancestry
- Romanian 10% Scotch-Irish 6% Italian 2%
- Foreign-born
- 16% · China, South Korea, Canada
- Languages at home
- 81% English-only · Other Indo-European 7% Chinese 4% Korean 2%
Political lean MEDSL · Nassau
- 2024 margin
- Toss-up / Even · D 47.9% · R 52.1%
- 2008→2024 swing
- -12.6pp toward R · 2008: 8.4pp · 2024: -4.2pp
- All cycles
- 2024: R+4.2 2020: D+9.5 2016: D+5.3 2012: D+6.7 2008: D+8.4
Not yet ingested
- Civics
- —
Market trends
- HPI YoY
- ▼ -825.62%
- Current HPI
- 298.0511
- Rent YoY
- —
- Metro
- New York-Newark-Jersey City, NY-NJ-PA
- State GDP YoY
- ▲ 2.60%
- F500 in state
- 92
Industry mix (Fortune 500 HQ in NY)
| Industry | F500 HQs | Revenue |
|---|---|---|
| Financial Services | 10 | $950B |
|
||
| Consumer Goods | 9 | $162B |
|
||
| Insurance | 4 | $225B |
|
||
| Telecommunications | 2 | $144B |
|
||
| Pharmaceuticals | 2 | $112B |
|
||
| Media / Entertainment | 2 | $69B |
|
||
Price history
+29.6% since first listed4 events — show timeline
- 2026-03-18 Listed $828,000 OneKey® MLS as Distributed by MLS Grid
- 2025-12-03 Sold (MLS) $610,000 OneKey® MLS as Distributed by MLS Grid
- 2025-10-02 Pending — OneKey® MLS as Distributed by MLS Grid
- 2025-09-03 Listed $639,000 OneKey® MLS as Distributed by MLS Grid
Property tax history
+8.1%/yrLatest (2024): $9,497 · +116.0% YoY. Source: county tax records.
Cash-flow waterfall
monthlySold comps — $/sqft
last 12 mo · ≤1 miLoading sold comps…