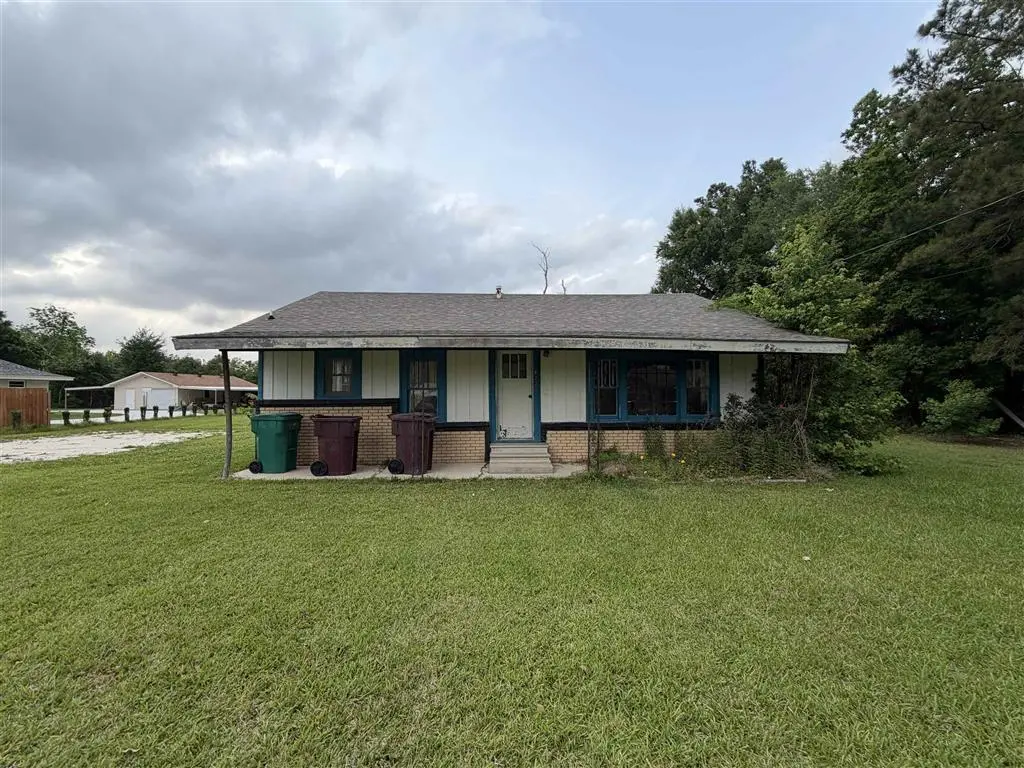
822 Garden Dr · Westlake, LA
Flood risk 4/10 · Minor
- FEMA flood zone
- X (shaded)
- Chance of flooding over 30 yrs
- 0.23%
- Est. flood insurance / yr
- $507 – $1,088
Fire risk 3/10 · Minor
- Est. fire insurance / yr
- $1,269 – $2,357
Heat risk 9/10 · Severe
- Hot days now (above 109°F)
- 7 days/yr
- Hot days in 30 yrs
- 22 days/yr
Wind risk 9/10 · Severe
- Chance of severe wind over 30 yrs
- 99.0%
Air-quality risk 2/10 · Minimal
- Unhealthy air days now
- 1 days/yr
- Unhealthy air days in 30 yrs
- 1 days/yr
Risk factors via First Street. Map © Google.
Why this score? — see what drove the D+ grade
The composite is a weighted blend of 9 inputs, each scored 0–100. Each bar is that input's sub-score; the figure is the points it added to the 100-point composite (weight × sub-score).
- Cash flow +15.0/30.0
- ARV discount +7.5/15.0
- 1% rule +5.0/10.0
- DSCR +5.0/10.0
- Appreciation +5.0/10.0
- Livability +3.3/5.0
- Schools +3.1/10.0
- Rent growth +2.5/5.0
- Condition / age +2.5/5.0
$95,000
🖨 Deal sheet 📄 Offer letter ✓ Due diligence
Listing remarks
INVESTOR SPECIAL- This home is loaded with potential. The home needs repairs and could be kept or resold. It comes with a beautiful large lot. New roof installed after the hurricanes.
Key facts
- Large lot
- New roof
- 1.56 acre lot
Tags
Property features AI
Exterior
- Utilities: Public water; Public sewer; Electricity connected; Natural gas available; Cable available; Water connected; Sewer connected
- Home design: Single-family house; One story
- Exterior features: Back yard; City lot; Rectangular lot
Interior
- Bathrooms: 2 full bathrooms
- Heating & cooling: Wall/window air conditioning units; Has heating
- Interior features: No fireplace
Neighborhood map
What this means for you Summary
Snapshot
- This is a 4-bed/2.0-bath single-family listed at $95k.
Deal economics
- At list price, monthly cash flow is $3k ($33k/yr) — positive.
- The deal already cash-flows at list — no discount required.
- Meets the 1% rule at list price ($4k rent vs $95k).
- Cap rate 40.8% vs local median 6.4% in Westlake — top-decile yield for the area; either an underpriced asset or a hidden risk that comps aren't pricing in. Stress-test before assuming the spread holds.
Location & tenants
- Location reads 66/100 on livability (#120 in LA) — a middle-class / working-renter tenant base. Strengths: cost of living A+, housing A+, schools A; Watch: amenities F, commute F.
- Calcasieu Parish (other): math 30% / reading 44% proficiency, ranked #29 of 98 in LA (top 30%) — families likely to look elsewhere, expect single-tenant / working-renter base with shorter leases.
- Market conditions: 3 active listings in the ZIP; 2 comparable units currently listed for rent nearby; 1,298 units permitted in Calcasieu Parish in 2024 (526 in 5+ unit buildings).
Forward outlook
- In year one you build about $4k of equity ($657 loan paydown + $3k appreciation (3.0% local appreciation)).
- Calcasieu County population projected at +11% by 2050 — modest demand growth; plan on rents tracking national, not racing it.
- At projected returns (3.0% appreciation + 3.0% rent growth), your $27k cash investment doubles in ~1 year — after that, you're playing with house money.
- By year 10, paydown + projected appreciation supports a ~$34k cash-out refi (75% LTV) — recoverable capital for the next deal without selling this one.
Negotiation context
- Only 11 days on market — expect competitive offers; lowballing is unlikely to land.
Risks & watch-outs
- Climate carrying-cost: severe wind risk, 99% chance of damaging wind over 30y; extreme-heat days projected 7→22/yr by 2055 (HVAC capex compounding) — expect insurance premiums to compound above CPI over the hold.
Questions for the listing agent
- Is there a deadline driving the sale (1031 exchange, divorce, estate, relocation)? That informs how much negotiation room exists.
- Schools are A-rated — typically a magnet for longer-tenancy family renters. What's the average tenant stay here, and is there a school-zone premium baked into asking?
- The area grade is low — what's the realistic commute time and amenity access for the typical tenant pool here? Any planned neighborhood developments (good or bad) we should know about?
- What's the average days-on-market for RENTAL listings here right now (not sales)? A rising rental-DOM trend means longer vacancies and softer asking-rent achievability than the comps imply.
- What's the recent tenant-quality profile in this submarket — average credit score on applications, eviction rate, late-payment / NSF rate, and stable-employment percentage? A property-management company in the area should have these aggregated.
- How much new for-sale + rental construction is in the pipeline within 1–3 miles? Heavy new supply typically softens prices + rents 12–24 months out; constrained supply supports both.
Investment metrics
- 1% rule
- 4.50% ✓
- Cap rate
- 40.77%
- Cash-on-cash
- 123.14%
- DSCR
- 6.48
- GRM
- 1.9
CMA / ARV
- ARV (on-the-fly)
- $192,696
- Comps found
- 10
Show comp detail 10 sales within ~0.75 mi
| Address | Dist | Beds/Ba | Sqft | Sold | Price | $/sf | Match |
|---|---|---|---|---|---|---|---|
| 920 Live Oak St | 0.28mi | 3/2.0 (-1) | 1,500 (-4%) | 13mo | $208,000 | $139 | 65 |
| 923 Live Oak St | 0.31mi | 3/2.0 (-1) | 1,496 (-4%) | 21mo | $185,000 | $124 | 57 |
| 804 Wehrt St | 0.67mi | 4/2.0 | 1,604 (+3%) | 11mo | $195,000 | $122 | 54 |
| 1301 Matilda St St | 0.74mi | 3/2.0 (-1) | 1,516 (-2%) | 6mo | $80,000 | $53 | 51 |
| 1404 Rue Des Chene | 0.61mi | 3/2.0 (-1) | 1,685 (+8%) | 10mo | $223,500 | $133 | 44 |
| 1521 Matilda St | 0.59mi | 3/2.0 (-1) | 1,352 (-13%) | 3mo | $200,000 | $148 | 44 |
| 2230 Gus St | 0.37mi | 3/1.0 (-1) | 1,422 (-8%) | 19mo | $80,000 | $56 | 44 |
| 2520 Wilda St | 0.62mi | 3/2.0 (-1) | 1,417 (-9%) | 12mo | $158,900 | $112 | 41 |
| 215 River Oaks Dr | 0.65mi | 3/2.0 (-1) | 1,470 (-5%) | 19mo | $223,000 | $152 | 40 |
| 224 Dewitt St | 0.67mi | 4/1.0 | 1,617 (+4%) | 23mo | $145,000 | $90 | 39 |
Match score weights: distance 35% · size 25% · config 20% · recency 20%. Top-matched comps best support the ARV.
Projected returns pro-forma
3.0% appreciation · 3.0% rent growth · sell at horizon
- IRR
- —
- Equity multiple
- 7.97×
- Total profit
- $185,349
- Equity at exit
- $42,716
- IRR
- —
- Equity multiple
- 16.65×
- Total profit
- $416,285
- Equity at exit
- $65,831
Cash invested: $26,600 (down + closing). Projections, not guarantees.
Landlord ↔ Tenant lean methodology
- Overall (STATE)
- 90 Strongly Landlord-Friendly
- State Louisiana
- 90 Strongly Landlord-Friendly · R+12
- County
- — inherits STATE
- City
- — inherits STATE
ZIP-level market 70699
- Active inventory
- 3
- Price-to-rent
- 1.9×
Monthly cashflow live
- Estimated rent
- $4,278 medium interval (Pro) →
- Mortgage (P&I)
- −$498
- Tax from tax record
- −$112 /mo · $1,343/yr
- Insurance
- −$40
- HOA
- −$0
- Vacancy / Maint / Mgmt
- −$898
- Net cashflow
- $2,730
Break-even live
UW: 25.0% down · 7.5% · 30yr · 1.5% tax · 5.0% vac · 8.0% maint · 8.0% mgmt
Financing live
Cash to close
- Down payment
- $23,750
- Closing costs
- $2,850
- Reserves months
- —
- Total cash needed
- —
Loan-product check · same deal, 3 products live
Conventional
25% down · 7.5% · 30yr
- Down + closing
- —
- Monthly P&I
- —
- Monthly cashflow
- —
- DSCR
- —
- Eligible?
- —
Personal DTI + credit; lowest rate.
DSCR
20% down · 8.5% · 30yr
- Down + closing
- —
- Monthly P&I
- —
- Monthly cashflow
- —
- DSCR
- —
- Eligible?
- —
No personal income docs; deal must DSCR.
Hard money
10% down · 12.0% · 12mo
- Down + closing
- —
- Monthly P&I
- —
- Monthly cashflow
- —
- DSCR
- —
- Eligible?
- —
Short-term bridge; refi at stabilization.
Rent comps 2 comps
| Address | Beds | Baths | Sqft | Rent | $/sqft | DOM | Units | Dist |
|---|---|---|---|---|---|---|---|---|
| 1607 Matilda St Westlake, LA | 4.0 | 2.5 | 2120 | $4,300 | $2.03 | 43d | 1 | 0.50mi |
| 909 Wehrt St Westlake, LA | 4.0 | 2.0 | 1819 | $4,250 | $2.34 | 43d | 1 | 0.72mi |
Listing history 10 events
-
2026-06-19days on market $95,000 Active 11 DOM
-
2026-06-18days on market $95,000 Active 10 DOM
-
2026-06-17days on market $95,000 Active 9 DOM
-
2026-06-16days on market $95,000 Active 8 DOM
-
2026-06-15days on market $95,000 Active 7 DOM
-
2026-06-14days on market $95,000 Active 5 DOM
-
2026-06-13days on market $95,000 Active 4 DOM
-
2026-06-10days on market $95,000 Active 2 DOM
-
2026-06-09remarks 184-char remark
-
2026-06-09$95,000 Active 1 DOM
ⓘ Source: listings_history table (triggers on properties + properties_extension) + one-shot
backfill from property_details.listing_events for pre-trigger history.
Tax reassessment forecast LA · Resets to sale price
- Current annual tax
- $1,343 · $112/mo
- Projected year-2 tax
- $1,343 · $112/mo
- Expected delta
- $0/yr ($0/mo · 0.0%)
ⓘ Screening estimate from a state-policy table — verify with the county assessor before closing.
Climate risk First Street
- Flood 4/10 Moderate FEMA zone X (shaded) · 23% chance over 30 yrs
- Wildfire 3/10 Moderate
- Heat 9/10 Extreme 7 d/yr ≥109°F today · 22 d/yr by 30 yrs out
- Wind 9/10 Extreme 99% chance of damaging wind over 30 yrs
- Air quality 2/10 Low 1 unhealthy d/yr today · 1 by 30 yrs out
Nearby sold comps map
Loading sold comps map…
Walkable amenities ~0.75 mi
Loading nearby amenities…
Taxation est. · year 1
- Rental income
- $51,330
- − Mortgage interest
- −$5,321
- − Property taxes
- −$1,343
- − Insurance
- −$475
- − Repairs & maintenance
- −$4,106
- − Management
- −$4,106
- − Depreciation
- −$2,764
- Taxable income
- $33,214
- Est. tax owed @ 24.0%
- −$7,971
- After-tax cash flow
- $24,783/yr
For passive investors: Depreciation is non-cash, so a rental often shows a tax loss while cash-flowing — sheltering income. Rental losses are passive: they offset passive income freely, and up to $25,000/yr can offset ordinary (W-2) income if you actively participate and your MAGI is under $100k (phasing out to $0 by $150k); unused losses carry forward. On sale, claimed depreciation is recaptured at up to 25%, and gains may owe capital-gains tax (a 1031 exchange can defer both). Figures are a year-1 estimate at your 24.0% rate — not tax advice; consult a CPA.
Schools (NCES district)
- District
- Calcasieu Parish
- NCES district ID
- 2200330
- Math proficiency
- 30% ▼ -39.00%
- Reading proficiency
- 44% ▼ -33.00%
- Median HH income
- $44,700
- Composite
- 31.45/100
- National rank
- #5979
- State rank
- #29 of 98 in LA
Livability — Westlake
- Score
- 66/100
- State rank
- #120
- US rank
- #11457
Category grades
Schools grade is shown separately in the Schools card above.
Census & demographics
- Census place
- Westlake, LA
Population outlook (Calcasieu County) Hauer SSP2
- Today (2025)
- 212,179 people
- By 2030
- 218,199 · +2.8%
- By 2040
- 228,486 · +7.7%
- By 2050
- 236,208 · +11.3%
- By 2075
- 251,696 · +18.6%
- By 2100
- 247,848 · +16.8%
Not yet ingested
- Political lean
- —
- Race & ethnicity
- —
- Common origin
- —
- Civics
- —
Market trends
- HPI YoY
- —
- Current HPI
- —
- Rent YoY
- —
- Metro
- —
- State GDP YoY
- ▲ 3.29%
- F500 in state
- 10
Industry mix (Fortune 500 HQ in LA)
| Industry | F500 HQs | Revenue |
|---|---|---|
| Telecommunications | 2 | $23B |
|
||
| Utilities | 1 | $12B |
|
||
| Wholesale / Distribution | 1 | $5B |
|
||
| Advertising | 1 | $2B |
|
||
Price history
1 event — show timeline
- 2026-06-08 Listed $95,000 SWLAR
Property tax history
+5.6%/yrLatest (2025): $1,343 · +3.2% YoY. Source: county tax records.
Cash-flow waterfall
monthlySold comps — $/sqft
last 12 mo · ≤1 miLoading sold comps…