 5-Plex
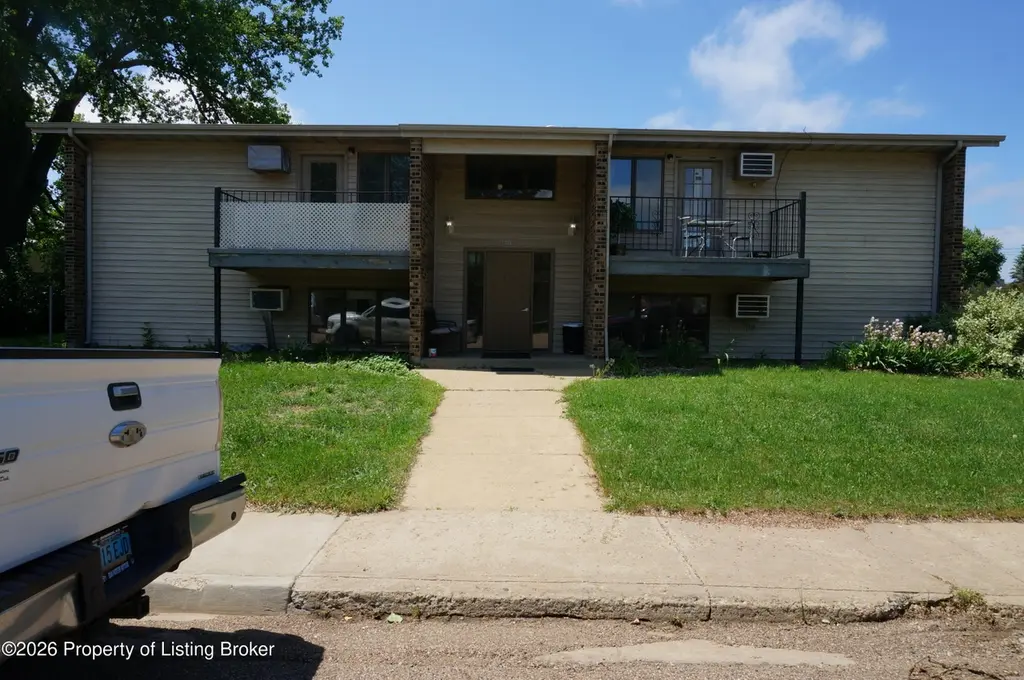
740 4th Ave E · New England, ND
Flood risk No data
- FEMA flood zone
- —
- Chance of flooding over 30 yrs
- —
- Est. flood insurance / yr
- —
Fire risk No data
- Est. fire insurance / yr
- —
Heat risk No data
- Hot days now (above threshold)
- —
- Hot days in 30 yrs
- —
Wind risk No data
- Chance of severe wind over 30 yrs
- —
Air-quality risk No data
- Unhealthy air days now
- —
- Unhealthy air days in 30 yrs
- —
Risk factors via First Street. Map © Google.
Why this score? — see what drove the C- grade
The composite is a weighted blend of 9 inputs, each scored 0–100. Each bar is that input's sub-score; the figure is the points it added to the 100-point composite (weight × sub-score).
- Cash flow +19.5/30.0
- ARV discount +7.5/15.0
- DSCR +6.2/10.0
- 1% rule +5.2/10.0
- Appreciation +5.0/10.0
- Livability +3.3/5.0
- Schools +2.7/10.0
- Rent growth +2.5/5.0
- Condition / age +2.2/5.0
$459,900
🖨 Deal sheet 📄 Offer letter ✓ Due diligence
Multi-family units
County records classify this as Multi-Family (5+ Unit). Listing-text estimate: 5 units. confirmed
5+ unit building — per-unit beds/baths from public records are typically unavailable; the breakdown below (if shown) is an estimate from the listing text.
Key facts
- 0.32 acre lot
- Built 1985
- Listed 62 days
Property features AI
Finance
- Financial info: Annual tax information available
Exterior
- Home design: Multi-family residential income property
- Exterior features: Lot approximately 0.32 acres (100 x 140); Zoned Residential High Density; Subdivision: Gabbert's First
Interior
- Bathrooms: 8 full bathrooms
- Interior features: Heating present
Neighborhood map
What this means for you Summary
Snapshot
- This is a 5 × 3-bed/?-bath units multifamily listed at $460k. Condition is rated fair.
Deal economics
- At list price, monthly cash flow is $521 ($6k/yr) — positive. Per door: $104/mo.
- The deal already cash-flows at list — no discount required.
- Meets the 1% rule at list price ($5k rent vs $460k).
- Recommended offer: $432k (6.0% below list) — sets the bar for market timing.
Location & tenants
- Location reads 66/100 on livability (#175 in ND) — a middle-class / working-renter tenant base. Strengths: cost of living A+, housing A+; Watch: health & safety D+, schools F, amenities F.
- New England 9 (rural): math 35% / reading 20% proficiency, ranked #145 of 169 in ND (top 86%) — low school quality limits family demand, transient renter base, plan for 1-2y turnover; only 18% free/reduced lunch — higher-income household profile.
- Market conditions: 8 active listings in the ZIP.
Forward outlook
- In year one you build about $17k of equity ($3k loan paydown + $14k appreciation (3.0% local appreciation)).
- Hettinger County population projected at +68% by 2050 — long-run rental-demand tailwind backs the buy-and-hold thesis.
- At projected returns (3.0% appreciation + 3.0% rent growth), your $129k cash investment doubles in ~5 years — after that, you're playing with house money.
- By year 3, paydown + projected appreciation supports a ~$42k cash-out refi (75% LTV) — recoverable capital for the next deal without selling this one.
Negotiation context
- It's been on market 63 days — a 6% lower offer ($432k) is reasonable based on typical stale-listing flexibility.
- 2 sale attempts with the ask held roughly flat each time — persistent listings suggest the price (not the market) is what's stuck; bring a comps-based counter.
Questions for the listing agent
- It's been on market 63 days. Have you received any prior offers? Is the seller open to a 6% concession, seller financing, or rate buy-down credit?
- Can we see the unit-by-unit rent roll, current vacancy, and any below-market leases? What's the average tenancy length?
- What capital expenditures (roof, boiler, parking lot, exteriors) have been made in the last 5 years, and what's planned in the next 2?
- Have any recent inspections been done? Can we get a copy of the seller's disclosures and any deferred-maintenance estimates?
- Why hasn't it sold? Are there any deal-killer items the seller is aware of (foundation, flood, title, zoning, code violations)?
- Is there a deadline driving the sale (1031 exchange, divorce, estate, relocation)? That informs how much negotiation room exists.
- Schools are F-rated, which usually means shorter tenancies and higher turnover. Who's the typical renter profile here, and what's been the actual vacancy rate?
- What's the average days-on-market for RENTAL listings here right now (not sales)? A rising rental-DOM trend means longer vacancies and softer asking-rent achievability than the comps imply.
- What's the recent tenant-quality profile in this submarket — average credit score on applications, eviction rate, late-payment / NSF rate, and stable-employment percentage? A property-management company in the area should have these aggregated.
- How much new apartment / multifamily construction is in the pipeline within 1–3 miles? Heavy new supply (>2% of stock underway) typically softens rents 12–24 months out; light construction supports rent growth.
Investment metrics
- 1% rule
- 1.02% ✓
- Cap rate
- 7.65%
- Cash-on-cash
- 4.86%
- DSCR
- 1.22
- GRM
- 8.2
CMA / ARV
No comps found within radius.
Projected returns pro-forma
3.0% appreciation · 3.0% rent growth · sell at horizon
- IRR
- 12.0%
- Equity multiple
- 1.69×
- Total profit
- $88,675
- Equity at exit
- $206,791
- IRR
- 14.1%
- Equity multiple
- 3.09×
- Total profit
- $269,310
- Equity at exit
- $318,690
Cash invested: $128,772 (down + closing). Projections, not guarantees.
Landlord ↔ Tenant lean methodology
- Overall (STATE)
- 82 Strongly Landlord-Friendly
- State North Dakota
- 82 Strongly Landlord-Friendly · R+20
- County
- — inherits STATE
- City
- — inherits STATE
ZIP-level market 58647
- Active inventory
- 8
- Price-to-rent
- 40.9×
Monthly cashflow live
- Estimated rent
- $4,683 medium interval (Pro) →
- Mortgage (P&I)
- −$2,412
- Tax est. 1.5%
- −$575 /mo · $6,898/yr
- Insurance
- −$192
- HOA
- −$0
- Vacancy / Maint / Mgmt
- −$983
- Net cashflow
- $521
Break-even live
5-unit breakdown (identical units grouped — click to expand)
| Units | Beds | Baths | Est. rent |
|---|---|---|---|
| 5× units | 3 | — | $4,685 |
| #1 | 3 | — | $937 |
| #2 | 3 | — | $937 |
| #3 | 3 | — | $937 |
| #4 | 3 | — | $937 |
| #5 | 3 | — | $937 |
| Total (5 units) | $4,683 | ||
UW: 25.0% down · 7.5% · 30yr · 1.5% tax · 5.0% vac · 8.0% maint · 8.0% mgmt
Financing live
Cash to close
- Down payment
- $114,975
- Closing costs
- $13,797
- Reserves months
- —
- Total cash needed
- —
Loan-product check · same deal, 3 products live
Conventional
25% down · 7.5% · 30yr
- Down + closing
- —
- Monthly P&I
- —
- Monthly cashflow
- —
- DSCR
- —
- Eligible?
- —
Personal DTI + credit; lowest rate.
DSCR
20% down · 8.5% · 30yr
- Down + closing
- —
- Monthly P&I
- —
- Monthly cashflow
- —
- DSCR
- —
- Eligible?
- —
No personal income docs; deal must DSCR.
Hard money
10% down · 12.0% · 12mo
- Down + closing
- —
- Monthly P&I
- —
- Monthly cashflow
- —
- DSCR
- —
- Eligible?
- —
Short-term bridge; refi at stabilization.
Listing history 18 events
-
2026-06-19days on market $459,900 Active 63 DOM
-
2026-06-18days on market $459,900 Active 62 DOM
-
2026-06-17days on market $459,900 Active 61 DOM
-
2026-06-16days on market $459,900 Active 60 DOM
-
2026-06-15days on market $459,900 Active 59 DOM
-
2026-06-14days on market $459,900 Active 57 DOM
-
2026-06-12days on market $459,900 Active 56 DOM
-
2026-06-09days on market $459,900 Active 53 DOM
-
2026-06-08days on market $459,900 Active 52 DOM
-
2026-06-07days on market $459,900 Active 51 DOM
-
2026-06-05days on market $459,900 Active 48 DOM
-
2026-06-03days on market $459,900 Active 47 DOM
-
2026-06-02days on market $459,900 Active 46 DOM
-
2026-06-01days on market $459,900 Active 45 DOM
-
2026-05-31days on market $459,900 Active 44 DOM
-
2026-05-30days on market $459,900 Active 43 DOM
-
2026-04-13$480,000 Active
-
2025-06-09$480,000 Active
ⓘ Source: listings_history table (triggers on properties + properties_extension) + one-shot
backfill from property_details.listing_events for pre-trigger history.
Nearby sold comps map
Loading sold comps map…
Walkable amenities ~0.75 mi
Loading nearby amenities…
Taxation est. · year 1
- Rental income
- $56,196
- − Mortgage interest
- −$25,762
- − Property taxes
- −$6,898
- − Insurance
- −$2,300
- − Repairs & maintenance
- −$4,496
- − Management
- −$4,496
- − Depreciation
- −$13,379
- Taxable loss
- −$1,134
- Est. tax savings @ 24.0%
- +$272
- After-tax cash flow
- $6,528/yr
For passive investors: Depreciation is non-cash, so a rental often shows a tax loss while cash-flowing — sheltering income. Rental losses are passive: they offset passive income freely, and up to $25,000/yr can offset ordinary (W-2) income if you actively participate and your MAGI is under $100k (phasing out to $0 by $150k); unused losses carry forward. On sale, claimed depreciation is recaptured at up to 25%, and gains may owe capital-gains tax (a 1031 exchange can defer both). Figures are a year-1 estimate at your 24.0% rate — not tax advice; consult a CPA.
Condition & rehab AI · 1 photo
This multi-family property requires moderate renovations, focusing on exterior siding, interior walls, and flooring. Upgrades will significantly enhance its resale and rental value.
Repairs flagged
- Major exterior siding — Significant wear and tear
- Major interior walls — Peeling paint
- Major flooring — Worn carpet
Value-add opportunities
- Both Paint interior walls — Enhances curb appeal and interior aesthetics
- Both Replace carpet — Improves comfort and reduces maintenance costs
- Both Replace exterior siding — Significantly improves curb appeal and property value
Renovation cost estimate screening
| Repair item | Severity | Est. cost |
|---|---|---|
| exterior siding · Significant wear and tear | Major | $15,000–50,000 |
| interior walls · Peeling paint | Major | $15,000–50,000 |
| flooring · Worn carpet | Major | $15,000–50,000 |
| Total estimated repair cost · 3 items | $45,000–150,000 |
Value-add ROI direction
- Both Paint interior walls — Enhances curb appeal and interior aesthetics ↑
- Both Replace carpet — Improves comfort and reduces maintenance costs ↑
- Both Replace exterior siding — Significantly improves curb appeal and property value ↑
ⓘ Cost ranges are severity-bucket heuristics (US national rule-of-thumb). Get contractor quotes + a written scope before underwriting a rehab budget.
Schools (NCES district)
- District
- New England 9
- NCES district ID
- 3800027
- Math proficiency
- 35% ▲ 5.00%
- Reading proficiency
- 20% ▬ 0.00%
- Median HH income
- $50,044
- Composite
- 27.1/100
- National rank
- #12477
- State rank
- #145 of 169 in ND
Livability — New England
- Score
- 66/100
- State rank
- #175
- US rank
- #12326
Category grades
Schools grade is shown separately in the Schools card above.
Census & demographics
- Census place
- New England, ND
- Population (ZIP)
- 1,120
Population outlook (Hettinger County) Hauer SSP2
- Today (2025)
- 3,198 people
- By 2030
- 3,515 · +9.9%
- By 2040
- 4,334 · +35.5%
- By 2050
- 5,386 · +68.4%
- By 2075
- 8,765 · +174.1%
- By 2100
- 11,627 · +263.6%
Race, ethnicity, and origin ACS 2023
- Neighborhood character
- Predominantly White (91%)
- Race & ethnicity
- White 91% Native American 4% Two or more races 3%
- Common ancestry
- Portuguese 7% Romanian 3% Scotch-Irish 2%
- Foreign-born
- 1% · South Korea
- Languages at home
- 97% English-only · Spanish 2% German/W. Germanic 1%
Political lean MEDSL · Hettinger
- 2024 margin
- Solid R (+69.3) · D 14.8% · R 84.2% · Other 1.0%
- 2008→2024 swing
- -33.2pp toward R · 2008: -36.1pp · 2024: -69.3pp
- All cycles
- 2024: R+69.3 2020: R+68.2 2016: R+68.5 2012: R+50.7 2008: R+36.1
Not yet ingested
- Civics
- —
Market trends
- HPI YoY
- —
- Current HPI
- —
- Rent YoY
- —
- Metro
- —
- State GDP YoY
- ▲ 2.09%
- F500 in state
- 2
Industry mix (Fortune 500 HQ in ND)
| Industry | F500 HQs | Revenue |
|---|---|---|
| Utilities / Construction | 1 | $6B |
|
||
Price history
+0.0% since first listed2 events — show timeline
- 2026-04-13 Listed $480,000 Badlands BOR MLS
- 2025-06-09 Listed $480,000 Badlands BOR MLS
Cash-flow waterfall
monthlySold comps — $/sqft
last 12 mo · ≤1 miLoading sold comps…