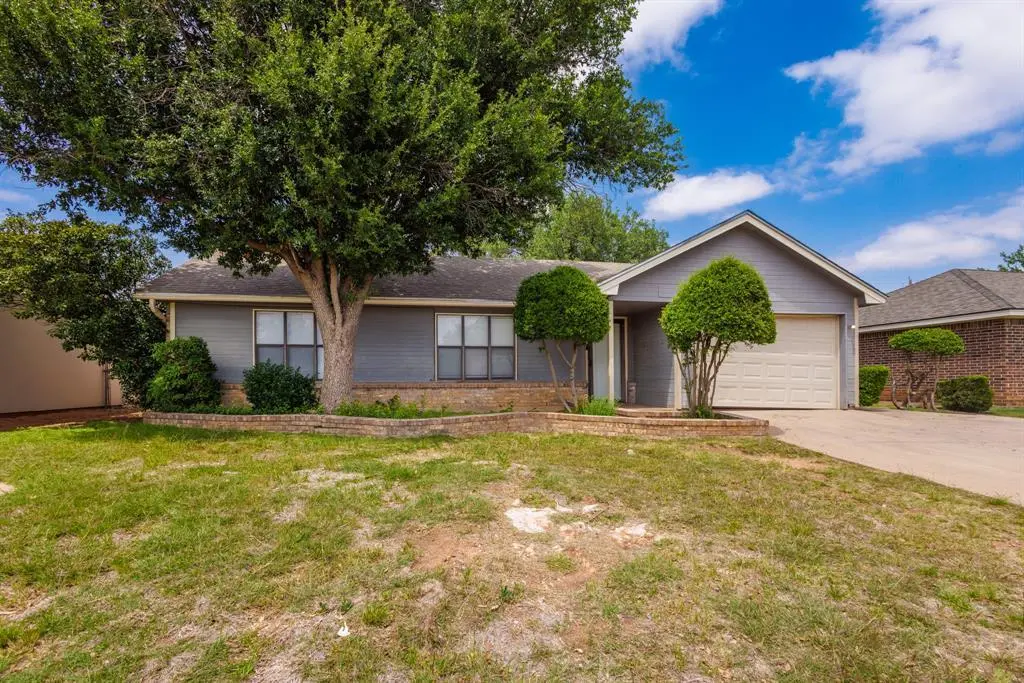
1342 Baylor St · Abilene, TX
Flood risk 1/10 · Minimal
- FEMA flood zone
- X (unshaded)
- Chance of flooding over 30 yrs
- 0.0%
- Est. flood insurance / yr
- $507 – $1,088
Fire risk 8/10 · Major
- Est. fire insurance / yr
- $1,222 – $2,270
Heat risk 7/10 · Major
- Hot days now (above 103°F)
- 7 days/yr
- Hot days in 30 yrs
- 23 days/yr
Wind risk 4/10 · Minor
- Chance of severe wind over 30 yrs
- 13.0%
Air-quality risk 1/10 · Minimal
- Unhealthy air days now
- 0 days/yr
- Unhealthy air days in 30 yrs
- 0 days/yr
Risk factors via First Street. Map © Google.
Why this score? — see what drove the C grade
The composite is a weighted blend of 9 inputs, each scored 0–100. Each bar is that input's sub-score; the figure is the points it added to the 100-point composite (weight × sub-score).
- Cash flow +23.8/30.0
- DSCR +7.7/10.0
- 1% rule +6.5/10.0
- Schools +5.6/10.0
- ARV discount +5.0/15.0
- Rent growth +5.0/5.0
- Livability +3.8/5.0
- Condition / age +2.5/5.0
- Appreciation +0.0/10.0
$165,000
🖨 Deal sheet 📄 Offer letter ✓ Due diligence
Listing remarks
Welcome home to this charming 2 bedroom, 1.5 bathroom property in the Lytle South subdivision! This home offers a comfortable layout with just the right amount of space for everyday living. The living area flows easily into the kitchen and dining space, creating a warm and inviting atmosphere. Both bedrooms are well-sized, and the additional half bath adds extra convenience for guests. Step outside to the spacious backyard where you’ll find a large shed perfect for storage, hobbies, or a workshop setup. Whether you're looking for your first home, downsizing, or adding to your investment portfolio, this one is full of potential and ready for you to make it your own!
Key facts
- Spacious backyard
- Large shed
- 7,187 sq ft lot
Tags
Property features AI
Finance
- Other: Property located in Lytle Shores South subdivision
- Financial info: Listing terms include 1031 exchange, cash, and conventional
- HOA & community: No association (no HOA)
Exterior
- Parking: Attached garage; Garage faces front; 1 covered garage space
- Security: No specific security features provided
- Utilities: City water; City sewer; Not in a municipal utility district
- Home design: Single-family residence; One story; Residential property; Preowned (built 1983)
- Construction: Siding exterior; Composition roof; Slab foundation; Year built 1983
- Exterior features: Covered porch(es); Exterior storage; Wood fencing; Few trees; Interior lot in a subdivision
Interior
- Kitchen: Dishwasher; Disposal; Electric range
- Bedrooms: 2 bedrooms (primary bedroom on main level)
- Flooring: Carpet; Luxury vinyl plank
- Bathrooms: 1 full bathroom; 1 half bathroom
- Heating & cooling: Central heating (electric); Central air (electric); Ceiling fan(s)
- Interior features: Cable TV available; Eat-in kitchen; High-speed internet available; One living area; One dining area; Room count: 2
- Laundry & utility: No specific laundry details provided
Neighborhood map
What this means for you Summary
Snapshot
- This is a 2-bed/1.5-bath single-family listed at $165k.
Deal economics
- At list price, monthly cash flow is $318 ($4k/yr) — positive.
- The deal already cash-flows at list — no discount required.
- Meets the 1% rule at list price ($2k rent vs $165k).
- Recommended offer: $163k (1.5% below list) — sets the bar for market timing.
- Cap rate 8.6% vs local median 6.7% in Abilene — meaningfully above typical; check what's discounted (condition, days-on-market, listing class) to confirm the premium yield is real.
Location & tenants
- Location reads 75/100 on livability (#142 in TX, #4,037 nationally) — a middle-class / working-renter tenant base. Strengths: cost of living A+, housing A+, health & safety A+; Watch: crime D, commute F.
- Wylie ISD (rural): math 63% / reading 62% proficiency, ranked #32 of 826 in TX (top 4%) — acceptable for families but not a draw, mixed tenant base, ~2y average lease; only 17% free/reduced lunch — higher-income household profile.
- Zoned schools: Wylie East El (math 58% / reading 58%, grade C+, #480 of 4,322 statewide, top 11%, 789 students, 30% FRL).
- Market conditions: Rents rising fast (+33.5%/yr); 370 active listings in the ZIP; 3 comparable units currently listed for rent nearby; rentals leasing fast (median 13d on market — plan ~1-2 weeks tenant-placement turnaround); solid renter incomes; 508 units permitted in Taylor County in 2024 (0 in 5+ unit buildings).
Forward outlook
- Local home prices are declining (-3.0%/yr); year-one equity from $1k of loan paydown is wiped out by about $5k of value loss. Plan a longer hold.
- Taylor County population projected at +16% by 2050 — long-run rental-demand tailwind backs the buy-and-hold thesis.
- At projected returns (-3.0% appreciation + 8.0% rent growth), your $46k cash investment doubles in ~8 years — after that, you're playing with house money.
Negotiation context
- It's been on market 24 days — a 2% lower offer ($163k) is reasonable based on typical stale-listing flexibility.
- 5 sale attempts since 9y ago with the ask held roughly flat each time — persistent listings suggest the price (not the market) is what's stuck; bring a comps-based counter.
Risks & watch-outs
- Climate carrying-cost: severe wildfire risk; extreme-heat days projected 7→23/yr by 2055 (HVAC capex compounding) — expect insurance premiums to compound above CPI over the hold.
Questions for the listing agent
- Is there a deadline driving the sale (1031 exchange, divorce, estate, relocation)? That informs how much negotiation room exists.
- Schools are D-rated, which usually means shorter tenancies and higher turnover. Who's the typical renter profile here, and what's been the actual vacancy rate?
- Crime grade is D in this area — have there been break-ins, vandalism, or insurance claims at this property in the last 3 years? What carrier currently insures it and at what premium?
- What's the average days-on-market for RENTAL listings here right now (not sales)? A rising rental-DOM trend means longer vacancies and softer asking-rent achievability than the comps imply.
- What's the recent tenant-quality profile in this submarket — average credit score on applications, eviction rate, late-payment / NSF rate, and stable-employment percentage? A property-management company in the area should have these aggregated.
- How much new for-sale + rental construction is in the pipeline within 1–3 miles? Heavy new supply typically softens prices + rents 12–24 months out; constrained supply supports both.
Investment metrics
- 1% rule
- 1.15% ✓
- Cap rate
- 8.61%
- Cash-on-cash
- 8.27%
- DSCR
- 1.37
- GRM
- 7.2
CMA / ARV
- ARV (on-the-fly)
- $156,275
- Comps found
- 12
Show comp detail 12 sales within ~0.75 mi
| Address | Dist | Beds/Ba | Sqft | Sold | Price | $/sf | Match |
|---|---|---|---|---|---|---|---|
| 1350 Baylor St | 0.01mi | 2/1.0 | 844 (-6%) | 2mo | $159,000 | $188 | 87 |
| 3609 Purdue Ln | 0.11mi | 2/1.0 | 888 (-1%) | 9mo | $154,900 | $174 | 85 |
| 3674 Trinity Ln | 0.15mi | 2/1.0 | 857 (-4%) | 2mo | $122,500 | $143 | 83 |
| 3618 Radcliff Rd | 0.06mi | 3/1.5 (+1) | 928 (+4%) | 6mo | $162,000 | $175 | 80 |
| 3734 Duke Ln | 0.26mi | 2/1.0 | 912 (+2%) | 5mo | $175,500 | $192 | 78 |
| 3749 Radcliff Rd | 0.21mi | 3/1.0 (+1) | 917 (+3%) | 4mo | $169,900 | $185 | 75 |
| 3958 Georgetown Dr | 0.46mi | 2/1.0 | 870 (-3%) | 4mo | $115,000 | $132 | 69 |
| 3933 Radcliff Rd | 0.43mi | 2/1.0 | 925 (+4%) | 7mo | $139,463 | $151 | 66 |
| 3801 Trinity Ln | 0.27mi | 2/1.5 | 974 (+9%) | 8mo | $174,900 | $180 | 66 |
| 3926 Radcliff Rd | 0.42mi | 2/2.0 | 936 (+5%) | 7mo | $168,000 | $179 | 65 |
| 3918 Trinity Ln | 0.41mi | 2/1.0 | 925 (+4%) | 10mo | $135,000 | $146 | 65 |
| 3949 Notre Dame Cir | 0.53mi | 3/1.0 (+1) | 943 (+6%) | 9mo | $165,000 | $175 | 51 |
Match score weights: distance 35% · size 25% · config 20% · recency 20%. Top-matched comps best support the ARV.
Projected returns pro-forma
-3.0% appreciation · 8.0% rent growth · sell at horizon
- IRR
- 2.0%
- Equity multiple
- 1.08×
- Total profit
- $3,658
- Equity at exit
- $24,602
- IRR
- 16.1%
- Equity multiple
- 2.63×
- Total profit
- $75,347
- Equity at exit
- $14,266
Cash invested: $46,200 (down + closing). Projections, not guarantees.
Landlord ↔ Tenant lean methodology
- Overall (STATE)
- 87 Strongly Landlord-Friendly
- State Texas
- 87 Strongly Landlord-Friendly · R+5
- County
- — inherits STATE
- City
- — inherits STATE
ZIP-level market 79602
- Home prices YoY
- -19.6%
- Rents YoY
- 33.5%
- Active inventory
- 370
- Price-to-rent
- 7.2×
Monthly cashflow live
- Estimated rent
- $1,905 medium interval (Pro) →
- Mortgage (P&I)
- −$865
- Tax from tax record
- −$253 /mo · $3,036/yr
- Insurance
- −$69
- HOA
- −$0
- Vacancy / Maint / Mgmt
- −$400
- Net cashflow
- $318
Break-even live
UW: 25.0% down · 7.5% · 30yr · 1.5% tax · 5.0% vac · 8.0% maint · 8.0% mgmt
Financing live
Cash to close
- Down payment
- $41,250
- Closing costs
- $4,950
- Reserves months
- —
- Total cash needed
- —
Loan-product check · same deal, 3 products live
Conventional
25% down · 7.5% · 30yr
- Down + closing
- —
- Monthly P&I
- —
- Monthly cashflow
- —
- DSCR
- —
- Eligible?
- —
Personal DTI + credit; lowest rate.
DSCR
20% down · 8.5% · 30yr
- Down + closing
- —
- Monthly P&I
- —
- Monthly cashflow
- —
- DSCR
- —
- Eligible?
- —
No personal income docs; deal must DSCR.
Hard money
10% down · 12.0% · 12mo
- Down + closing
- —
- Monthly P&I
- —
- Monthly cashflow
- —
- DSCR
- —
- Eligible?
- —
Short-term bridge; refi at stabilization.
Rent comps 3 comps
| Address | Beds | Baths | Sqft | Rent | $/sqft | DOM | Units | Dist |
|---|---|---|---|---|---|---|---|---|
| 3749 Duke Ln Abilene, TX | 2.0 | 1.0 | 925 | $1,650 | $1.78 | 7d | 1 | 0.27mi |
| 3874 Georgetown Dr Abilene, TX | 2.0 | 1.0 | 888 | $1,750 | $1.97 | 13d | 1 | 0.40mi |
| 3873 Purdue Ln Abilene, TX | 3.0 | 1.0 | 1027 | $2,100 | $2.04 | 13d | 1 | 0.41mi |
Listing history 19 events
-
2026-06-05statusdays on market $165,000 Pending 24 DOM
-
2026-06-02days on market $165,000 Active Option Contract 22 DOM
-
2026-06-01days on market $165,000 Active Option Contract 21 DOM
-
2026-05-31days on market $165,000 Active Option Contract 20 DOM
-
2026-05-30days on market $165,000 Active Option Contract 19 DOM
-
2026-05-17historical Active Option Contract
-
2026-05-11$165,000 Active
-
2025-10-08historical $1,495
-
2025-10-02$1,495
-
2025-02-17historical $1,295
-
2025-02-14$1,295
-
2025-02-11historical $1,295
-
2025-01-09$1,295
-
2017-11-16historical
-
2017-10-09price $103,250
-
2017-09-19price $98,500
-
2017-08-15$104,950 Active
-
2006-08-30soldstatus
-
2002-08-01soldstatus
ⓘ Source: listings_history table (triggers on properties + properties_extension) + one-shot
backfill from property_details.listing_events for pre-trigger history.
Tax reassessment forecast TX · Resets to sale price
- Current annual tax
- $3,036 · $253/mo
- Projected year-2 tax
- $3,036 · $253/mo
- Expected delta
- $0/yr ($0/mo · 0.0%)
ⓘ Screening estimate from a state-policy table — verify with the county assessor before closing.
Climate risk First Street
- Flood 1/10 Low FEMA zone X (unshaded) · 0% chance over 30 yrs
- Wildfire 8/10 Severe
- Heat 7/10 Severe 7 d/yr ≥103°F today · 23 d/yr by 30 yrs out
- Wind 4/10 Moderate 13% chance of damaging wind over 30 yrs
- Air quality 1/10 Low 0 unhealthy d/yr today · 0 by 30 yrs out
Nearby sold comps map
Loading sold comps map…
Walkable amenities ~0.75 mi
Loading nearby amenities…
Taxation est. · year 1
- Rental income
- $22,865
- − Mortgage interest
- −$9,243
- − Property taxes
- −$3,036
- − Insurance
- −$825
- − Repairs & maintenance
- −$1,829
- − Management
- −$1,829
- − Depreciation
- −$4,800
- Taxable income
- $1,303
- Est. tax owed @ 24.0%
- −$313
- After-tax cash flow
- $3,506/yr
For passive investors: Depreciation is non-cash, so a rental often shows a tax loss while cash-flowing — sheltering income. Rental losses are passive: they offset passive income freely, and up to $25,000/yr can offset ordinary (W-2) income if you actively participate and your MAGI is under $100k (phasing out to $0 by $150k); unused losses carry forward. On sale, claimed depreciation is recaptured at up to 25%, and gains may owe capital-gains tax (a 1031 exchange can defer both). Figures are a year-1 estimate at your 24.0% rate — not tax advice; consult a CPA.
Schools (NCES district)
- District
- Wylie ISD
- NCES district ID
- 4846500
- Math proficiency
- 63% ▼ -12.00%
- Reading proficiency
- 62% ▼ -4.00%
- Median HH income
- $78,248
- Composite
- 55.86/100
- National rank
- #1206
- State rank
- #32 of 826 in TX
Livability — Abilene
- Score
- 75/100
- State rank
- #142
- US rank
- #4037
Category grades
Schools grade is shown separately in the Schools card above.
Census & demographics
- Census place
- Abilene, TX
- County
- Taylor County · 136,672 people
- City population
- 136,672
- Metro
- Abilene, TX
- Population (ZIP)
- 27,425
- Household income
- $89,551
- Rent vs Own
- Severe rent burden
- 338.0
Population outlook (Taylor County) Hauer SSP2
- Today (2025)
- 145,270 people
- By 2030
- 150,050 · +3.3%
- By 2040
- 159,417 · +9.7%
- By 2050
- 168,883 · +16.3%
- By 2075
- 194,436 · +33.8%
- By 2100
- 203,163 · +39.9%
Race, ethnicity, and origin ACS 2023
- Neighborhood character
- Majority White (64%)
- Race & ethnicity
- White 64% Hispanic / Latino 22% Two or more races 12% Black 10% Asian 2%
- Hispanic origin (detail)
- Mexican 19%
- Common ancestry
- Romanian 2% Italian 2% Portuguese 2%
- Foreign-born
- 6% · Canada, Vietnam, Jamaica
- Languages at home
- 87% English-only · Spanish 9% Other Asian/Pacific 1% French/Haitian/Cajun 1%
Political lean MEDSL · Taylor
- 2024 margin
- Solid R (+49.8) · D 24.6% · R 74.4% · Other 1.0%
- 2008→2024 swing
- -4.2pp toward R · 2008: -45.6pp · 2024: -49.8pp
- All cycles
- 2024: R+49.8 2020: R+45.3 2016: R+51.1 2012: R+53.6 2008: R+45.6
Not yet ingested
- Civics
- —
Market trends
- HPI YoY
- ▼ -46.04%
- Current HPI
- 189.3098
- Rent YoY
- ▲ 33.46%
- Metro
- Abilene, TX
- State GDP YoY
- ▲ 3.95%
- F500 in state
- 110
Industry mix (Fortune 500 HQ in TX)
| Industry | F500 HQs | Revenue |
|---|---|---|
| Energy | 16 | $1,198B |
|
||
| Technology | 5 | $198B |
|
||
| Engineering / Construction | 4 | $72B |
|
||
| Energy Services | 3 | $60B |
|
||
| Utilities | 3 | $41B |
|
||
| Healthcare | 2 | $330B |
|
||
Price history
+57.2% since first listed14 events — show timeline
- 2026-05-17 Contingent — NTREIS
- 2026-05-11 Listed $165,000 NTREIS
- 2025-10-08 Rental Removed $1,495 NTREIS
- 2025-10-02 Listed for Rent $1,495 NTREIS
- 2025-02-17 Rental Removed $1,295 APPFOLIO
- 2025-02-14 Listed for Rent $1,295 APPFOLIO
- 2025-02-11 Rental Removed $1,295 NTREIS
- 2025-01-09 Listed for Rent $1,295 NTREIS
- 2017-11-16 Listing Removed — NTREIS
- 2017-10-09 Price Changed $103,250 NTREIS
- 2017-09-19 Price Changed $98,500 NTREIS
- 2017-08-15 Listed $104,950 NTREIS
- 2006-08-30 Sold (Public Records) — Public Records
- 2002-08-01 Sold (Public Records) — Public Records
Property tax history
+6.2%/yrLatest (2025): $3,036 · -0.4% YoY. Source: county tax records.
Cash-flow waterfall
monthlySold comps — $/sqft
last 12 mo · ≤1 miLoading sold comps…