4029 14th Ave S Unit 15G · Minneapolis, MN
Flood risk 1/10 · Minimal
- FEMA flood zone
- X (unshaded)
- Chance of flooding over 30 yrs
- 0.0%
- Est. flood insurance / yr
- $507 – $1,088
Fire risk 1/10 · Minimal
- Est. fire insurance / yr
- $888 – $1,650
Heat risk 2/10 · Minimal
- Hot days now (above 100°F)
- 7 days/yr
- Hot days in 30 yrs
- 14 days/yr
Wind risk 2/10 · Minimal
- Chance of severe wind over 30 yrs
- —
Air-quality risk 2/10 · Minimal
- Unhealthy air days now
- 1 days/yr
- Unhealthy air days in 30 yrs
- 1 days/yr
Risk factors via First Street. Map © Google.
Why this score? — see what drove the D grade
The composite is a weighted blend of 9 inputs, each scored 0–100. Each bar is that input's sub-score; the figure is the points it added to the 100-point composite (weight × sub-score).
- ARV discount +15.0/15.0
- 1% rule +7.5/10.0
- Cash flow +5.9/30.0
- Livability +3.9/5.0
- Rent growth +3.6/5.0
- Schools +3.5/10.0
- Condition / age +2.5/5.0
- DSCR +0.2/10.0
- Appreciation +0.0/10.0
$100,000
🖨 Deal sheet (PDF) 📄 Offer letter ✓ Due diligence
Listing remarks MLS
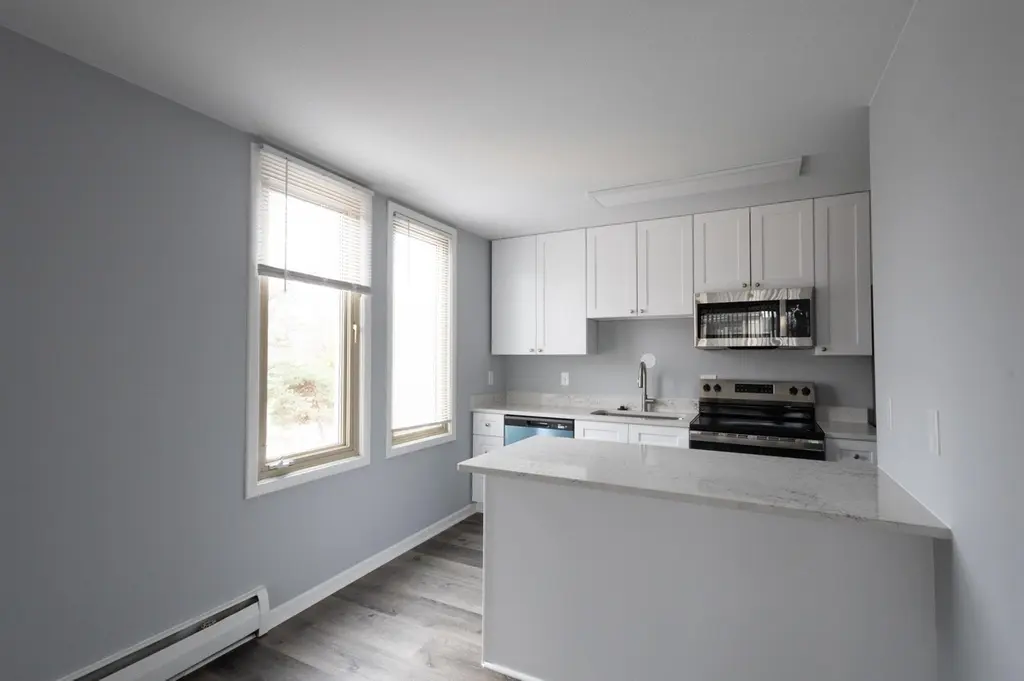
Beautifully renovated condo in a convenient South Minneapolis location! This move-in ready unit has undergone recent updates and is ready to welcome its new owner. Enjoy easy access to major highways, parks, shopping, and dining. A great opportunity for comfortable living in a well-connected area.
Key facts
- Renovated condo
- Well-connected area
- $495 HOA
Tags
Neighborhood map
What this means for you Summary
Snapshot
- This is a 1-bed/1.0-bath condo listed at $100k.
Deal economics
- At list price, monthly cash flow is $-198 ($-2k/yr) — negative.
- To cash-flow at today's rent, offer at most $65k (34.9% below list).
- Meets the 1% rule at list price ($1k rent vs $100k).
- Recommended offer: $65k (34.9% below list) — sets the bar for cash-flow.
- Cap rate 3.9% vs local median 3.1% in Minneapolis — meaningfully above typical; check what's discounted (condition, days-on-market, listing class) to confirm the premium yield is real.
Location & tenants
- Location reads 78/100 on livability (#110 in MN, #2,525 nationally) — a middle-class / working-renter tenant base. Strengths: amenities A+, commute A+, housing A+; Watch: cost of living C-, crime F.
- Minneapolis Public School District (urban): math 35% / reading 46% proficiency, ranked #217 of 301 in MN (top 72%) — families likely to look elsewhere, expect single-tenant / working-renter base with shorter leases.
- Zoned schools: Bancroft Elementary (math 17% / reading 27%, grade F, #732 of 857 statewide, top 88%, 369 students, 56% FRL); Sanford Middle (math 30% / reading 54%, grade D-, #131 of 258 statewide, top 53%, 738 students, 38% FRL); Roosevelt High (math 24%, 1,044 students, 59% FRL).
- Market conditions: Rents rising fast (+4.3%/yr); 146 active listings in the ZIP; 40 comparable units currently listed for rent nearby; rentals at typical pace (median 27d on market — plan ~3-4 weeks tenant-placement turnaround); solid renter incomes; 4,651 units permitted in Hennepin County in 2024 (2,443 in 5+ unit buildings).
Forward outlook
- Local home prices are declining (-3.0%/yr); year-one equity from $691 of loan paydown is wiped out by about $3k of value loss. Plan a longer hold.
- Hennepin County population projected at +30% by 2050 — long-run rental-demand tailwind backs the buy-and-hold thesis.
Negotiation context
- It's been on market 76 days — a 6% lower offer ($94k) is reasonable based on typical stale-listing flexibility.
- 6 sale attempts since 34y ago; this cycle's ask has dropped $10k (9%) from the opening price — seller is motivated, your offer sets the floor, not the list.
Risks & watch-outs
- Watch-outs: HOA is 40% of rent.
Questions for the listing agent
- What do current leases actually rent for vs. the listed asking? Can we see a recent rent roll and the last 12 months of T-12 income?
- It's been on market 76 days. Have you received any prior offers? Is the seller open to a 35% concession, seller financing, or rate buy-down credit?
- Built in 1965 — when were the roof, HVAC, electrical panel, plumbing, and water heater last replaced?
- What does the HOA fee cover, when was the last increase, and are there any pending special assessments or reserve-fund shortfalls?
- Any open or pending special assessments — roof, HVAC, plumbing, elevator, façade? What's the per-unit balance and payoff schedule, and is the seller paying it off at close or rolling it to the buyer?
- Why hasn't it sold? Are there any deal-killer items the seller is aware of (foundation, flood, title, zoning, code violations)?
- Is there a deadline driving the sale (1031 exchange, divorce, estate, relocation)? That informs how much negotiation room exists.
- Crime grade is F in this area — have there been break-ins, vandalism, or insurance claims at this property in the last 3 years? What carrier currently insures it and at what premium?
- The area grade is low — what's the realistic commute time and amenity access for the typical tenant pool here? Any planned neighborhood developments (good or bad) we should know about?
- What's the average days-on-market for RENTAL listings here right now (not sales)? A rising rental-DOM trend means longer vacancies and softer asking-rent achievability than the comps imply.
- What's the recent tenant-quality profile in this submarket — average credit score on applications, eviction rate, late-payment / NSF rate, and stable-employment percentage? A property-management company in the area should have these aggregated.
- How much new apartment / multifamily construction is in the pipeline within 1–3 miles? Heavy new supply (>2% of stock underway) typically softens rents 12–24 months out; light construction supports rent growth.
Investment metrics
- 1% rule
- 1.25% ✓
- Cap rate
- 3.92%
- Cash-on-cash
- -8.47%
- DSCR
- 0.62
- GRM
- 6.7
CMA / ARV
- ARV (median comp)
- $170,527
- List price
- $100,000
- Delta
- -41.36%
- Verdict
- UNDERPRICED
- Comps
- 2 within 2.0 mi
Projected returns pro-forma
-3.0% appreciation · 4.3% rent growth · sell at horizon
- IRR
- -28.0%
- Equity multiple
- 0.04×
- Total profit
- $-26,810
- Equity at exit
- $14,910
- IRR
- -18.5%
- Equity multiple
- -0.12×
- Total profit
- $-31,249
- Equity at exit
- $8,646
Cash invested: $28,000 (down + closing). Projections, not guarantees.
Landlord ↔ Tenant lean methodology
- Overall (CITY)
- 34 Tenant-Leaning
- State Minnesota
- 46 Balanced · D+2
- County
- — inherits STATE
- City Minneapolis
- 34 Tenant-Leaning · D+50
ZIP-level market 55407
- Rents YoY
- 4.3%
- Active inventory
- 146
- Price-to-rent
- 6.7×
Monthly cashflow live
- Estimated rent
- $1,252 high interval (Pro) →
- Mortgage (P&I)
- −$524
- Tax from tax record
- −$126 /mo · $1,512/yr
- Insurance
- −$42
- HOA
- −$495
- Vacancy / Maint / Mgmt
- −$263
- Net cashflow
- $-198
Break-even live
Sensitivity live
| Price | -10% $-141 | -5% $-169 | +0% $-198 | +5% $-226 | +10% $-254 |
|---|---|---|---|---|---|
| Rent | -10% $-297 | -5% $-247 | +0% $-198 | +5% $-148 | +10% $-99 |
| Rate | -1.0pp $-147 | -0.5pp $-172 | base $-198 | +0.5pp $-224 | +1.0pp $-250 |
UW: 25.0% down · 7.5% · 30yr · 1.5% tax · 5.0% vac · 8.0% maint · 8.0% mgmt
Financing live
Cash to close
- Down payment
- $25,000
- Closing costs
- $3,000
- Reserves months
- —
- Total cash needed
- —
Loan-product check · same deal, 3 products live
Conventional
25% down · 7.5% · 30yr
- Down + closing
- —
- Monthly P&I
- —
- Monthly cashflow
- —
- DSCR
- —
- Eligible?
- —
Personal DTI + credit; lowest rate.
DSCR
20% down · 8.5% · 30yr
- Down + closing
- —
- Monthly P&I
- —
- Monthly cashflow
- —
- DSCR
- —
- Eligible?
- —
No personal income docs; deal must DSCR.
Hard money
10% down · 12.0% · 12mo
- Down + closing
- —
- Monthly P&I
- —
- Monthly cashflow
- —
- DSCR
- —
- Eligible?
- —
Short-term bridge; refi at stabilization.
Rent comps 40 comps
| Address | Beds | Baths | Sqft | Rent | $/sqft | DOM | Units | Dist |
|---|---|---|---|---|---|---|---|---|
| 4010 S 15th Ave Unit 8 Minneapolis, MN | 1.0 | 1.0 | 680 | $1,250 | $1.84 | 16d | 1 | 0.08mi |
| 4014 15th Ave S Unit 11B Minneapolis, MN | 1.0 | 1.0 | 671 | $1,475 | $2.20 | 45d | 1 | 0.09mi |
| 1818 E 41st St Minneapolis, MN | 1.0 | 1.0 | 600 | $975 | $1.62 | 45d | 1 | 0.36mi |
| 4106 Chicago Ave Unit 7 Minneapolis, MN | 1.0 | 1.0 | 640 | $1,199 | $1.87 | 6d | 1 | 0.39mi |
| 4112 Chicago Ave Minneapolis, MN | 1.0 | 1.0 | 640 | $1,099 | $1.72 | 26d | 1 | 0.39mi |
| 4112 Chicago Ave Unit 8 Minneapolis, MN | 1.0 | 1.0 | 640 | $1,145 | $1.79 | 45d | 1 | 0.39mi |
| 3705 Chicago Ave Unit 2 Minneapolis, MN | 1.0 | 1.0 | 575 | $1,000 | $1.74 | 45d | 1 | 0.59mi |
| 3540 11th Ave S Minneapolis, MN | 1.0 | 1.0 | 600 | $1,100 | $1.83 | 45d | 1 | 0.67mi |
| 3520 12th Ave S Minneapolis, MN | 1.0–2.0 | 1.0 | 725 | $1,100 | $1.52 | 45d | 1 | 0.68mi |
| 3521 12th Ave S Minneapolis, MN | 1.0 | 1.0 | 600 | $1,100 | $1.83 | 45d | 1 | 0.68mi |
| 3718 Oakland Ave Unit 2 Minneapolis, MN | 2.0 | 1.0 | 700 | $1,150 | $1.64 | 26d | 1 | 0.72mi |
| 3421 15th Ave S Minneapolis, MN | 1.0 | 1.0 | 750 | $1,198 | $1.60 | 45d | 1 | 0.80mi |
| 3400 10th Ave S Minneapolis, MN | 1.0 | 1.0 | 600 | $1,100 | $1.83 | 45d | 1 | 0.88mi |
| 3806 24th Ave S Minneapolis, MN | 2.0 | 1.0–2.0 | 772 | $1,752 | $2.27 | 6d | 11 | 0.92mi |
| 2504 E 42nd St Minneapolis, MN | 2.0 | 1.0 | 666 | $1,524 | $2.29 | 26d | 1 | 0.96mi |
| 3251 14th Ave S Minneapolis, MN | 1.0 | 1.0 | 600 | $1,099 | $1.83 | 16d | 1 | 0.99mi |
| 4200 1st Ave S Unit 9 Minneapolis, MN | 1.0 | 1.0 | 750 | $1,149 | $1.53 | 26d | 1 | 1.09mi |
| 4201 Nicollet Ave Minneapolis, MN | 1.0 | 1.0 | 545 | $1,555 | $2.85 | 26d | 1 | 1.11mi |
| 4222 Nicollet Ave Minneapolis, MN | 1.0–2.0 | 1.0–2.0 | 959 | $1,210 | $1.26 | 0d | 8 | 1.15mi |
| 3503 2nd Ave S Minneapolis, MN | 2.0 | 1.0 | 560 | $1,388 | $2.48 | 1d | 5 | 1.16mi |
| 3806 28th Ave S Minneapolis, MN | 1.0–2.0 | 1.0–2.0 | 820 | $1,345 | $1.64 | 26d | 3 | 1.16mi |
| 3117 15th Ave S Minneapolis, MN | 1.0 | 1.0 | 650 | $1,398 | $2.15 | 18d | 4 | 1.17mi |
| 3816 Nicollet Ave Minneapolis, MN | 1.0 | 1.0 | 550 | $1,062 | $1.93 | 18d | 2 | 1.19mi |
| 3100 Bloomington Ave Minneapolis, MN | 1.0 | 1.0 | 507 | $1,099 | $2.17 | 45d | 1 | 1.20mi |
| 3215 21st Ave S Unit 3215201 Minneapolis, MN | 1.0 | 1.0 | 550 | $1,365 | $2.48 | 26d | 1 | 1.22mi |
| 3536 Nicollet Ave Minneapolis, MN | 2.0 | 1.0–2.0 | 744 | $1,883 | $2.53 | 4d | 12 | 1.31mi |
| 3116 22nd Ave S Unit 4 Minneapolis, MN | 1.0 | 1.0 | 585 | $995 | $1.70 | 1d | 1 | 1.36mi |
| 3815 Hiawatha Ave Minneapolis, MN | 1.0 | 1.0 | 457 | $1,527 | $3.34 | 6d | 8 | 1.37mi |
| 3415 Nicollet Ave Minneapolis, MN | — | 1.0 | 375 | $800 | $2.13 | 5d | 1 | 1.37mi |
| 811 E Lake St Unit 403 Minneapolis, MN | — | 1.0 | 463 | $965 | $2.08 | 45d | 1 | 1.38mi |
| 2944 17th Ave S Minneapolis, MN | 1.0 | 1.0 | 488 | $1,224 | $2.51 | 6d | 5 | 1.38mi |
| 3105 22nd Ave S Unit 9 Minneapolis, MN | 1.0 | 1.0 | 557 | $975 | $1.75 | 26d | 1 | 1.40mi |
| 3105 22nd Ave S Unit 4 Minneapolis, MN | 1.0 | 1.0 | 557 | $950 | $1.71 | 45d | 1 | 1.40mi |
| 3333 Nicollet Ave Minneapolis, MN | 2.0 | 1.0 | 700 | $1,650 | $2.36 | 16d | 1 | 1.42mi |
| 3139 3rd Ave S Unit 3 Minneapolis, MN | 2.0 | 1.0 | 725 | $1,450 | $2.00 | 45d | 1 | 1.42mi |
| 4200 S 32nd Ave Apt 202 Minneapolis, MN | 1.0 | 1.0 | 619 | $1,399 | $2.26 | 45d | 1 | 1.43mi |
| 3325 Nicollet Ave Minneapolis, MN | 1.0 | 1.0 | 530 | $937 | $1.77 | 4d | 3 | 1.44mi |
| 3029 22nd Ave S Unit 209 Minneapolis, MN | — | 1.0 | 467 | $1,179 | $2.52 | 26d | 1 | 1.46mi |
| 3029 22nd Ave S Unit 403 Minneapolis, MN | 1.0 | 1.0 | 637 | $1,229 | $1.93 | 5d | 1 | 1.46mi |
| 3029 22nd Ave S Unit 218 Minneapolis, MN | — | 1.0 | 593 | $1,186 | $2.00 | 18d | 1 | 1.46mi |
HOA detail condo
- Monthly dues
- $495 · $5,940/yr
- Assessments
- None detected in remarks — confirm with the listing agent.
Listing history 31 events
-
2026-06-21days on market $100,000 Active 76 DOM
-
2026-06-18days on market $100,000 Active 73 DOM
-
2026-06-17days on market $100,000 Active 72 DOM
-
2026-06-16days on market $100,000 Active 71 DOM
-
2026-06-15days on market $100,000 Active 70 DOM
-
2026-06-13days on market $100,000 Active 68 DOM
-
2026-06-09days on market $100,000 Active 64 DOM
-
2026-06-08days on market $100,000 Active 63 DOM
-
2026-06-07days on market $100,000 Active 62 DOM
-
2026-06-04days on market $100,000 Active 59 DOM
-
2026-06-03days on market $100,000 Active 58 DOM
-
2026-06-02days on market $100,000 Active 57 DOM
-
2026-06-01days on market $100,000 Active 56 DOM
-
2026-05-31days on market $100,000 Active 55 DOM
-
2026-04-06$110,000 Active 298-char remark
Show marketing remark (298 chars)
Beautifully renovated condo in a convenient South Minneapolis location! This move-in ready unit has undergone recent updates and is ready to welcome its new owner. Enjoy easy access to major highways, parks, shopping, and dining. A great opportunity for comfortable living in a well-connected area.
-
2005-07-07soldstatus $96,900
-
2005-04-27soldstatus $96,900 158-char remark
Show marketing remark (158 chars)
Great location - View of pool - Newer appliances - New carpet - Freshly painted walls - New vinyl flooring shared pool and laundry facilities - Move right in!
-
2005-03-09historical 158-char remark
Show marketing remark (158 chars)
Great location - View of pool - Newer appliances - New carpet - Freshly painted walls - New vinyl flooring shared pool and laundry facilities - Move right in!
-
2005-02-16$96,000 158-char remark
Show marketing remark (158 chars)
Great location - View of pool - Newer appliances - New carpet - Freshly painted walls - New vinyl flooring shared pool and laundry facilities - Move right in!
-
2003-06-03soldstatus $77,000
-
2003-04-08soldstatus $76,000
-
2003-03-02historical
-
2002-12-03$76,000
-
1996-05-16soldstatus $24,900
-
1996-04-29soldstatus $24,900
-
1996-02-06historical
-
1996-01-05$24,900
-
1993-12-29historical
-
1993-03-10soldstatus $15,000
-
1993-01-22$15,900
-
1992-08-03$19,900
ⓘ Source: listings_history table (triggers on properties + properties_extension) + one-shot
backfill from property_details.listing_events for pre-trigger history.
Tax reassessment forecast MN · Partial reset (capped growth)
- Current annual tax
- $1,512 · $126/mo
- Projected year-2 tax
- $1,512 · $126/mo
- Expected delta
- $0/yr ($0/mo · 0.0%)
ⓘ Screening estimate from a state-policy table — verify with the county assessor before closing.
Climate risk First Street
- Flood 1/10 Low FEMA zone X (unshaded) · 0% chance over 30 yrs
- Wildfire 1/10 Low
- Heat 2/10 Low 7 d/yr ≥100°F today · 14 d/yr by 30 yrs out
- Wind 2/10 Low
- Air quality 2/10 Low 1 unhealthy d/yr today · 1 by 30 yrs out
Nearby sold comps map
Loading sold comps map…
Walkable amenities ~0.75 mi
Loading nearby amenities…
Taxation est. · year 1
- Rental income
- $15,029
- − Mortgage interest
- −$5,602
- − Property taxes
- −$1,512
- − Insurance
- −$500
- − Repairs & maintenance
- −$1,202
- − Management
- −$1,202
- − HOA
- −$5,940
- − Depreciation
- −$2,909
- Taxable loss
- −$3,838
- Est. tax savings @ 24.0%
- +$921
- After-tax cash flow
- $-1,451/yr
For passive investors: Depreciation is non-cash, so a rental often shows a tax loss while cash-flowing — sheltering income. Rental losses are passive: they offset passive income freely, and up to $25,000/yr can offset ordinary (W-2) income if you actively participate and your MAGI is under $100k (phasing out to $0 by $150k); unused losses carry forward. On sale, claimed depreciation is recaptured at up to 25%, and gains may owe capital-gains tax (a 1031 exchange can defer both). Figures are a year-1 estimate at your 24.0% rate — not tax advice; consult a CPA.
Schools (NCES district)
- District
- Minneapolis Public School District
- NCES district ID
- 2721240
- Math proficiency
- 35% ▼ -7.00%
- Reading proficiency
- 46% ▼ -1.00%
- Median HH income
- $50,521
- Composite
- 34.92/100
- National rank
- #5067
- State rank
- #217 of 301 in MN
Livability — Minneapolis
- Score
- 78/100
- State rank
- #110
- US rank
- #2525
Category grades
Schools grade is shown separately in the Schools card above.
Census & demographics
- Census place
- Minneapolis, MN
- County
- Hennepin County · 1,150,272 people
- City population
- 417,555
- Metro
- Minneapolis-St. Paul-Bloomington, MN-WI
- Population (ZIP)
- 37,667
- Household income
- $78,464
- Rent vs Own
- Severe rent burden
- 1583.0
Population outlook (Hennepin County) Hauer SSP2
- Today (2025)
- 1,405,227 people
- By 2030
- 1,492,650 · +6.2%
- By 2040
- 1,660,157 · +18.1%
- By 2050
- 1,823,498 · +29.8%
- By 2075
- 2,221,283 · +58.1%
- By 2100
- 2,509,976 · +78.6%
Race, ethnicity, and origin ACS 2023
- Neighborhood character
- Diverse neighborhood (Simpson 0.66)
- Race & ethnicity
- White 50% Hispanic / Latino 23% Black 18% Two or more races 10% Asian 2% Native American 2%
- Hispanic origin (detail)
- Mexican 15%
- Common ancestry
- Portuguese 8% Romanian 3% Lithuanian 2%
- Foreign-born
- 18% · Canada, Jamaica
- Languages at home
- 68% English-only · Spanish 20% Other Asian/Pacific 1%
Political lean MEDSL · Hennepin
- 2024 margin
- Solid D (+42.6) · D 70.2% · R 27.5% · Other 2.3%
- 2008→2024 swing
- +14.0pp toward D · 2008: 28.6pp · 2024: 42.6pp
- All cycles
- 2024: D+42.6 2020: D+43.2 2016: D+35.3 2012: D+27.1 2008: D+28.6
Not yet ingested
- Civics
- —
Market trends
- HPI YoY
- ▼ -211.97%
- Current HPI
- 292.0322
- Rent YoY
- ▲ 4.30%
- Metro
- Minneapolis-St. Paul-Bloomington, MN-WI
- State GDP YoY
- ▲ 2.41%
- F500 in state
- 34
Industry mix (Fortune 500 HQ in MN)
| Industry | F500 HQs | Revenue |
|---|---|---|
| Healthcare | 2 | $407B |
|
||
| Retail | 2 | $150B |
|
||
| Consumer Goods | 2 | $32B |
|
||
| Industrial Machinery | 2 | $6B |
|
||
| Agriculture | 1 | $40B |
|
||
| Healthcare / Medical Devices | 1 | $32B |
|
||
Price history
+452.8% since first listed17 events — show timeline
- 2026-04-06 Listed $110,000 NORTHSTARMLS as Distributed by MLS Grid
- 2005-07-07 Sold (Public Records) $96,900 Public Records
- 2005-04-27 Sold (MLS) $96,900 NORTHSTARMLS as Distributed by MLS Grid
- 2005-03-09 Listing Removed — NORTHSTARMLS as Distributed by MLS Grid
- 2005-02-16 Listed $96,000 NORTHSTARMLS as Distributed by MLS Grid
- 2003-06-03 Sold (Public Records) $77,000 Public Records
- 2003-04-08 Sold (MLS) $76,000 NORTHSTARMLS as Distributed by MLS Grid
- 2003-03-02 Listing Removed — NORTHSTARMLS as Distributed by MLS Grid
- 2002-12-03 Listed $76,000 NORTHSTARMLS as Distributed by MLS Grid
- 1996-05-16 Sold (Public Records) $24,900 Public Records
- 1996-04-29 Sold (MLS) $24,900 NORTHSTARMLS as Distributed by MLS Grid
- 1996-02-06 Listing Removed — NORTHSTARMLS as Distributed by MLS Grid
- 1996-01-05 Listed $24,900 NORTHSTARMLS as Distributed by MLS Grid
- 1993-12-29 Listing Removed — NORTHSTARMLS as Distributed by MLS Grid
- 1993-03-10 Sold (MLS) $15,000 NORTHSTARMLS as Distributed by MLS Grid
- 1993-01-22 Listed $15,900 NORTHSTARMLS as Distributed by MLS Grid
- 1992-08-03 Listed $19,900 NORTHSTARMLS as Distributed by MLS Grid
Property tax history
+6.8%/yrLatest (2025): $1,512 · +1.8% YoY. Source: county tax records.
Cash-flow waterfall
monthlySold comps — $/sqft
last 12 mo · ≤1 miLoading sold comps…