 Duplex
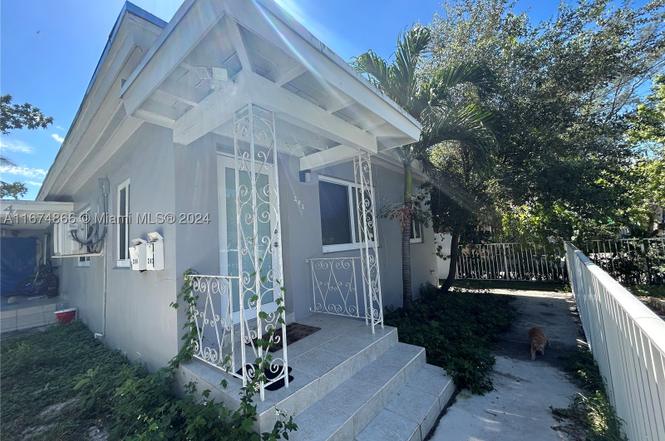
242 NE 55th Ter · Miami, FL
Flood risk 3/10 · Minor
- FEMA flood zone
- X (unshaded)
- Chance of flooding over 30 yrs
- 0.2%
- Est. flood insurance / yr
- $507 – $1,088
Fire risk 1/10 · Minimal
- Est. fire insurance / yr
- $947 – $1,759
Heat risk 10/10 · Severe
- Hot days now (above 103°F)
- 7 days/yr
- Hot days in 30 yrs
- 29 days/yr
Wind risk 10/10 · Severe
- Chance of severe wind over 30 yrs
- 99.0%
Air-quality risk 2/10 · Minimal
- Unhealthy air days now
- 1 days/yr
- Unhealthy air days in 30 yrs
- 1 days/yr
Risk factors via First Street. Map © Google.
Why this score? — see what drove the C grade
The composite is a weighted blend of 9 inputs, each scored 0–100. Each bar is that input's sub-score; the figure is the points it added to the 100-point composite (weight × sub-score).
- Cash flow +18.9/30.0
- ARV discount +7.5/15.0
- DSCR +5.9/10.0
- Appreciation +5.1/10.0
- 1% rule +4.2/10.0
- Schools +4.2/10.0
- Livability +3.9/5.0
- Rent growth +3.2/5.0
- Condition / age +2.5/5.0
$1,000,000
🖨 Deal sheet (PDF) 📄 Offer letter ✓ Due diligence
Multi-family units
County records classify this as Multi-Family (2-4 Unit). Listing-text estimate: 2 units. confirmed
Listing remarks
Discover a fantastic investment in this well-maintained multifamily property situated in a thriving neighborhood in an opportunity zone. This property boasts multiple spacious units, each featuring modern finishes, ample natural light, ensuring convenience for both tenants and owners. With a strong rental history and low vacancy rates, it’s an ideal addition to any portfolio. Enjoy the benefits of being in a desirable area with close proximity to local amenities, parks, public transport, restaurant, schools and much more!!!Duplex operating as a fourplex.
Key facts
- 4 parking spots
- Built 1953
- Listed 600 days
Property features AI
Finance
- Financial info: Rent includes sewer and trash collection; Multiple leased units with current rents reported (examples: $2,400; $1,500; $1,000)
Exterior
- Parking: Total of 4 parking spaces
- Utilities: Public water; Public sewer; Cable available
- Home design: Single-story building
- Construction: Block construction; Shingle roof; Resale property
- Exterior features: Fenced yard; Exterior lighting
Interior
- Kitchen: Range; Refrigerator; Microwave (in some units)
- Bedrooms: Multiple unit types: 1- and 2-bedroom units (various units across the property)
- Flooring: Tile
- Bathrooms: Combination of full and half baths across units (some units have 1 full bath, others have 2 full baths and some include a half bath)
- Heating & cooling: Electric heating; Air conditioning units
- Interior features: Blinds; Tile flooring; Smoke detectors; Window coverings included
- Laundry & utility: Air conditioning units included
Neighborhood map
What this means for you Summary
Snapshot
- This is a 2 × 2-bed/1.5-bath units multifamily listed at $1.00M.
Deal economics
- At list price, monthly cash flow is $1k ($12k/yr) — positive. Per door: $511/mo.
- The deal already cash-flows at list — no discount required.
- To meet the 1% rule (rent ≥ 1% of price), the offer needs to be $918k (8.2% below list).
- Recommended offer: $880k (12.0% below list) — sets the bar for market timing.
- Cap rate 7.5% vs local median 1.9% in Miami — top-decile yield for the area; either an underpriced asset or a hidden risk that comps aren't pricing in. Stress-test before assuming the spread holds.
Location & tenants
- Location reads 78/100 on livability (#177 in FL, #2,724 nationally) — a middle-class / working-renter tenant base. Strengths: amenities A+, commute A+, health & safety A+; Watch: employment C-, crime F, cost of living F.
- Miami-Dade (suburban): math 45% / reading 54% proficiency, ranked #40 of 73 in FL (top 55%) — families likely to look elsewhere, expect single-tenant / working-renter base with shorter leases; 64% free/reduced lunch — lower-income household profile, screen leases tightly.
- Market conditions: Rents rising (+2.7%/yr); 757 active listings in the ZIP; 3 comparable units currently listed for rent nearby; rentals leasing fast (median 4d on market — plan ~1-2 weeks tenant-placement turnaround); solid renter incomes; 10,051 units permitted in Miami-Dade County in 2024 (7,758 in 5+ unit buildings).
Forward outlook
- In year one you build about $10k of equity ($7k loan paydown + $3k appreciation (0.3% local appreciation)).
- Miami-Dade County population projected at +28% by 2050 — long-run rental-demand tailwind backs the buy-and-hold thesis.
- At projected returns (0.3% appreciation + 2.7% rent growth), your $280k cash investment doubles in ~9 years — after that, you're playing with house money.
- By year 6, paydown + projected appreciation supports a ~$63k cash-out refi (75% LTV) — recoverable capital for the next deal without selling this one.
Negotiation context
- It's been on market 601 days — a 12% lower offer ($880k) is reasonable based on typical stale-listing flexibility.
- 4 sale attempts since 16y ago; this cycle's ask has dropped $300k (23%) from the opening price — seller is motivated, your offer sets the floor, not the list.
- Current owner paid $40k; list at $1.00M implies a 2400% gain — meaningful room to come down on a strong offer.
Risks & watch-outs
- Watch-outs: built in 1953 — expect roof / HVAC / electrical / plumbing capex.
- Climate carrying-cost: severe wind risk, 99% chance of damaging wind over 30y; extreme-heat days projected 7→29/yr by 2055 (HVAC capex compounding) — expect insurance premiums to compound above CPI over the hold.
Questions for the listing agent
- It's been on market 601 days. Have you received any prior offers? Is the seller open to a 12% concession, seller financing, or rate buy-down credit?
- Can we see the unit-by-unit rent roll, current vacancy, and any below-market leases? What's the average tenancy length?
- What capital expenditures (roof, boiler, parking lot, exteriors) have been made in the last 5 years, and what's planned in the next 2?
- Built in 1953 — when were the roof, HVAC, electrical panel, plumbing, and water heater last replaced?
- Why hasn't it sold? Are there any deal-killer items the seller is aware of (foundation, flood, title, zoning, code violations)?
- Is there a deadline driving the sale (1031 exchange, divorce, estate, relocation)? That informs how much negotiation room exists.
- Schools are B-rated — typically a magnet for longer-tenancy family renters. What's the average tenant stay here, and is there a school-zone premium baked into asking?
- Crime grade is F in this area — have there been break-ins, vandalism, or insurance claims at this property in the last 3 years? What carrier currently insures it and at what premium?
- What's the average days-on-market for RENTAL listings here right now (not sales)? A rising rental-DOM trend means longer vacancies and softer asking-rent achievability than the comps imply.
- What's the recent tenant-quality profile in this submarket — average credit score on applications, eviction rate, late-payment / NSF rate, and stable-employment percentage? A property-management company in the area should have these aggregated.
- How much new apartment / multifamily construction is in the pipeline within 1–3 miles? Heavy new supply (>2% of stock underway) typically softens rents 12–24 months out; light construction supports rent growth.
Investment metrics
- 1% rule
- 0.92% ✗
- Cap rate
- 7.52%
- Cash-on-cash
- 4.38%
- DSCR
- 1.19
- GRM
- 9.1
CMA / ARV
No comps found within radius.
Projected returns pro-forma
0.27% appreciation · 2.73% rent growth · sell at horizon
- IRR
- 3.4%
- Equity multiple
- 1.16×
- Total profit
- $45,912
- Equity at exit
- $304,038
- IRR
- 8.3%
- Equity multiple
- 1.92×
- Total profit
- $258,372
- Equity at exit
- $376,563
Cash invested: $280,000 (down + closing). Projections, not guarantees.
Landlord ↔ Tenant lean methodology
- Overall (STATE)
- 87 Strongly Landlord-Friendly
- State Florida
- 87 Strongly Landlord-Friendly · R+3
- County
- — inherits STATE
- City
- — inherits STATE
ZIP-level market 33137
- Home prices YoY
- 0.1%
- Rents YoY
- 2.7%
- Active inventory
- 757
- Price-to-rent
- 18.2×
Monthly cashflow live
- Estimated rent
- $9,178 medium interval (Pro) →
- Mortgage (P&I)
- −$5,244
- Tax from tax record
- −$568 /mo · $6,816/yr
- Insurance
- −$417
- HOA
- −$0
- Vacancy / Maint / Mgmt
- −$1,927
- Net cashflow
- $1,022
Break-even live
Sensitivity live
| Price | -10% $1,588 | -5% $1,305 | +0% $1,022 | +5% $739 | +10% $456 |
|---|---|---|---|---|---|
| Rent | -10% $297 | -5% $659 | +0% $1,022 | +5% $1,384 | +10% $1,747 |
| Rate | -1.0pp $1,525 | -0.5pp $1,276 | base $1,022 | +0.5pp $763 | +1.0pp $499 |
2-unit breakdown (identical units grouped — click to expand)
| Units | Beds | Baths | Est. rent |
|---|---|---|---|
| 2× units | 2 | 1.5 | $9,178 |
| #1 | 2 | 1.5 | $4,589 |
| #2 | 2 | 1.5 | $4,589 |
| Total (2 units) | $9,178 | ||
UW: 25.0% down · 7.5% · 30yr · 1.5% tax · 5.0% vac · 8.0% maint · 8.0% mgmt
Financing live
Cash to close
- Down payment
- $250,000
- Closing costs
- $30,000
- Reserves months
- —
- Total cash needed
- —
Loan-product check · same deal, 3 products live
Conventional
25% down · 7.5% · 30yr
- Down + closing
- —
- Monthly P&I
- —
- Monthly cashflow
- —
- DSCR
- —
- Eligible?
- —
Personal DTI + credit; lowest rate.
DSCR
20% down · 8.5% · 30yr
- Down + closing
- —
- Monthly P&I
- —
- Monthly cashflow
- —
- DSCR
- —
- Eligible?
- —
No personal income docs; deal must DSCR.
Hard money
10% down · 12.0% · 12mo
- Down + closing
- —
- Monthly P&I
- —
- Monthly cashflow
- —
- DSCR
- —
- Eligible?
- —
Short-term bridge; refi at stabilization.
Rent comps 3 comps
| Address | Beds | Baths | Sqft | Rent | $/sqft | DOM | Units | Dist |
|---|---|---|---|---|---|---|---|---|
| 4675 NE 2nd Ave Miami, FL | 5.0 | 3.0 | 2248 | $27,500 | $12.23 | 4d | 1 | 0.60mi |
| 4675 NE 2nd Ave Miami, FL | 5.0 | 3.0 | 2248 | $27,500 | $12.23 | 4d | 1 | 0.60mi |
| 555 NE 34th St Miami, FL | 1.0–4.0 | 1.5–4.0 | 2653 | $18,997 | $7.16 | 0d | 19 | 1.26mi |
Listing history 32 events
-
2026-06-18days on market $1,000,000 Active 601 DOM
-
2026-06-17days on market $1,000,000 Active 600 DOM
-
2026-06-16days on market $1,000,000 Active 599 DOM
-
2026-06-15days on market $1,000,000 Active 598 DOM
-
2026-06-13days on market $1,000,000 Active 596 DOM
-
2026-06-09days on market $1,000,000 Active 592 DOM
-
2026-06-08days on market $1,000,000 Active 591 DOM
-
2026-06-08days on market $1,000,000 Active 590 DOM
-
2026-06-04days on market $1,000,000 Active 587 DOM
-
2026-06-03days on market $1,000,000 Active 586 DOM
-
2026-06-02days on market $1,000,000 Active 585 DOM
-
2026-06-01days on market $1,000,000 Active 584 DOM
-
2026-05-31days on market $1,000,000 Active 583 DOM
-
2026-04-10price $1,000,000
-
2026-03-27price $1,050,000
-
2026-03-09price $1,100,000
-
2025-02-03price $1,240,000
-
2024-11-12price $1,250,000
-
2024-10-25$1,300,000 Active
-
2015-02-10historical
-
2015-02-04$165,000 Active
-
2011-08-09soldstatus $40,000
-
2011-07-17$89,900
-
2011-07-06soldstatus $40,000
-
2011-03-21soldstatus $40,000
-
2010-10-20$40,000
-
2004-09-10soldstatus $175,000
-
2004-08-06soldstatus $117,000
-
1997-12-01soldstatus $108,000
-
1997-11-01soldstatus $108,000
-
1989-02-07soldstatus $57,100
-
1981-05-01soldstatus $58,000
ⓘ Source: listings_history table (triggers on properties + properties_extension) + one-shot
backfill from property_details.listing_events for pre-trigger history.
Tax reassessment forecast FL · Resets to sale price
- Current annual tax
- $6,816 · $568/mo
- Projected year-2 tax
- $8,300 · $692/mo
- Expected delta
- +$1,484/yr (+$124/mo · 21.8%)
ⓘ Screening estimate from a state-policy table — verify with the county assessor before closing.
Climate risk First Street
- Flood 3/10 Moderate FEMA zone X (unshaded) · 20% chance over 30 yrs
- Wildfire 1/10 Low
- Heat 10/10 Extreme 7 d/yr ≥103°F today · 29 d/yr by 30 yrs out
- Wind 10/10 Extreme 99% chance of damaging wind over 30 yrs
- Air quality 2/10 Low 1 unhealthy d/yr today · 1 by 30 yrs out
Nearby sold comps map
Loading sold comps map…
Walkable amenities ~0.75 mi
Loading nearby amenities…
Taxation est. · year 1
- Rental income
- $110,136
- − Mortgage interest
- −$56,016
- − Property taxes
- −$6,816
- − Insurance
- −$5,000
- − Repairs & maintenance
- −$8,811
- − Management
- −$8,811
- − Depreciation
- −$29,091
- Taxable loss
- −$4,408
- Est. tax savings @ 24.0%
- +$1,058
- After-tax cash flow
- $13,320/yr
For passive investors: Depreciation is non-cash, so a rental often shows a tax loss while cash-flowing — sheltering income. Rental losses are passive: they offset passive income freely, and up to $25,000/yr can offset ordinary (W-2) income if you actively participate and your MAGI is under $100k (phasing out to $0 by $150k); unused losses carry forward. On sale, claimed depreciation is recaptured at up to 25%, and gains may owe capital-gains tax (a 1031 exchange can defer both). Figures are a year-1 estimate at your 24.0% rate — not tax advice; consult a CPA.
Schools (NCES district)
- District
- Miami-Dade
- NCES district ID
- 1200390
- Math proficiency
- 45% ▼ -16.00%
- Reading proficiency
- 54% ▼ -5.00%
- Median HH income
- $43,928
- Composite
- 41.76/100
- National rank
- #3397
- State rank
- #40 of 73 in FL
Livability — Miami
- Score
- 78/100
- State rank
- #177
- US rank
- #2724
Category grades
Schools grade is shown separately in the Schools card above.
Census & demographics
- Census place
- Miami, FL
- County
- Miami-Dade County · 2,697,751 people
- City population
- 827,308
- Metro
- Miami-Fort Lauderdale-Pompano Beach, FL
- Population (ZIP)
- 29,414
- Household income
- $94,036
- Rent vs Own
- Severe rent burden
- 3106.0
Population outlook (Miami-Dade County) Hauer SSP2
- Today (2025)
- 3,126,439 people
- By 2030
- 3,325,765 · +6.4%
- By 2040
- 3,697,561 · +18.3%
- By 2050
- 4,012,134 · +28.3%
- By 2075
- 4,605,612 · +47.3%
- By 2100
- 4,866,598 · +55.7%
Race, ethnicity, and origin ACS 2023
- Neighborhood character
- Diverse neighborhood (Simpson 0.63)
- Race & ethnicity
- Hispanic / Latino 54% Two or more races 25% White 24% Black 16% Asian 2%
- Hispanic origin (detail)
- Mexican 1% Puerto Rican 5% Cuban 10% Dominican 3% Salvadoran 3%
- Common ancestry
- Hispanic 8% Estonian 2% Lithuanian 2%
- Foreign-born
- 47% · Canada, Jamaica, Dominican Republic
- Languages at home
- 34% English-only · Spanish 49% French/Haitian/Cajun 8% Other Indo-European 5%
Political lean MEDSL · Miami-Dade
- 2024 margin
- R (+11.4) · D 43.9% · R 55.4%
- 2008→2024 swing
- -27.6pp toward R · 2008: 16.1pp · 2024: -11.4pp
- All cycles
- 2024: R+11.4 2020: D+7.3 2016: D+29.6 2012: D+23.7 2008: D+16.1
Not yet ingested
- Civics
- —
Market trends
- HPI YoY
- ▲ 0.27%
- Current HPI
- 385.1514
- Rent YoY
- ▲ 2.73%
- Metro
- Miami-Fort Lauderdale-Pompano Beach, FL
- State GDP YoY
- ▲ 3.28%
- F500 in state
- 36
Industry mix (Fortune 500 HQ in FL)
| Industry | F500 HQs | Revenue |
|---|---|---|
| Industrial Technology | 2 | $29B |
|
||
| Insurance | 2 | $17B |
|
||
| Retail | 1 | $60B |
|
||
| Technology Distribution | 1 | $58B |
|
||
| Homebuilding | 1 | $35B |
|
||
| Technology Manufacturing | 1 | $35B |
|
||
Price history
+1624.1% since first listed19 events — show timeline
- 2026-04-10 Price Changed $1,000,000 MARMLS
- 2026-03-27 Price Changed $1,050,000 MARMLS
- 2026-03-09 Price Changed $1,100,000 MARMLS
- 2025-02-03 Price Changed $1,240,000 MARMLS
- 2024-11-12 Price Changed $1,250,000 MARMLS
- 2024-10-25 Listed $1,300,000 MARMLS
- 2015-02-10 Listing Removed — MARMLS
- 2015-02-04 Listed $165,000 MARMLS
- 2011-08-09 Sold (Public Records) $40,000 Public Records
- 2011-07-17 Listed $89,900 MARMLS
- 2011-07-06 Sold (MLS) $40,000 MARMLS
- 2011-03-21 Sold (Public Records) $40,000 Public Records
- 2010-10-20 Listed $40,000 MARMLS
- 2004-09-10 Sold (Public Records) $175,000 Public Records
- 2004-08-06 Sold (Public Records) $117,000 Public Records
- 1997-12-01 Sold (Public Records) $108,000 Public Records
- 1997-11-01 Sold (Public Records) $108,000 Public Records
- 1989-02-07 Sold (Public Records) $57,100 Public Records
- 1981-05-01 Sold (Public Records) $58,000 Public Records
Property tax history
+9.5%/yrLatest (2025): $6,816 · +7.3% YoY. Source: county tax records.
Cash-flow waterfall
monthlySold comps — $/sqft
last 12 mo · ≤1 miLoading sold comps…