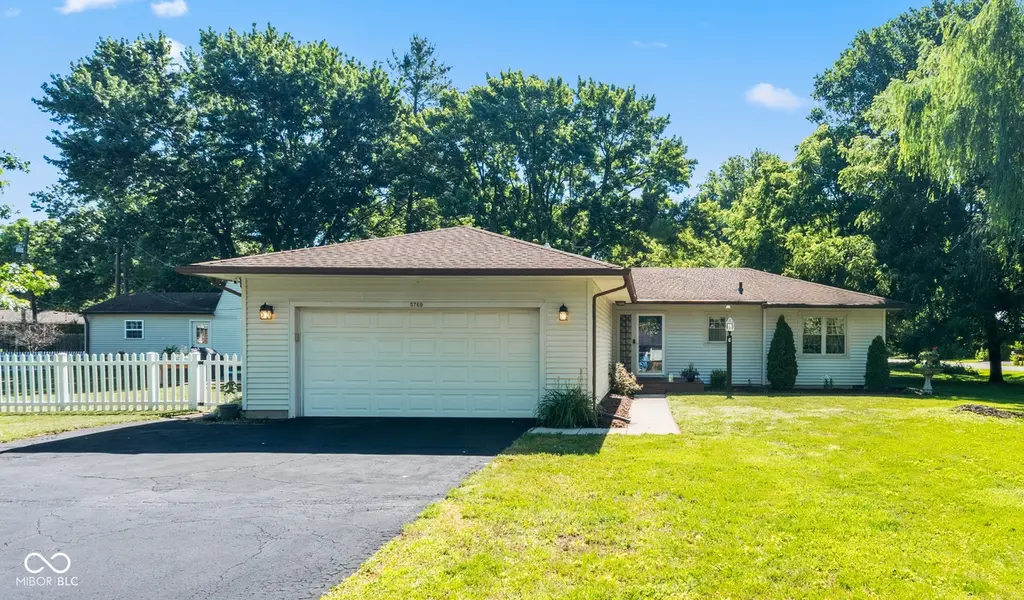
5769 Henderson Dr · Brownsburg, IN
Flood risk No data
- FEMA flood zone
- —
- Chance of flooding over 30 yrs
- —
- Est. flood insurance / yr
- —
Fire risk No data
- Est. fire insurance / yr
- —
Heat risk No data
- Hot days now (above threshold)
- —
- Hot days in 30 yrs
- —
Wind risk No data
- Chance of severe wind over 30 yrs
- —
Air-quality risk No data
- Unhealthy air days now
- —
- Unhealthy air days in 30 yrs
- —
Risk factors via First Street. Map © Google.
Why this score? — see what drove the D+ grade
The composite is a weighted blend of 9 inputs, each scored 0–100. Each bar is that input's sub-score; the figure is the points it added to the 100-point composite (weight × sub-score).
- ARV discount +15.0/15.0
- Cash flow +11.1/30.0
- Schools +6.3/10.0
- Rent growth +4.1/5.0
- Livability +3.8/5.0
- DSCR +3.2/10.0
- Condition / age +2.5/5.0
- 1% rule +2.1/10.0
- Appreciation +0.0/10.0
$319,900
🖨 Deal sheet (PDF) 📄 Offer letter ✓ Due diligence
Listing remarks MLS
Spacious 3-4 bdrm ranch. Fresh paint, new carpet, updated lighting, replacement windows, & a supersized work-shop with overhead door that is heated & cooled & has a loft for storage. The kitchen was updated a couple of yra. ago w/upgraded cabinets, gas range & has pantry space too. Huge great room w/frplc for the winter evenings. The family room could be converted to 4th bdrm easily if needed. Desirable location on the outer edge of Brownsburg. This well established neighborhood is great for walking, cycling & has mature trees! The lot is large 7 offers garden space & is fenced. Great deck w/electric awning adds to the appeal of the outdoor space. Home being sold as-is but seller is not aware of any defects. All new blinds, W/D stay. NO HOA
Key facts
- Fully fenced
- Space for office
- Large corner lot
Tags
Property features AI
Exterior
- Parking: Attached 2-car garage with garage door opener; Garage includes keyless entry
- Utilities: Private water source; Septic system; Cable available
- Home design: Single-family residence; One level
- Construction: Vinyl siding; Block and slab foundation
- Exterior features: Deck and porch; Partial fencing; Outbuilding on the property; Suburban lot setting
Interior
- Kitchen: Gas oven; Dishwasher; Refrigerator; Exhaust fan
- Bedrooms: Three bedrooms on the main level (sizes include 12x12, 10x10, 10x11)
- Bathrooms: Two full bathrooms on the main level; Primary bathroom features a full shower stall
- Heating & cooling: Forced air heating (natural gas); Central air conditioning; Wall unit(s) for cooling
- Interior features: Attic access with pull-down stairs; Laundry located in garage; Gas water heater; Water softener (owned); Exhaust fan; Smoke alarm; Sump pump
- Laundry & utility: Washer and dryer included; Laundry in garage
Neighborhood map
What this means for you Summary
Snapshot
- This is a 3-bed/1.5-bath single-family listed at $320k.
Deal economics
- At list price, monthly cash flow is $-128 ($-2k/yr) — negative.
- To cash-flow at today's rent, offer at most $297k (7.1% below list).
- To meet the 1% rule (rent ≥ 1% of price), the offer needs to be $228k (28.7% below list).
- Recommended offer: $228k (28.7% below list) — sets the bar for 1% rule.
- Cap rate 5.8% vs local median 3.9% in Brownsburg — top-decile yield for the area; either an underpriced asset or a hidden risk that comps aren't pricing in. Stress-test before assuming the spread holds.
Location & tenants
- Location reads 75/100 on livability (#61 in IN, #4,105 nationally) — a middle-class / working-renter tenant base. Strengths: crime A+, employment A+, cost of living A+; Watch: amenities F, commute F, health & safety F.
- Brownsburg Community School Corporation (suburban): math 72% / reading 72% proficiency, ranked #2 of 301 in IN (top 1%) — strong family-tenant draw, lease renewals of 3-5y typical; only 17% free/reduced lunch — higher-income household profile.
- Zoned schools: Brownsburg High School (math 61% / reading 83%, grade B+, #12 of 369 statewide, top 4%, 3,177 students, 33% FRL) — zoned schools average 33% FRL vs 17% district-wide (16 pts higher); higher-poverty schools than district average — tighter screening recommended.
- Market conditions: Rents rising fast (+6.3%/yr); 341 active listings in the ZIP; 3 comparable units currently listed for rent nearby; rentals leasing fast (median 1d on market — plan ~1-2 weeks tenant-placement turnaround); high-income renter base; 1,294 units permitted in Hendricks County in 2024 (18 in 5+ unit buildings).
Forward outlook
- Local home prices are declining (-3.0%/yr); year-one equity from $2k of loan paydown is wiped out by about $10k of value loss. Plan a longer hold.
- Hendricks County population projected at +35% by 2050 — long-run rental-demand tailwind backs the buy-and-hold thesis.
Negotiation context
- Only 4 days on market — expect competitive offers; lowballing is unlikely to land.
- 2 sale attempts since 5y ago with the ask held roughly flat each time — persistent listings suggest the price (not the market) is what's stuck; bring a comps-based counter.
- Current owner paid $238k; 35% above their basis — modest negotiation headroom, anchor on the comps not their cost.
Risks & watch-outs
- Watch-outs: built in 1955 — expect roof / HVAC / electrical / plumbing capex.
Questions for the listing agent
- What do current leases actually rent for vs. the listed asking? Can we see a recent rent roll and the last 12 months of T-12 income?
- Built in 1955 — when were the roof, HVAC, electrical panel, plumbing, and water heater last replaced?
- Is there a deadline driving the sale (1031 exchange, divorce, estate, relocation)? That informs how much negotiation room exists.
- Schools are A-rated — typically a magnet for longer-tenancy family renters. What's the average tenant stay here, and is there a school-zone premium baked into asking?
- The area grade is low — what's the realistic commute time and amenity access for the typical tenant pool here? Any planned neighborhood developments (good or bad) we should know about?
- What's the average days-on-market for RENTAL listings here right now (not sales)? A rising rental-DOM trend means longer vacancies and softer asking-rent achievability than the comps imply.
- What's the recent tenant-quality profile in this submarket — average credit score on applications, eviction rate, late-payment / NSF rate, and stable-employment percentage? A property-management company in the area should have these aggregated.
- How much new for-sale + rental construction is in the pipeline within 1–3 miles? Heavy new supply typically softens prices + rents 12–24 months out; constrained supply supports both.
Investment metrics
- 1% rule
- 0.71% ✗
- Cap rate
- 5.81%
- Cash-on-cash
- -1.72%
- DSCR
- 0.92
- GRM
- 11.7
CMA / ARV
- ARV (on-the-fly)
- $386,883
- Comps found
- 6
Show comp detail 6 sales within ~0.75 mi
| Address | Dist | Beds/Ba | Sqft | Sold | Price | $/sf | Match |
|---|---|---|---|---|---|---|---|
| 5798 Henderson Dr | 0.05mi | 3/1.0 | 1,780 (-5%) | 4mo | $250,000 | $140 | 84 |
| 5905 N County Rd 600 E | 0.29mi | 3/2.0 | 1,834 (-2%) | 11mo | $380,000 | $207 | 72 |
| 6495 E US Highway 136 | 0.17mi | 3/2.5 | 1,818 (-3%) | 23mo | $325,000 | $179 | 65 |
| 5965 N County Road 600 E | 0.31mi | 3/2.0 | 1,611 (-14%) | 3mo | $385,000 | $239 | 58 |
| 6805 E US Highway 136 | 0.43mi | 3/2.0 | 1,732 (-7%) | 17mo | $280,000 | $162 | 51 |
| 5207 Green Hills Dr | 0.62mi | 4/2.5 (+1) | 1,980 (+6%) | 9mo | $425,000 | $215 | 45 |
Match score weights: distance 35% · size 25% · config 20% · recency 20%. Top-matched comps best support the ARV.
Projected returns pro-forma
-3.0% appreciation · 6.31% rent growth · sell at horizon
- IRR
- -16.0%
- Equity multiple
- 0.42×
- Total profit
- $-52,286
- Equity at exit
- $47,698
- IRR
- -3.3%
- Equity multiple
- 0.75×
- Total profit
- $-22,138
- Equity at exit
- $27,659
Cash invested: $89,572 (down + closing). Projections, not guarantees.
Landlord ↔ Tenant lean methodology
- Overall (STATE)
- 90 Strongly Landlord-Friendly
- State Indiana
- 90 Strongly Landlord-Friendly · R+11
- County
- — inherits STATE
- City
- — inherits STATE
ZIP-level market 46112
- Rents YoY
- 6.3%
- Active inventory
- 341
- Price-to-rent
- 11.7×
Monthly cashflow live
- Estimated rent
- $2,280 medium interval (Pro) →
- Mortgage (P&I)
- −$1,678
- Tax from tax record
- −$118 /mo · $1,417/yr
- Insurance
- −$133
- HOA
- −$0
- Lot rent
- −$0
- Vacancy / Maint / Mgmt
- −$479
- Net cashflow
- $-128
Break-even live
Sensitivity live
| Price | -10% $53 | -5% $-37 | +0% $-128 | +5% $-219 | +10% $-309 |
|---|---|---|---|---|---|
| Rent | -10% $-308 | -5% $-218 | +0% $-128 | +5% $-38 | +10% $52 |
| Rate | -1.0pp $33 | -0.5pp $-47 | base $-128 | +0.5pp $-211 | +1.0pp $-295 |
UW: 25.0% down · 7.5% · 30yr · 1.5% tax · 5.0% vac · 8.0% maint · 8.0% mgmt
Financing live
Cash to close
- Down payment
- $79,975
- Closing costs
- $9,597
- Reserves months
- —
- Total cash needed
- —
Loan-product check · same deal, 3 products live
Conventional
25% down · 7.5% · 30yr
- Down + closing
- —
- Monthly P&I
- —
- Monthly cashflow
- —
- DSCR
- —
- Eligible?
- —
Personal DTI + credit; lowest rate.
DSCR
20% down · 8.5% · 30yr
- Down + closing
- —
- Monthly P&I
- —
- Monthly cashflow
- —
- DSCR
- —
- Eligible?
- —
No personal income docs; deal must DSCR.
Hard money
10% down · 12.0% · 12mo
- Down + closing
- —
- Monthly P&I
- —
- Monthly cashflow
- —
- DSCR
- —
- Eligible?
- —
Short-term bridge; refi at stabilization.
Rent comps 3 comps
| Address | Beds | Baths | Sqft | Rent | $/sqft | DOM | Units | Dist |
|---|---|---|---|---|---|---|---|---|
| 7249 Arbuckle Cmns Brownsburg, IN | 1.0–2.0 | 1.0–2.5 | 1548 | $2,545 | $1.64 | 0d | 19 | 0.95mi |
| 102 Murphy Ln Brownsburg, IN | 3.0 | 1.5 | 1248 | $1,775 | $1.42 | 10d | 1 | 1.34mi |
| 288 N Odell St Brownsburg, IN | 3.0 | 2.0 | 1408 | $2,000 | $1.42 | 0d | 1 | 1.50mi |
Listing history 4 events
-
2026-06-22days on market $319,900 Active 4 DOM
-
2026-06-21days on market $319,900 Active 3 DOM
-
2026-06-18remarks 634-char remark
-
2026-06-18$319,900 Active 1 DOM
ⓘ Source: listings_history table (triggers on properties + properties_extension) + one-shot
backfill from property_details.listing_events for pre-trigger history.
Tax reassessment forecast IN · Partial reset (capped growth)
- Current annual tax
- $1,417 · $118/mo
- Projected year-2 tax
- $2,068 · $172/mo
- Expected delta
- +$651/yr (+$54/mo · 46.0%)
ⓘ Screening estimate from a state-policy table — verify with the county assessor before closing.
Nearby sold comps map
Loading sold comps map…
Walkable amenities ~0.75 mi
Loading nearby amenities…
Taxation est. · year 1
- Rental income
- $27,356
- − Mortgage interest
- −$17,919
- − Property taxes
- −$1,417
- − Insurance
- −$1,600
- − Repairs & maintenance
- −$2,188
- − Management
- −$2,188
- − Depreciation
- −$9,306
- Taxable loss
- −$7,263
- Est. tax savings @ 24.0%
- +$1,743
- After-tax cash flow
- $207/yr
For passive investors: Depreciation is non-cash, so a rental often shows a tax loss while cash-flowing — sheltering income. Rental losses are passive: they offset passive income freely, and up to $25,000/yr can offset ordinary (W-2) income if you actively participate and your MAGI is under $100k (phasing out to $0 by $150k); unused losses carry forward. On sale, claimed depreciation is recaptured at up to 25%, and gains may owe capital-gains tax (a 1031 exchange can defer both). Figures are a year-1 estimate at your 24.0% rate — not tax advice; consult a CPA.
Schools (NCES district)
- District
- Brownsburg Community School Corporation
- NCES district ID
- 1801020
- Math proficiency
- 72% ▼ -5.00%
- Reading proficiency
- 72% ▼ -4.00%
- Median HH income
- $75,304
- Composite
- 63.45/100
- National rank
- #616
- State rank
- #2 of 301 in IN
Livability — Brownsburg
- Score
- 75/100
- State rank
- #61
- US rank
- #4105
Category grades
Schools grade is shown separately in the Schools card above.
Census & demographics
- County
- Hendricks County · 143,373 people
- City population
- 44,220
- Metro
- Indianapolis-Carmel-Anderson, IN
- Population (ZIP)
- 44,220
- Household income
- $112,565
- Rent vs Own
- Severe rent burden
- 614.0
Population outlook (Hendricks County) Hauer SSP2
- Today (2025)
- 187,418 people
- By 2030
- 201,494 · +7.5%
- By 2040
- 228,487 · +21.9%
- By 2050
- 253,068 · +35.0%
- By 2075
- 308,920 · +64.8%
- By 2100
- 336,510 · +79.6%
Race, ethnicity, and origin ACS 2023
- Neighborhood character
- Predominantly White (83%)
- Race & ethnicity
- White 83% Black 10% Two or more races 4% Hispanic / Latino 4%
- Common ancestry
- Slovak 3% Iranian 2% Romanian 2%
- Foreign-born
- 6% · Canada, China
- Languages at home
- 93% English-only · Spanish 2% French/Haitian/Cajun 1%
Political lean MEDSL · Hendricks
- 2024 margin
- Strong R (+21.5) · D 38.4% · R 59.9% · Other 1.7%
- 2008→2024 swing
- +1.9pp toward D · 2008: -23.4pp · 2024: -21.5pp
- All cycles
- 2024: R+21.5 2020: R+23.9 2016: R+34.2 2012: R+34.9 2008: R+23.4
Not yet ingested
- Civics
- —
Market trends
- HPI YoY
- ▼ -135.99%
- Current HPI
- 217.3787
- Rent YoY
- ▲ 6.31%
- Metro
- Indianapolis-Carmel-Anderson, IN
- State GDP YoY
- ▲ 2.90%
- F500 in state
- 18
Industry mix (Fortune 500 HQ in IN)
| Industry | F500 HQs | Revenue |
|---|---|---|
| Industrial Machinery | 2 | $37B |
|
||
| Healthcare | 1 | $177B |
|
||
| Pharmaceuticals | 1 | $45B |
|
||
| Metals / Steel | 1 | $18B |
|
||
| Agriculture | 1 | $17B |
|
||
| Packaging | 1 | $12B |
|
||
Price history
+39.1% since first listed4 events — show timeline
- 2026-06-18 Listed $319,900 MIBOR as Distributed by MLS Grid
- 2021-04-20 Sold (MLS) $237,500 MIBOR as Distributed by MLS Grid
- 2021-03-17 Pending — MIBOR as Distributed by MLS Grid
- 2021-03-13 Listed $230,000 MIBOR as Distributed by MLS Grid
Property tax history
+18.7%/yrLatest (2024): $1,417 · +6.6% YoY. Source: county tax records.
Cash-flow waterfall
monthlySold comps — $/sqft
last 12 mo · ≤1 miLoading sold comps…