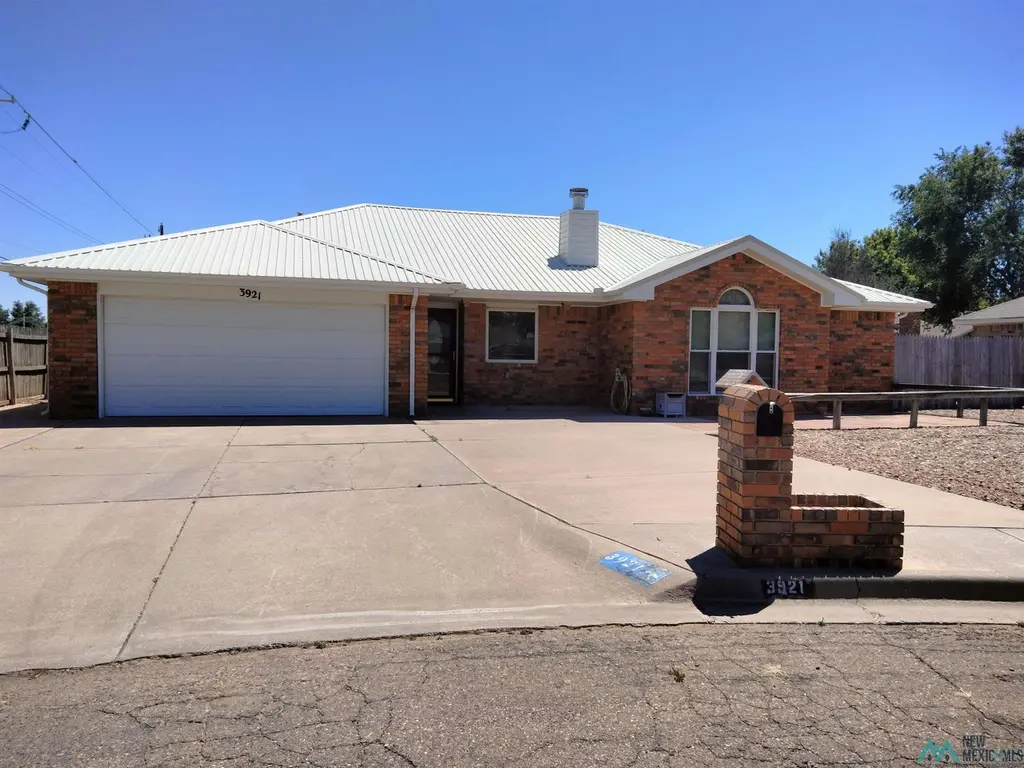
3921 Ben Hogan Dr · Clovis, NM
Flood risk 1/10 · Minimal
- FEMA flood zone
- X (unshaded)
- Chance of flooding over 30 yrs
- 0.0%
- Est. flood insurance / yr
- $507 – $1,088
Fire risk 3/10 · Minor
- Est. fire insurance / yr
- $706 – $1,312
Heat risk 4/10 · Minor
- Hot days now (above 97°F)
- 6 days/yr
- Hot days in 30 yrs
- 18 days/yr
Wind risk 2/10 · Minimal
- Chance of severe wind over 30 yrs
- —
Air-quality risk 1/10 · Minimal
- Unhealthy air days now
- 0 days/yr
- Unhealthy air days in 30 yrs
- 0 days/yr
Risk factors via First Street. Map © Google.
Why this score? — see what drove the C grade
The composite is a weighted blend of 9 inputs, each scored 0–100. Each bar is that input's sub-score; the figure is the points it added to the 100-point composite (weight × sub-score).
- Cash flow +23.3/30.0
- DSCR +7.5/10.0
- ARV discount +7.5/15.0
- 1% rule +5.1/10.0
- Rent growth +3.9/5.0
- Schools +3.4/10.0
- Livability +2.8/5.0
- Condition / age +2.5/5.0
- Appreciation +0.0/10.0
$184,000
🖨 Deal sheet 📄 Offer letter ✓ Due diligence
Listing remarks
This home is being sold "as is" . Metal roof and newer windows.
Key facts
- 8,023 sq ft lot
- 2 garage spots
- Built 1990
Neighborhood map
What this means for you Summary
Snapshot
- This is a 4-bed/2.0-bath single-family listed at $184k.
Deal economics
- At list price, monthly cash flow is $338 ($4k/yr) — positive.
- The deal already cash-flows at list — no discount required.
- Meets the 1% rule at list price ($2k rent vs $184k).
Location & tenants
- Location reads 56/100 on livability (#171 in NM) — a working-class tenant base; expect higher turnover. Strengths: cost of living A+, housing A+; Watch: health & safety C-, schools F, crime F.
- Clovis Municipal Schools (town): math 31% / reading 49% proficiency, ranked #13 of 29 in NM (top 45%) — families likely to look elsewhere, expect single-tenant / working-renter base with shorter leases; 66% free/reduced lunch — lower-income household profile, screen leases tightly.
- Market conditions: Rents rising fast (+5.5%/yr); 464 active listings in the ZIP; 3 comparable units currently listed for rent nearby; rentals lingering (median 44d on market — plan ~5-8 weeks vacancy on turnover, expect pricing pressure); 100% of comp listings sitting > 30 days — soft ceiling on asking rent; 169 units permitted in Curry County in 2024 (0 in 5+ unit buildings).
- This rent runs 39% of the median local income ($57k/yr) — at the standard rent-burdened threshold; future hikes will face affordability resistance.
Forward outlook
- Local home prices are declining (-3.0%/yr); year-one equity from $1k of loan paydown is wiped out by about $6k of value loss. Plan a longer hold.
- Curry County population projected at -13% by 2050 — secular population decline; favor cash flow + early exit over multi-decade hold.
- At projected returns (-3.0% appreciation + 5.5% rent growth), your $52k cash investment doubles in ~10 years — after that, you're playing with house money.
Negotiation context
- Only 0 days on market — expect competitive offers; lowballing is unlikely to land.
Questions for the listing agent
- Is there a deadline driving the sale (1031 exchange, divorce, estate, relocation)? That informs how much negotiation room exists.
- Schools are F-rated, which usually means shorter tenancies and higher turnover. Who's the typical renter profile here, and what's been the actual vacancy rate?
- Crime grade is F in this area — have there been break-ins, vandalism, or insurance claims at this property in the last 3 years? What carrier currently insures it and at what premium?
- What's the average days-on-market for RENTAL listings here right now (not sales)? A rising rental-DOM trend means longer vacancies and softer asking-rent achievability than the comps imply.
- What's the recent tenant-quality profile in this submarket — average credit score on applications, eviction rate, late-payment / NSF rate, and stable-employment percentage? A property-management company in the area should have these aggregated.
- How much new for-sale + rental construction is in the pipeline within 1–3 miles? Heavy new supply typically softens prices + rents 12–24 months out; constrained supply supports both.
Investment metrics
- 1% rule
- 1.01% ✓
- Cap rate
- 8.49%
- Cash-on-cash
- 7.86%
- DSCR
- 1.35
- GRM
- 8.3
CMA / ARV
No comps found within radius.
Projected returns pro-forma
-3.0% appreciation · 5.54% rent growth · sell at horizon
- IRR
- -1.8%
- Equity multiple
- 0.93×
- Total profit
- $-3,517
- Equity at exit
- $27,435
- IRR
- 10.3%
- Equity multiple
- 1.88×
- Total profit
- $45,387
- Equity at exit
- $15,909
Cash invested: $51,520 (down + closing). Projections, not guarantees.
Landlord ↔ Tenant lean methodology
- Overall (STATE)
- 55 Moderately Landlord-Leaning
- State New Mexico
- 55 Moderately Landlord-Leaning · D+3
- County
- — inherits STATE
- City
- — inherits STATE
ZIP-level market 88101
- Rents YoY
- 5.5%
- Active inventory
- 464
- Price-to-rent
- 8.3×
Monthly cashflow live
- Estimated rent
- $1,855 medium interval (Pro) →
- Mortgage (P&I)
- −$965
- Tax from tax record
- −$86 /mo · $1,035/yr
- Insurance
- −$77
- HOA
- −$0
- Vacancy / Maint / Mgmt
- −$390
- Net cashflow
- $338
Break-even live
UW: 25.0% down · 7.5% · 30yr · 1.5% tax · 5.0% vac · 8.0% maint · 8.0% mgmt
Financing live
Cash to close
- Down payment
- $46,000
- Closing costs
- $5,520
- Reserves months
- —
- Total cash needed
- —
Loan-product check · same deal, 3 products live
Conventional
25% down · 7.5% · 30yr
- Down + closing
- —
- Monthly P&I
- —
- Monthly cashflow
- —
- DSCR
- —
- Eligible?
- —
Personal DTI + credit; lowest rate.
DSCR
20% down · 8.5% · 30yr
- Down + closing
- —
- Monthly P&I
- —
- Monthly cashflow
- —
- DSCR
- —
- Eligible?
- —
No personal income docs; deal must DSCR.
Hard money
10% down · 12.0% · 12mo
- Down + closing
- —
- Monthly P&I
- —
- Monthly cashflow
- —
- DSCR
- —
- Eligible?
- —
Short-term bridge; refi at stabilization.
Rent comps 3 comps
| Address | Beds | Baths | Sqft | Rent | $/sqft | DOM | Units | Dist |
|---|---|---|---|---|---|---|---|---|
| 3804 Ben Hogan Dr Clovis, NM | 3.0 | 2.0 | 1900 | $1,900 | $1.00 | 44d | 1 | 0.11mi |
| 112 Cades Ct Clovis, NM | 3.0 | 2.0 | 1478 | $1,800 | $1.22 | 43d | 1 | 0.19mi |
| 37 Paseo Vlg Clovis, NM | 3.0 | 2.0 | 1564 | $1,600 | $1.02 | 43d | 1 | 0.64mi |
Listing history 2 events
-
2026-05-12$184,000
-
2026-05-12historical
ⓘ Source: listings_history table (triggers on properties + properties_extension) + one-shot
backfill from property_details.listing_events for pre-trigger history.
Tax reassessment forecast NM · Resets to sale price
- Current annual tax
- $1,035 · $86/mo
- Projected year-2 tax
- $1,472 · $123/mo
- Expected delta
- +$437/yr (+$36/mo · 42.2%)
ⓘ Screening estimate from a state-policy table — verify with the county assessor before closing.
Climate risk First Street
- Flood 1/10 Low FEMA zone X (unshaded) · 0% chance over 30 yrs
- Wildfire 3/10 Moderate
- Heat 4/10 Moderate 6 d/yr ≥97°F today · 18 d/yr by 30 yrs out
- Wind 2/10 Low
- Air quality 1/10 Low 0 unhealthy d/yr today · 0 by 30 yrs out
Nearby sold comps map
Loading sold comps map…
Walkable amenities ~0.75 mi
Loading nearby amenities…
Taxation est. · year 1
- Rental income
- $22,259
- − Mortgage interest
- −$10,307
- − Property taxes
- −$1,035
- − Insurance
- −$920
- − Repairs & maintenance
- −$1,781
- − Management
- −$1,781
- − Depreciation
- −$5,353
- Taxable income
- $1,083
- Est. tax owed @ 24.0%
- −$260
- After-tax cash flow
- $3,791/yr
For passive investors: Depreciation is non-cash, so a rental often shows a tax loss while cash-flowing — sheltering income. Rental losses are passive: they offset passive income freely, and up to $25,000/yr can offset ordinary (W-2) income if you actively participate and your MAGI is under $100k (phasing out to $0 by $150k); unused losses carry forward. On sale, claimed depreciation is recaptured at up to 25%, and gains may owe capital-gains tax (a 1031 exchange can defer both). Figures are a year-1 estimate at your 24.0% rate — not tax advice; consult a CPA.
Schools (NCES district)
- District
- Clovis Municipal Schools
- NCES district ID
- 3500570
- Math proficiency
- 31% ▲ 6.00%
- Reading proficiency
- 49% ▲ 14.00%
- Median HH income
- $40,532
- Composite
- 33.52/100
- National rank
- #5435
- State rank
- #13 of 29 in NM
Livability — Clovis
- Score
- 56/100
- State rank
- #171
- US rank
- #22374
Category grades
Schools grade is shown separately in the Schools card above.
Census & demographics
- Census place
- Clovis, NM
- County
- Curry County · 44,846 people
- City population
- 44,846
- Metro
- Clovis, NM
- Population (ZIP)
- 44,846
- Household income
- $56,587
- Rent vs Own
- Severe rent burden
- 1724.0
Population outlook (Curry County) Hauer SSP2
- Today (2025)
- 48,742 people
- By 2030
- 47,759 · -2.0%
- By 2040
- 45,444 · -6.8%
- By 2050
- 42,403 · -13.0%
- By 2075
- 33,878 · -30.5%
- By 2100
- 22,414 · -54.0%
Race, ethnicity, and origin ACS 2023
- Neighborhood character
- Diverse neighborhood (Simpson 0.60)
- Race & ethnicity
- Hispanic / Latino 47% White 42% Two or more races 14% Black 5% Asian 2% Native American 1%
- Hispanic origin (detail)
- Mexican 36%
- Common ancestry
- Slovak 2% Romanian 2% Lithuanian 1%
- Foreign-born
- 8% · Canada
- Languages at home
- 73% English-only · Spanish 25%
Political lean MEDSL · Curry
- 2024 margin
- Solid R (+42.6) · D 27.8% · R 70.4% · Other 1.8%
- 2008→2024 swing
- -8.5pp toward R · 2008: -34.1pp · 2024: -42.6pp
- All cycles
- 2024: R+42.6 2020: R+40.6 2016: R+42.4 2012: R+38.6 2008: R+34.1
Not yet ingested
- Civics
- —
Market trends
- HPI YoY
- ▼ -150.79%
- Current HPI
- 121.1877
- Rent YoY
- ▲ 5.54%
- Metro
- Clovis, NM
- State GDP YoY
- —
- F500 in state
- 0
Price history
2 events — show timeline
- 2026-05-12 Delisted — NMMLS
- 2026-05-12 Listed $184,000 NMMLS
Property tax history
+4.3%/yrLatest (2025): $1,035 · -9.4% YoY. Source: county tax records.
Cash-flow waterfall
monthlySold comps — $/sqft
last 12 mo · ≤1 miLoading sold comps…