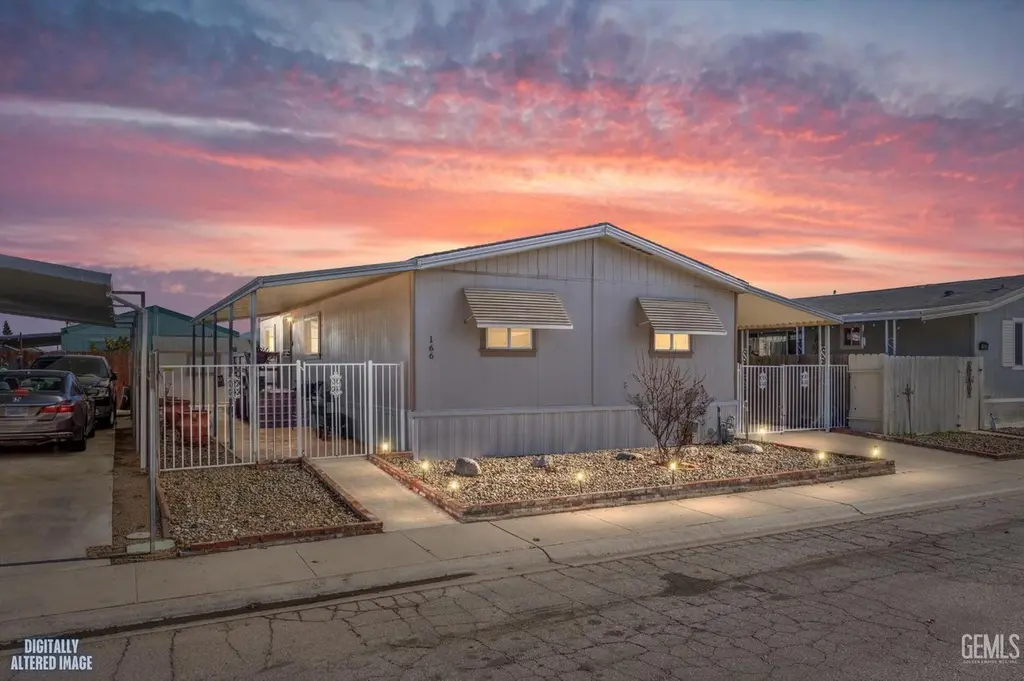
1301 Taft Hwy #166 · Bakersfield, CA
Flood risk 1/10 · Minimal
- FEMA flood zone
- X (unshaded)
- Chance of flooding over 30 yrs
- 0.0%
- Est. flood insurance / yr
- $507 – $1,088
Fire risk 1/10 · Minimal
- Est. fire insurance / yr
- $659 – $1,223
Heat risk 8/10 · Major
- Hot days now (above 104°F)
- 7 days/yr
- Hot days in 30 yrs
- 18 days/yr
Wind risk 1/10 · Minimal
- Chance of severe wind over 30 yrs
- —
Air-quality risk 10/10 · Severe
- Unhealthy air days now
- 33 days/yr
- Unhealthy air days in 30 yrs
- 37 days/yr
Risk factors via First Street. Map © Google.
Why this score? — see what drove the D+ grade
The composite is a weighted blend of 9 inputs, each scored 0–100. Each bar is that input's sub-score; the figure is the points it added to the 100-point composite (weight × sub-score).
- Cash flow +14.2/30.0
- 1% rule +10.0/10.0
- DSCR +4.3/10.0
- ARV discount +4.1/15.0
- Rent growth +3.9/5.0
- Schools +3.4/10.0
- Livability +2.9/5.0
- Condition / age +2.5/5.0
- Appreciation +0.0/10.0
$105,900
🖨 Deal sheet (PDF) 📄 Offer letter ✓ Due diligence
Listing remarks
Back on the market with updated flooring!! Don't miss this incredible opportunity to own a well-maintained 3-bedroom, 2-bathroom home in the highly desirable Southland Mobile Home Park in Bakersfield! Fresh updated new carpet in bedrooms! This charming home is move-in ready and features a newer HVAC system to keep you cool during those hot summer days. Newer carpet in all bedrooms Enjoy all the fantastic amenities this family-friendly park has to offer, including a sparkling community pool to cool off and a relaxing hot tub to unwind. Conveniently located near shopping, dining, and schools, this home is a must-see. Schedule your showing today! & #127969; & #10024;
Key facts
- Hot tub
- Community pool
- Newer hvac system
Tags
Property features AI
Finance
- HOA & community: Southland Mobile Home Park HOA; Association clubhouse and recreation; Association pool; HOA fee of $825 per month
Exterior
- Parking: Carport
- Utilities: Sewer service
- Home design: Manufactured/mobile home; Owner-occupied
- Construction: Composition roof
- Exterior features: Covered patio; Community pool; Located in a mobile home zoning area (MH); Leased space
Interior
- Kitchen: Range/oven
- Bathrooms: 2 full bathrooms
- Heating & cooling: Central A/C; Central heat
- Interior features: Formal living room; Breakfast area; Range/oven
Neighborhood map
What this means for you Summary
Snapshot
- This is a 3-bed/2.0-bath manufactured listed at $106k.
Deal economics
- At list price, monthly cash flow is $18 ($219/yr) — positive.
- The deal already cash-flows at list — no discount required.
- Meets the 1% rule at list price ($2k rent vs $106k).
- Recommended offer: $103k (3.0% below list) — sets the bar for market timing.
- Cap rate 6.5% vs local median 3.6% in Bakersfield — top-decile yield for the area; either an underpriced asset or a hidden risk that comps aren't pricing in. Stress-test before assuming the spread holds.
Location & tenants
- Location reads 58/100 on livability (#716 in CA) — a working-class tenant base; expect higher turnover. Strengths: housing A+; Watch: health & safety D, crime F, amenities F.
- Kern High (urban): math 21% / reading 51% proficiency, ranked #860 of 1,400 in CA (top 61%) — families likely to look elsewhere, expect single-tenant / working-renter base with shorter leases.
- Zoned schools: Ridgeview High (reading 95%, 2,688 students, 74% FRL).
- Market conditions: Rents rising fast (+5.7%/yr); 314 active listings in the ZIP; 11 comparable units currently listed for rent nearby; rentals leasing fast (median 13d on market — plan ~1-2 weeks tenant-placement turnaround); 3,244 units permitted in Kern County in 2024 (73 in 5+ unit buildings).
- This rent runs 41% of the median local income ($56k/yr) — at the standard rent-burdened threshold; future hikes will face affordability resistance.
Forward outlook
- Local home prices are declining (-3.0%/yr); year-one equity from $732 of loan paydown is wiped out by about $3k of value loss. Plan a longer hold.
- Kern County population projected at +17% by 2050 — long-run rental-demand tailwind backs the buy-and-hold thesis.
Negotiation context
- It's been on market 33 days — a 3% lower offer ($103k) is reasonable based on typical stale-listing flexibility.
- 8 sale attempts since 3y ago with the ask held roughly flat each time — persistent listings suggest the price (not the market) is what's stuck; bring a comps-based counter.
Risks & watch-outs
- Watch-outs: HOA is 43% of rent.
- Climate carrying-cost: extreme-heat days projected 7→18/yr by 2055 (HVAC capex compounding) — expect insurance premiums to compound above CPI over the hold.
Questions for the listing agent
- It's been on market 33 days. Have you received any prior offers? Is the seller open to a 3% concession, seller financing, or rate buy-down credit?
- What does the HOA fee cover, when was the last increase, and are there any pending special assessments or reserve-fund shortfalls?
- Is there a deadline driving the sale (1031 exchange, divorce, estate, relocation)? That informs how much negotiation room exists.
- Schools are D-rated, which usually means shorter tenancies and higher turnover. Who's the typical renter profile here, and what's been the actual vacancy rate?
- Crime grade is F in this area — have there been break-ins, vandalism, or insurance claims at this property in the last 3 years? What carrier currently insures it and at what premium?
- The area grade is low — what's the realistic commute time and amenity access for the typical tenant pool here? Any planned neighborhood developments (good or bad) we should know about?
- What's the average days-on-market for RENTAL listings here right now (not sales)? A rising rental-DOM trend means longer vacancies and softer asking-rent achievability than the comps imply.
- What's the recent tenant-quality profile in this submarket — average credit score on applications, eviction rate, late-payment / NSF rate, and stable-employment percentage? A property-management company in the area should have these aggregated.
- How much new for-sale + rental construction is in the pipeline within 1–3 miles? Heavy new supply typically softens prices + rents 12–24 months out; constrained supply supports both.
Investment metrics
- 1% rule
- 1.83% ✓
- Cap rate
- 6.50%
- Cash-on-cash
- 0.74%
- DSCR
- 1.03
- GRM
- 4.5
CMA / ARV
- ARV (median comp)
- $98,560
- List price
- $105,900
- Delta
- 7.45%
- Verdict
- FAIR
- Comps
- 5 within 1.0 mi
Show comp detail 8 sales within ~0.75 mi
| Address | Dist | Beds/Ba | Sqft | Sold | Price | $/sf | Match |
|---|---|---|---|---|---|---|---|
| 1301 Taft Hwy #58 | 0.00mi | 3/2.0 | 1,152 (0%) | 9mo | $100,000 | $87 | 93 |
| 1301 Taft Hwy #163 | 0.00mi | 3/1.8 | 1,152 (0%) | 16mo | $60,000 | $52 | 86 |
| 1301 Taft Hwy #31 | 0.00mi | 3/2.0 | 1,120 (-3%) | 14mo | $130,000 | $116 | 84 |
| 1301 Taft #91 | 0.00mi | 3/2.0 | 1,243 (+8%) | 6mo | $75,000 | $60 | 82 |
| 1301 Taft Hwy #50 | 0.00mi | 3/2.0 | 1,056 (-8%) | 7mo | $109,900 | $104 | 80 |
| 1301 Taft Hwy #99 | 0.00mi | 3/2.0 | 1,034 (-10%) | 22mo | $95,900 | $93 | 65 |
| 1301 Taft Hwy #96 | 0.11mi | 3/2.0 | 1,316 (+14%) | 9mo | $99,900 | $76 | 64 |
| 1225 Taft Hwy #19 | 0.20mi | 2/2.0 (-1) | 1,058 (-8%) | 23mo | $65,000 | $61 | 53 |
Match score weights: distance 35% · size 25% · config 20% · recency 20%. Top-matched comps best support the ARV.
Projected returns pro-forma
-3.0% appreciation · 5.71% rent growth · sell at horizon
- IRR
- -8.7%
- Equity multiple
- 0.66×
- Total profit
- $-10,050
- Equity at exit
- $15,790
- IRR
- 6.7%
- Equity multiple
- 1.62×
- Total profit
- $18,402
- Equity at exit
- $9,156
Cash invested: $29,652 (down + closing). Projections, not guarantees.
Landlord ↔ Tenant lean methodology
- Overall (STATE)
- 18 Strongly Tenant-Friendly
- State California
- 18 Strongly Tenant-Friendly · D+13
- County
- — inherits STATE
- City
- — inherits STATE
ZIP-level market 93307
- Rents YoY
- 5.7%
- Active inventory
- 314
- Price-to-rent
- 4.5×
Monthly cashflow live
- Estimated rent
- $1,941 high interval (Pro) →
- Mortgage (P&I)
- −$555
- Tax from tax record
- −$91 /mo · $1,087/yr
- Insurance
- −$44
- HOA
- −$825
- Vacancy / Maint / Mgmt
- −$408
- Net cashflow
- $18
Break-even live
Sensitivity live
| Price | -10% $78 | -5% $48 | +0% $18 | +5% $-12 | +10% $-42 |
|---|---|---|---|---|---|
| Rent | -10% $-135 | -5% $-58 | +0% $18 | +5% $95 | +10% $172 |
| Rate | -1.0pp $72 | -0.5pp $45 | base $18 | +0.5pp $-9 | +1.0pp $-37 |
UW: 25.0% down · 7.5% · 30yr · 1.5% tax · 5.0% vac · 8.0% maint · 8.0% mgmt
Financing live
Cash to close
- Down payment
- $26,475
- Closing costs
- $3,177
- Reserves months
- —
- Total cash needed
- —
Loan-product check · same deal, 3 products live
Conventional
25% down · 7.5% · 30yr
- Down + closing
- —
- Monthly P&I
- —
- Monthly cashflow
- —
- DSCR
- —
- Eligible?
- —
Personal DTI + credit; lowest rate.
DSCR
20% down · 8.5% · 30yr
- Down + closing
- —
- Monthly P&I
- —
- Monthly cashflow
- —
- DSCR
- —
- Eligible?
- —
No personal income docs; deal must DSCR.
Hard money
10% down · 12.0% · 12mo
- Down + closing
- —
- Monthly P&I
- —
- Monthly cashflow
- —
- DSCR
- —
- Eligible?
- —
Short-term bridge; refi at stabilization.
Rent comps 11 comps
| Address | Beds | Baths | Sqft | Rent | $/sqft | DOM | Units | Dist |
|---|---|---|---|---|---|---|---|---|
| 1408 Interlaken Dr Bakersfield, CA | 3.0 | 2.0 | 1159 | $2,250 | $1.94 | 23d | 1 | 1.00mi |
| 8914 S Union Ave Bakersfield, CA | 3.0 | 2.0 | 1500 | $1,950 | $1.30 | 4d | 1 | 1.10mi |
| 600 Hosking Ave Unit 75B Bakersfield, CA | 2.0 | 1.5 | 1008 | $1,650 | $1.64 | 23d | 1 | 1.38mi |
| 600 Hosking Ave Unit 47B Bakersfield, CA | 2.0 | 1.5 | 1008 | $1,650 | $1.64 | 12d | 1 | 1.38mi |
| 600 Hosking Ave Unit 56A Bakersfield, CA | 3.0 | 2.0 | 1200 | $1,750 | $1.46 | 4d | 1 | 1.38mi |
| 600 Hosking Ave Unit 51D Bakersfield, CA | 3.0 | 2.0 | 1200 | $1,800 | $1.50 | 5d | 1 | 1.38mi |
| 600 Hosking Ave Unit 73D Bakersfield, CA | 3.0 | 2.0 | 1230 | $1,850 | $1.50 | 45d | 1 | 1.38mi |
| 600 Hosking Ave Unit 43B Bakersfield, CA | 2.0 | 1.5 | 1050 | $1,650 | $1.57 | 45d | 1 | 1.38mi |
| 600 Hosking Ave Apt 69A Bakersfield, CA | 3.0 | 2.0 | 1208 | $1,850 | $1.53 | 21d | 1 | 1.38mi |
| 600 Hosking Ave Unit 47C Bakersfield, CA | 2.0 | 1.5 | 1008 | $1,650 | $1.64 | 4d | 1 | 1.38mi |
| 1305 Quartz Hill Rd Bakersfield, CA | 3.0 | 2.0 | 1351 | $2,250 | $1.67 | 4d | 1 | 1.45mi |
HOA detail
- Monthly dues
- $825 · $9,900/yr
- Likely covers
- pool
Listing history 31 events
-
2026-06-21days on market $105,900 Active 33 DOM
-
2026-06-18days on market $105,900 Active 30 DOM
-
2026-06-17days on market $105,900 Active 29 DOM
-
2026-06-16days on market $105,900 Active 28 DOM
-
2026-06-15days on market $105,900 Active 27 DOM
-
2026-06-14days on market $105,900 Active 25 DOM
-
2026-06-13remarks 673-char remark
-
2026-06-13days on market $105,900 Active 24 DOM
-
2026-06-03days on market $105,900 Active 21 DOM
-
2026-06-03days on market $105,900 Active 20 DOM
-
2026-06-01days on market $105,900 Active 19 DOM
-
2026-05-31days on market $105,900 Active 18 DOM
-
2026-05-13$105,900 Active 613-char remark
-
2026-04-20price $105,900
-
2026-03-16price $113,900
-
2026-01-05price $114,500
-
2025-12-30$116,000 Active
-
2025-09-06price $116,000
-
2025-08-26status Active
-
2025-08-16status Pending
-
2025-06-28$116,500 Active
-
2025-05-15price $117,500
-
2025-04-21status Active
-
2025-02-28price $119,000
-
2025-02-11price $121,500
-
2025-02-05price $123,000
-
2025-01-30$130,000 Active
-
2023-07-28soldstatus $100,000 Sold
-
2023-07-02status Pending
-
2023-06-20price $109,500
-
2023-04-20$115,000 Active
ⓘ Source: listings_history table (triggers on properties + properties_extension) + one-shot
backfill from property_details.listing_events for pre-trigger history.
Tax reassessment forecast CA · Resets to sale price
- Current annual tax
- $1,087 · $91/mo
- Projected year-2 tax
- $1,087 · $91/mo
- Expected delta
- $0/yr ($0/mo · 0.0%)
ⓘ Screening estimate from a state-policy table — verify with the county assessor before closing.
Climate risk First Street
- Flood 1/10 Low FEMA zone X (unshaded) · 0% chance over 30 yrs
- Wildfire 1/10 Low
- Heat 8/10 Severe 7 d/yr ≥104°F today · 18 d/yr by 30 yrs out
- Wind 1/10 Low
- Air quality 10/10 Extreme 33 unhealthy d/yr today · 37 by 30 yrs out
Nearby sold comps map
Loading sold comps map…
Walkable amenities ~0.75 mi
Loading nearby amenities…
Taxation est. · year 1
- Rental income
- $23,291
- − Mortgage interest
- −$5,932
- − Property taxes
- −$1,087
- − Insurance
- −$530
- − Repairs & maintenance
- −$1,863
- − Management
- −$1,863
- − HOA
- −$9,900
- − Depreciation
- −$3,081
- Taxable loss
- −$965
- Est. tax savings @ 24.0%
- +$232
- After-tax cash flow
- $451/yr
For passive investors: Depreciation is non-cash, so a rental often shows a tax loss while cash-flowing — sheltering income. Rental losses are passive: they offset passive income freely, and up to $25,000/yr can offset ordinary (W-2) income if you actively participate and your MAGI is under $100k (phasing out to $0 by $150k); unused losses carry forward. On sale, claimed depreciation is recaptured at up to 25%, and gains may owe capital-gains tax (a 1031 exchange can defer both). Figures are a year-1 estimate at your 24.0% rate — not tax advice; consult a CPA.
Schools (NCES district)
- District
- Kern High
- NCES district ID
- 0619540
- Math proficiency
- 21% ▬ 0.00%
- Reading proficiency
- 51% ▲ 2.00%
- Median HH income
- $49,686
- Composite
- 33.68/100
- National rank
- #10443
- State rank
- #860 of 1400 in CA
Livability — Bakersfield
- Score
- 58/100
- State rank
- #716
- US rank
- #21355
Category grades
Schools grade is shown separately in the Schools card above.
Census & demographics
- Census place
- Bakersfield, CA
- County
- Kern County · 710,371 people
- City population
- 499,124
- Metro
- Bakersfield, CA
- Population (ZIP)
- 85,945
- Household income
- $56,446
- Rent vs Own
- Severe rent burden
- 3246.0
Population outlook (Kern County) Hauer SSP2
- Today (2025)
- 947,286 people
- By 2030
- 978,984 · +3.3%
- By 2040
- 1,045,018 · +10.3%
- By 2050
- 1,105,232 · +16.7%
- By 2075
- 1,229,538 · +29.8%
- By 2100
- 1,238,059 · +30.7%
Race, ethnicity, and origin ACS 2023
- Neighborhood character
- Predominantly Hispanic (80%)
- Race & ethnicity
- Hispanic / Latino 80% Two or more races 12% White 10% Black 6% Asian 3% Native American 1%
- Hispanic origin (detail)
- Mexican 73%
- Common ancestry
- Lithuanian 0%
- Foreign-born
- 31% · Canada
- Languages at home
- 28% English-only · Spanish 69% Other Indo-European 1% Arabic 1%
Political lean MEDSL · Kern
- 2024 margin
- Strong R (+21.1) · D 38.2% · R 59.3% · Other 2.5%
- 2008→2024 swing
- -3.3pp toward R · 2008: -17.8pp · 2024: -21.1pp
- All cycles
- 2024: R+21.1 2020: R+10.2 2016: R+15.0 2012: R+20.9 2008: R+17.8
Not yet ingested
- Civics
- —
Market trends
- HPI YoY
- ▼ -263.59%
- Current HPI
- 447.1746
- Rent YoY
- ▲ 5.71%
- Metro
- Bakersfield, CA
- State GDP YoY
- ▲ 3.21%
- F500 in state
- 116
Industry mix (Fortune 500 HQ in CA)
| Industry | F500 HQs | Revenue |
|---|---|---|
| Technology | 27 | $1,492B |
|
||
| Financial Services | 3 | $174B |
|
||
| Retail | 3 | $44B |
|
||
| Insurance | 3 | $26B |
|
||
| Media / Entertainment | 2 | $115B |
|
||
| Pharmaceuticals / Biotech | 2 | $62B |
|
||
Price history
-7.9% since first listed20 events — show timeline
- 2026-06-10 Relisted — GEMLS
- 2026-05-13 Listed $105,900 GEMLS
- 2026-04-20 Price Changed $105,900 GEMLS
- 2026-03-16 Price Changed $113,900 GEMLS
- 2026-01-05 Price Changed $114,500 GEMLS
- 2025-12-30 Listed $116,000 GEMLS
- 2025-09-06 Price Changed $116,000 GEMLS
- 2025-08-26 Relisted — GEMLS
- 2025-08-16 Pending — GEMLS
- 2025-06-28 Listed $116,500 GEMLS
- 2025-05-15 Price Changed $117,500 GEMLS
- 2025-04-21 Relisted — GEMLS
- 2025-02-28 Price Changed $119,000 GEMLS
- 2025-02-11 Price Changed $121,500 GEMLS
- 2025-02-05 Price Changed $123,000 GEMLS
- 2025-01-30 Listed $130,000 GEMLS
- 2023-07-28 Sold (MLS) $100,000 GEMLS
- 2023-07-02 Pending — GEMLS
- 2023-06-20 Price Changed $109,500 GEMLS
- 2023-04-20 Listed $115,000 GEMLS
Property tax history
+21.5%/yrLatest (2025): $1,087 · +601.7% YoY. Source: county tax records.
Cash-flow waterfall
monthlySold comps — $/sqft
last 12 mo · ≤1 miLoading sold comps…