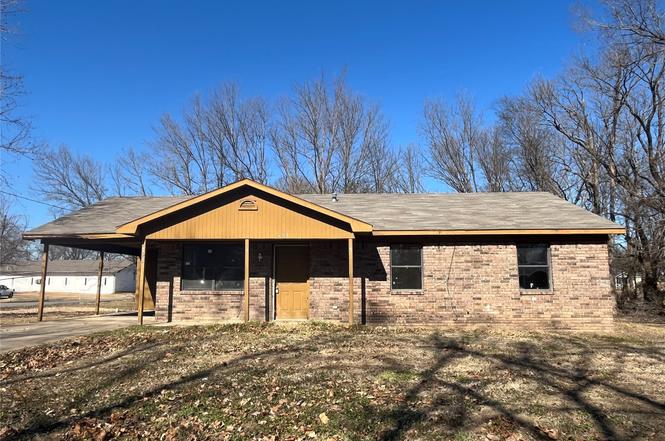
419 SW 5th St · Spiro, OK
Flood risk 1/10 · Minimal
- FEMA flood zone
- A
- Chance of flooding over 30 yrs
- 0.0%
- Est. flood insurance / yr
- $1,009 – $1,996
Fire risk 6/10 · Moderate
- Est. fire insurance / yr
- $2,463 – $4,575
Heat risk 6/10 · Moderate
- Hot days now (above 112°F)
- 7 days/yr
- Hot days in 30 yrs
- 19 days/yr
Wind risk 3/10 · Minor
- Chance of severe wind over 30 yrs
- 5.0%
Air-quality risk 2/10 · Minimal
- Unhealthy air days now
- 1 days/yr
- Unhealthy air days in 30 yrs
- 1 days/yr
Risk factors via First Street. Map © Google.
Why this score? — see what drove the B grade
The composite is a weighted blend of 9 inputs, each scored 0–100. Each bar is that input's sub-score; the figure is the points it added to the 100-point composite (weight × sub-score).
- Cash flow +27.4/30.0
- ARV discount +15.0/15.0
- DSCR +9.6/10.0
- 1% rule +6.6/10.0
- Appreciation +5.0/10.0
- Livability +3.1/5.0
- Rent growth +2.5/5.0
- Condition / age +2.5/5.0
- Schools +1.6/10.0
$72,485
🖨 Deal sheet 📄 Offer letter ✓ Due diligence
Listing remarks
AS IS, WHERE IS condition without warranties. This spacious, brick home in Spiro is convenient to Poteau and Fort Smith, Arkansas. Living, dining and kitchen are comfortably spaced out. 3 bedrooms and 1 full bath makes this an ideal floorplan. Carport has additional utility room for convenience and storage. Corner lot is spacious and convenient to school and town. Great for investors or owner occupied fixer upper! Offered through Homes 4 Purchase auction site. Read all disclaimers thoroughly.
Key facts
- Utility room
- Brick home
- Corner lot
Tags
Property features AI
Exterior
- Parking: 1-car garage; Carport; Driveway
- Security: No safety shelter
- Utilities: Public water; Public sewer
- Home design: Single-story
- Construction: Built (year per public records); Wood frame construction; Asphalt/fiberglass roof
- Exterior features: Corner lot; Faces south; No safety shelter
Interior
- Bathrooms: 1 full bathroom; 1 half bathroom
- Interior features: Other interior features (unspecified)
Neighborhood map
What this means for you Summary
Snapshot
- This is a 3-bed/1.0-bath single-family listed at $72k.
Deal economics
- At list price, monthly cash flow is $87 ($1k/yr) — positive.
- The deal already cash-flows at list — no discount required.
- Meets the 1% rule at list price ($839 rent vs $72k).
- Recommended offer: $68k (6.0% below list) — sets the bar for market timing.
Location & tenants
- Location reads 61/100 on livability (#275 in OK) — a middle-class / working-renter tenant base. Strengths: cost of living A+, housing A+, crime B+; Watch: schools F, amenities F, commute F.
- Spiro (rural): math 18% / reading 21% proficiency, ranked #178 of 270 in OK (top 66%) — low school quality limits family demand, transient renter base, plan for 1-2y turnover; 62% free/reduced lunch — lower-income household profile, screen leases tightly.
- Market conditions: 65 active listings in the ZIP; 4 comparable units currently listed for rent nearby; rentals leasing fast (median 13d on market — plan ~1-2 weeks tenant-placement turnaround); 73 units permitted in Le Flore County in 2024 (0 in 5+ unit buildings).
Forward outlook
- In year one you build about $3k of equity ($501 loan paydown + $2k appreciation (3.0% local appreciation)).
- Le Flore County population projected at -13% by 2050 — secular population decline; favor cash flow + early exit over multi-decade hold.
- At projected returns (3.0% appreciation + 3.0% rent growth), your $20k cash investment doubles in ~5 years — after that, you're playing with house money.
Negotiation context
- It's been on market 77 days — a 6% lower offer ($68k) is reasonable based on typical stale-listing flexibility.
- 2 sale attempts; this cycle's ask has dropped $8k (10%) from the opening price — seller is motivated, your offer sets the floor, not the list.
Risks & watch-outs
- Watch-outs: flood insurance adds $125/mo.
- Climate carrying-cost: in FEMA flood zone A (mandatory federal flood insurance); major wildfire risk; extreme-heat days projected 7→19/yr by 2055 (HVAC capex compounding) — expect insurance premiums to compound above CPI over the hold.
Questions for the listing agent
- It's been on market 77 days. Have you received any prior offers? Is the seller open to a 6% concession, seller financing, or rate buy-down credit?
- What's the actual annual flood-insurance premium (NFIP or private), and is the property in a SFHA with mandatory coverage?
- Why hasn't it sold? Are there any deal-killer items the seller is aware of (foundation, flood, title, zoning, code violations)?
- Is there a deadline driving the sale (1031 exchange, divorce, estate, relocation)? That informs how much negotiation room exists.
- Schools are F-rated, which usually means shorter tenancies and higher turnover. Who's the typical renter profile here, and what's been the actual vacancy rate?
- What's the average days-on-market for RENTAL listings here right now (not sales)? A rising rental-DOM trend means longer vacancies and softer asking-rent achievability than the comps imply.
- What's the recent tenant-quality profile in this submarket — average credit score on applications, eviction rate, late-payment / NSF rate, and stable-employment percentage? A property-management company in the area should have these aggregated.
- How much new for-sale + rental construction is in the pipeline within 1–3 miles? Heavy new supply typically softens prices + rents 12–24 months out; constrained supply supports both.
Investment metrics
- 1% rule
- 1.16% ✓
- Cap rate
- 9.81%
- Cash-on-cash
- 12.56%
- DSCR
- 1.56
- GRM
- 7.2
CMA / ARV
- ARV (on-the-fly)
- $126,113
- Comps found
- 12
Show comp detail 12 sales within ~0.75 mi
| Address | Dist | Beds/Ba | Sqft | Sold | Price | $/sf | Match |
|---|---|---|---|---|---|---|---|
| 616 S Columbus St | 0.17mi | 3/2.0 | 1,213 (+5%) | 2mo | $138,000 | $114 | 79 |
| 510 NW 2nd St | 0.37mi | 3/2.0 | 1,101 (-5%) | 1mo | $120,000 | $109 | 70 |
| 211 E Broadway St | 0.48mi | 3/1.0 | 1,144 (-1%) | 8mo | $135,000 | $118 | 70 |
| 320 S Ash St | 0.36mi | 3/1.0 | 1,253 (+8%) | 3mo | $35,000 | $28 | 67 |
| 414 N Boston St | 0.54mi | 3/1.5 | 1,162 (+0%) | 16mo | $119,000 | $102 | 59 |
| 320 S Alaska St | 0.22mi | 3/2.0 | 1,300 (+12%) | 11mo | $44,000 | $34 | 56 |
| 113 N Boston St | 0.33mi | 3/2.0 | 1,228 (+6%) | 18mo | $149,000 | $121 | 55 |
| 201 NW 4th | 0.53mi | 2/1.0 (-1) | 1,170 (+1%) | 16mo | $62,000 | $53 | 55 |
| 511 SE 4th St | 0.54mi | 3/1.0 | 1,252 (+8%) | 14mo | $30,000 | $24 | 50 |
| 417 NE 2nd St | 0.63mi | 2/2.0 (-1) | 1,160 (+0%) | 16mo | $54,000 | $47 | 48 |
| 317 NE 5th St | 0.74mi | 3/2.0 | 1,290 (+12%) | 1mo | $157,500 | $122 | 42 |
| 1103 Sequoyah St | 0.74mi | 3/2.0 | 1,277 (+10%) | 17mo | $195,000 | $153 | 30 |
Match score weights: distance 35% · size 25% · config 20% · recency 20%. Top-matched comps best support the ARV.
Projected returns pro-forma
3.0% appreciation · 3.0% rent growth · sell at horizon
- IRR
- 12.4%
- Equity multiple
- 1.71×
- Total profit
- $14,345
- Equity at exit
- $32,592
- IRR
- 14.4%
- Equity multiple
- 3.14×
- Total profit
- $43,373
- Equity at exit
- $50,229
Cash invested: $20,296 (down + closing). Projections, not guarantees.
Landlord ↔ Tenant lean methodology
- Overall (STATE)
- 83 Strongly Landlord-Friendly
- State Oklahoma
- 83 Strongly Landlord-Friendly · R+20
- County
- — inherits STATE
- City
- — inherits STATE
ZIP-level market 74959
- Active inventory
- 65
- Price-to-rent
- 7.2×
Monthly cashflow live
- Estimated rent
- $839 medium interval (Pro) →
- Mortgage (P&I)
- −$380
- Tax from tax record
- −$40 /mo · $481/yr
- Insurance
- −$30
- Flood insurance flood zone
- −$125 /mo · $1,502/yr
- HOA
- −$0
- Vacancy / Maint / Mgmt
- −$176
- Net cashflow
- $87
Break-even live
UW: 25.0% down · 7.5% · 30yr · 1.5% tax · 5.0% vac · 8.0% maint · 8.0% mgmt
Financing live
Cash to close
- Down payment
- $18,121
- Closing costs
- $2,175
- Reserves months
- —
- Total cash needed
- —
Loan-product check · same deal, 3 products live
Conventional
25% down · 7.5% · 30yr
- Down + closing
- —
- Monthly P&I
- —
- Monthly cashflow
- —
- DSCR
- —
- Eligible?
- —
Personal DTI + credit; lowest rate.
DSCR
20% down · 8.5% · 30yr
- Down + closing
- —
- Monthly P&I
- —
- Monthly cashflow
- —
- DSCR
- —
- Eligible?
- —
No personal income docs; deal must DSCR.
Hard money
10% down · 12.0% · 12mo
- Down + closing
- —
- Monthly P&I
- —
- Monthly cashflow
- —
- DSCR
- —
- Eligible?
- —
Short-term bridge; refi at stabilization.
Rent comps 4 comps
| Address | Beds | Baths | Sqft | Rent | $/sqft | DOM | Units | Dist |
|---|---|---|---|---|---|---|---|---|
| 201 S Ash St Spiro, OK | 2.0 | 1.0 | 700 | $750 | $1.07 | 13d | 1 | 0.38mi |
| 118 NE 3rd St Spiro, OK | 2.0 | 1.0 | 1469 | $1,100 | $0.75 | 13d | 1 | 0.53mi |
| 200 Wortham Dr Spiro, OK | 3.0 | 1.0 | 1000 | $750 | $0.75 | 13d | 1 | 0.71mi |
| 214 Wortham Dr Spiro, OK | 2.0 | 1.0 | 700 | $675 | $0.96 | 13d | 1 | 0.74mi |
Listing history 6 events
-
2026-04-30status Pending
-
2026-04-17price $72,485
-
2026-03-12price $76,300
-
2026-02-13status Active
-
2026-02-11historical
-
2026-02-09$80,340 Active
ⓘ Source: listings_history table (triggers on properties + properties_extension) + one-shot
backfill from property_details.listing_events for pre-trigger history.
Tax reassessment forecast OK · Resets to sale price
- Current annual tax
- $481 · $40/mo
- Projected year-2 tax
- $652 · $54/mo
- Expected delta
- +$171/yr (+$14/mo · 35.6%)
ⓘ Screening estimate from a state-policy table — verify with the county assessor before closing.
Climate risk First Street
- Flood 1/10 Low FEMA zone A · 0% chance over 30 yrs
- Wildfire 6/10 Major
- Heat 6/10 Major 7 d/yr ≥112°F today · 19 d/yr by 30 yrs out
- Wind 3/10 Moderate 5% chance of damaging wind over 30 yrs
- Air quality 2/10 Low 1 unhealthy d/yr today · 1 by 30 yrs out
Nearby sold comps map
Loading sold comps map…
Walkable amenities ~0.75 mi
Loading nearby amenities…
Taxation est. · year 1
- Rental income
- $10,068
- − Mortgage interest
- −$4,060
- − Property taxes
- −$481
- − Insurance
- −$1,865
- − Repairs & maintenance
- −$805
- − Management
- −$805
- − Depreciation
- −$2,109
- Taxable loss
- −$58
- Est. tax savings @ 24.0%
- +$14
- After-tax cash flow
- $1,060/yr
For passive investors: Depreciation is non-cash, so a rental often shows a tax loss while cash-flowing — sheltering income. Rental losses are passive: they offset passive income freely, and up to $25,000/yr can offset ordinary (W-2) income if you actively participate and your MAGI is under $100k (phasing out to $0 by $150k); unused losses carry forward. On sale, claimed depreciation is recaptured at up to 25%, and gains may owe capital-gains tax (a 1031 exchange can defer both). Figures are a year-1 estimate at your 24.0% rate — not tax advice; consult a CPA.
Schools (NCES district)
- District
- Spiro
- NCES district ID
- 4028200
- Math proficiency
- 18% ▼ -12.00%
- Reading proficiency
- 21% ▼ -12.00%
- Median HH income
- $38,031
- Composite
- 16.35/100
- National rank
- #9204
- State rank
- #178 of 270 in OK
Livability — Spiro
- Score
- 61/100
- State rank
- #275
- US rank
- #17347
Category grades
Schools grade is shown separately in the Schools card above.
Census & demographics
- Census place
- Spiro, OK
- Population (ZIP)
- 6,156
Population outlook (Le Flore County) Hauer SSP2
- Today (2025)
- 48,504 people
- By 2030
- 47,474 · -2.1%
- By 2040
- 44,914 · -7.4%
- By 2050
- 42,239 · -12.9%
- By 2075
- 35,071 · -27.7%
- By 2100
- 25,949 · -46.5%
Race, ethnicity, and origin ACS 2023
- Neighborhood character
- Predominantly White (72%)
- Race & ethnicity
- White 72% Native American 12% Two or more races 9% Black 4% Hispanic / Latino 4%
- Common ancestry
- Slovak 2% Italian 1%
- Foreign-born
- 1% · Canada
- Languages at home
- 98% English-only · Spanish 1% Vietnamese 1%
Political lean MEDSL · Le Flore
- 2024 margin
- Solid R (+64.8) · D 17.0% · R 81.8% · Other 1.3%
- 2008→2024 swing
- -26.1pp toward R · 2008: -38.6pp · 2024: -64.8pp
- All cycles
- 2024: R+64.8 2020: R+63.4 2016: R+58.7 2012: R+41.1 2008: R+38.6
Not yet ingested
- Civics
- —
Market trends
- HPI YoY
- —
- Current HPI
- —
- Rent YoY
- —
- Metro
- —
- State GDP YoY
- ▲ 1.55%
- F500 in state
- 6
Industry mix (Fortune 500 HQ in OK)
| Industry | F500 HQs | Revenue |
|---|---|---|
| Energy | 3 | $48B |
|
||
Price history
-9.8% since first listed6 events — show timeline
- 2026-04-30 Pending — MLS Technology, Inc.
- 2026-04-17 Price Changed $72,485 MLS Technology, Inc.
- 2026-03-12 Price Changed $76,300 MLS Technology, Inc.
- 2026-02-13 Relisted — MLS Technology, Inc.
- 2026-02-11 Listing Removed — MLS Technology, Inc.
- 2026-02-09 Listed $80,340 MLS Technology, Inc.
Property tax history
+4.0%/yrLatest (2025): $481 · +2.6% YoY. Source: county tax records.
Cash-flow waterfall
monthlySold comps — $/sqft
last 12 mo · ≤1 miLoading sold comps…