8431 Hearth Dr #1 · Houston, TX
Flood risk 8/10 · Major
- FEMA flood zone
- X (unshaded)
- Chance of flooding over 30 yrs
- 0.99%
- Est. flood insurance / yr
- $507 – $1,088
Fire risk 1/10 · Minimal
- Est. fire insurance / yr
- $1,222 – $2,270
Heat risk 9/10 · Severe
- Hot days now (above 109°F)
- 7 days/yr
- Hot days in 30 yrs
- 25 days/yr
Wind risk 9/10 · Severe
- Chance of severe wind over 30 yrs
- 99.0%
Air-quality risk 2/10 · Minimal
- Unhealthy air days now
- 2 days/yr
- Unhealthy air days in 30 yrs
- 2 days/yr
Risk factors via First Street. Map © Google.
Why this score? — see what drove the B- grade
The composite is a weighted blend of 9 inputs, each scored 0–100. Each bar is that input's sub-score; the figure is the points it added to the 100-point composite (weight × sub-score).
- Cash flow +21.5/30.0
- ARV discount +15.0/15.0
- 1% rule +10.0/10.0
- DSCR +6.9/10.0
- Livability +3.7/5.0
- Appreciation +2.7/10.0
- Schools +2.7/10.0
- Condition / age +2.5/5.0
- Rent growth +1.8/5.0
$55,000
🖨 Deal sheet 📄 Offer letter ✓ Due diligence
Listing remarks MLS
Step into this spacious two bedroom two bath condo in the heart of the Medical Center area. The open living and dining spaceoffers great natural light and easy flow, with access to a private covered patio perfect for relaxing or container gardening. The kitchen offers ample cabinet storage and a functional layout. Both bedrooms are generously sized, and the primary suite includes a wide vanity area and large closet. Enjoy the convenience of an in unit laundry area and plenty of storage throughout. The community features controlled access, gated parking, and a refreshing pool. Located moments from the Texas Medical Center, NRG, dining, and major freeways, this condo is ideal for investment or personal use with incredible potential to update and make your own.
Key facts
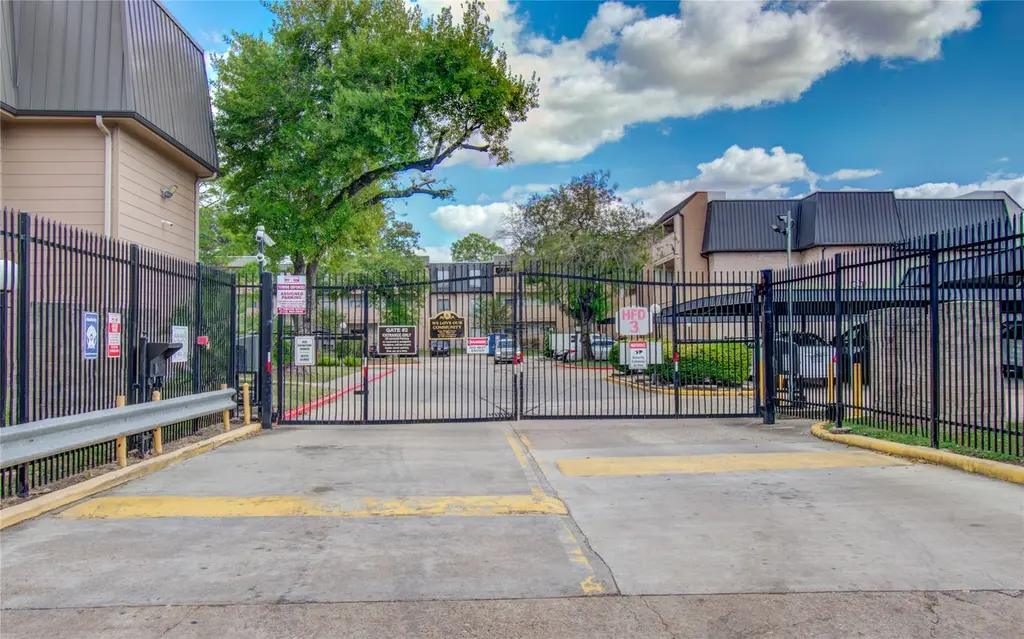
- Controlled access
- Refreshing pool
- Gated parking
Tags
Neighborhood map
What this means for you Summary
Snapshot
- This is a 2-bed/2.0-bath condo listed at $55k.
Deal economics
- At list price, monthly cash flow is $17 ($198/yr) — positive.
- The deal already cash-flows at list — no discount required.
- Meets the 1% rule at list price ($1k rent vs $55k).
- Recommended offer: $53k (3.0% below list) — sets the bar for market timing.
- Cap rate 8.1% vs local median 3.2% in Houston — top-decile yield for the area; either an underpriced asset or a hidden risk that comps aren't pricing in. Stress-test before assuming the spread holds.
Location & tenants
- Location reads 74/100 on livability (#184 in TX, #4,771 nationally) — a middle-class / working-renter tenant base. Strengths: amenities A+, cost of living A+, housing A+; Watch: schools D, crime F.
- Houston ISD (urban): math 27% / reading 35% proficiency, ranked #593 of 826 in TX (top 72%) — families likely to look elsewhere, expect single-tenant / working-renter base with shorter leases; 71% free/reduced lunch — lower-income household profile, screen leases tightly.
- Market conditions: Rents soft (-2.8%/yr); 268 active listings in the ZIP; 40 comparable units currently listed for rent nearby; rentals leasing fast (median 12d on market — plan ~1-2 weeks tenant-placement turnaround); 29,883 units permitted in Harris County in 2024 (8,621 in 5+ unit buildings).
Forward outlook
- Local home prices are declining (-3.0%/yr); year-one equity from $380 of loan paydown is wiped out by about $2k of value loss. Plan a longer hold.
- Harris County population projected at +47% by 2050 — long-run rental-demand tailwind backs the buy-and-hold thesis.
Negotiation context
- It's been on market 58 days — a 3% lower offer ($53k) is reasonable based on typical stale-listing flexibility.
- 2 sale attempts; this cycle's ask has dropped $15k (21%) from the opening price — seller is motivated, your offer sets the floor, not the list.
Risks & watch-outs
- Watch-outs: property tax is 3.5% of price; flood insurance adds $66/mo; HOA is 33% of rent.
- Climate carrying-cost: severe flood risk; severe wind risk, 99% chance of damaging wind over 30y; extreme-heat days projected 7→25/yr by 2055 (HVAC capex compounding) — expect insurance premiums to compound above CPI over the hold.
Questions for the listing agent
- It's been on market 58 days. Have you received any prior offers? Is the seller open to a 3% concession, seller financing, or rate buy-down credit?
- Built in 1979 — when were the roof, HVAC, electrical panel, plumbing, and water heater last replaced?
- Property tax is high relative to price — has the assessment been appealed recently, and will the sale trigger a re-assessment?
- What's the actual annual flood-insurance premium (NFIP or private), and is the property in a SFHA with mandatory coverage?
- What does the HOA fee cover, when was the last increase, and are there any pending special assessments or reserve-fund shortfalls?
- Any open or pending special assessments — roof, HVAC, plumbing, elevator, façade? What's the per-unit balance and payoff schedule, and is the seller paying it off at close or rolling it to the buyer?
- Is there a deadline driving the sale (1031 exchange, divorce, estate, relocation)? That informs how much negotiation room exists.
- Schools are D-rated, which usually means shorter tenancies and higher turnover. Who's the typical renter profile here, and what's been the actual vacancy rate?
- Crime grade is F in this area — have there been break-ins, vandalism, or insurance claims at this property in the last 3 years? What carrier currently insures it and at what premium?
- What's the average days-on-market for RENTAL listings here right now (not sales)? A rising rental-DOM trend means longer vacancies and softer asking-rent achievability than the comps imply.
- What's the recent tenant-quality profile in this submarket — average credit score on applications, eviction rate, late-payment / NSF rate, and stable-employment percentage? A property-management company in the area should have these aggregated.
- How much new apartment / multifamily construction is in the pipeline within 1–3 miles? Heavy new supply (>2% of stock underway) typically softens rents 12–24 months out; light construction supports rent growth.
Investment metrics
- 1% rule
- 2.17% ✓
- Cap rate
- 8.10%
- Cash-on-cash
- 6.47%
- DSCR
- 1.29
- GRM
- 3.8
CMA / ARV
- ARV (median comp)
- $74,455
- List price
- $55,000
- Delta
- -26.13%
- Verdict
- UNDERPRICED
- Comps
- 20 within 1.0 mi
Projected returns pro-forma
-3.0% appreciation · 0.0% rent growth · sell at horizon
- IRR
- -22.1%
- Equity multiple
- 0.29×
- Total profit
- $-11,007
- Equity at exit
- $8,201
- IRR
- -69.2%
- Equity multiple
- -0.32×
- Total profit
- $-20,321
- Equity at exit
- $4,755
Cash invested: $15,400 (down + closing). Projections, not guarantees.
Landlord ↔ Tenant lean methodology
- Overall (STATE)
- 87 Strongly Landlord-Friendly
- State Texas
- 87 Strongly Landlord-Friendly · R+5
- County
- — inherits STATE
- City
- — inherits STATE
ZIP-level market 77054
- Home prices YoY
- -2.6%
- Rents YoY
- -2.8%
- Active inventory
- 268
- Price-to-rent
- 3.8×
Monthly cashflow live
- Estimated rent
- $1,195 high interval (Pro) →
- Mortgage (P&I)
- −$288
- Tax from tax record
- −$160 /mo · $1,914/yr
- Insurance
- −$23
- Flood insurance flood zone
- −$66 /mo · $798/yr
- HOA
- −$390
- Vacancy / Maint / Mgmt
- −$251
- Net cashflow
- $17
Break-even live
UW: 25.0% down · 7.5% · 30yr · 1.5% tax · 5.0% vac · 8.0% maint · 8.0% mgmt
Financing live
Cash to close
- Down payment
- $13,750
- Closing costs
- $1,650
- Reserves months
- —
- Total cash needed
- —
Loan-product check · same deal, 3 products live
Conventional
25% down · 7.5% · 30yr
- Down + closing
- —
- Monthly P&I
- —
- Monthly cashflow
- —
- DSCR
- —
- Eligible?
- —
Personal DTI + credit; lowest rate.
DSCR
20% down · 8.5% · 30yr
- Down + closing
- —
- Monthly P&I
- —
- Monthly cashflow
- —
- DSCR
- —
- Eligible?
- —
No personal income docs; deal must DSCR.
Hard money
10% down · 12.0% · 12mo
- Down + closing
- —
- Monthly P&I
- —
- Monthly cashflow
- —
- DSCR
- —
- Eligible?
- —
Short-term bridge; refi at stabilization.
Rent comps 40 comps
| Address | Beds | Baths | Sqft | Rent | $/sqft | DOM | Units | Dist |
|---|---|---|---|---|---|---|---|---|
| 8435 Hearth Dr Houston, TX | 2.0 | 2.0 | 1040 | $950 | $0.91 | 43d | 1 | 0.06mi |
| 2501 Westridge St Unit 2047 Houston, TX | 2.0 | 2.0 | 1005 | $1,274 | $1.27 | 11d | 1 | 0.07mi |
| 2600 Westridge St Houston, TX | 1.0–2.0 | 1.0–2.0 | 790 | $1,349 | $1.71 | 2d | 73 | 0.08mi |
| 2501 Westridge St Unit 2558 Houston, TX | 2.0 | 2.0 | 1005 | $1,231 | $1.22 | 3d | 1 | 0.11mi |
| 2501 Westridge St Unit 422 Houston, TX | 2.0 | 2.0 | 1005 | $1,239 | $1.23 | 7d | 1 | 0.11mi |
| 2501 Westridge St Unit 424 Houston, TX | 2.0 | 2.0 | 1005 | $1,239 | $1.23 | 5d | 1 | 0.11mi |
| 8521 Hearth Dr Houston, TX | 2.0 | 2.0 | 1092 | $1,195 | $1.09 | 43d | 1 | 0.12mi |
| 2801 S Bartell Dr Houston, TX | 2.0 | 2.0 | 1289 | $1,808 | $1.40 | 12d | 1 | 0.13mi |
| 8415 Hearth Dr Unit 1019639P Houston, TX | 3.0 | 2.0 | 1496 | $5,258 | $3.51 | 5d | 1 | 0.14mi |
| 8415 Hearth Dr #25 Houston, TX | 3.0 | 2.0 | 1500 | $3,950 | $2.63 | 43d | 1 | 0.14mi |
| 2401 Westridge St Houston, TX | 1.0–2.0 | 1.0–2.0 | 723 | $1,250 | $1.73 | 7d | 30 | 0.14mi |
| 2820 S Bartell Dr Houston, TX | 1.0 | 1.0 | 780 | $850 | $1.09 | 43d | 3 | 0.15mi |
| 2407 Westridge St Houston, TX | 2.0 | 2.0 | 975 | $1,199 | $1.23 | 43d | 1 | 0.16mi |
| 2401 Westridge St Unit 425 Houston, TX | 2.0 | 2.0 | 812 | $1,013 | $1.25 | 11d | 1 | 0.18mi |
| 2401 Westridge St Unit 1-1009 Houston, TX | 2.0 | 2.0 | 844 | $1,000 | $1.18 | 43d | 1 | 0.18mi |
| 2401 Westridge St Unit 1-1009 Houston, TX | 2.0 | 2.0 | 841 | $998 | $1.19 | 24d | 1 | 0.18mi |
| 2401 Westridge St Unit 2-2008 Houston, TX | 2.0 | 2.0 | 844 | $950 | $1.13 | 44d | 1 | 0.18mi |
| 2401 Westridge St Unit 2112 Houston, TX | 2.0 | 2.0 | 812 | $1,019 | $1.25 | 7d | 1 | 0.18mi |
| 2401 Westridge St Unit 2-2314 Houston, TX | 2.0 | 1.0 | 812 | $999 | $1.23 | 43d | 1 | 0.18mi |
| 2401 Westridge St Unit 422 Houston, TX | 2.0 | 2.0 | 812 | $989 | $1.22 | 7d | 1 | 0.18mi |
| 2401 Westridge St Unit 1-1013 Houston, TX | 2.0 | 2.0 | 844 | $1,250 | $1.48 | 43d | 1 | 0.18mi |
| 2401 Westridge St Unit 2-2610 Houston, TX | 2.0 | 1.0 | 812 | $824 | $1.01 | 24d | 1 | 0.18mi |
| 2818 S Bartell Dr Houston, TX | 1.0 | 1.0 | 780 | $795 | $1.02 | 43d | 1 | 0.21mi |
| 2686 Murworth Dr Houston, TX | 1.0–2.0 | 1.0–2.0 | 791 | $1,475 | $1.86 | 2d | 12 | 0.23mi |
| 2400 South Loop W Houston, TX | 1.0–2.0 | 1.0–2.0 | 723 | $1,250 | $1.73 | 5d | 24 | 0.23mi |
| 2692 Murworth Dr Houston, TX | 2.0 | 2.0 | 1000 | $1,349 | $1.35 | 43d | 1 | 0.25mi |
| 8416 W Bartell Dr Houston, TX | 2.0 | 2.0 | 892 | $1,195 | $1.34 | 24d | 1 | 0.26mi |
| 8410 W Bartell Dr Unit 2047 Houston, TX | 2.0 | 2.0 | 892 | $1,069 | $1.20 | 11d | 1 | 0.28mi |
| 8410 W Bartell Dr Unit 422 Houston, TX | 2.0 | 2.0 | 892 | $1,034 | $1.16 | 7d | 1 | 0.29mi |
| 8410 W Bartell Dr Unit 421 Houston, TX | 2.0 | 2.0 | 892 | $1,034 | $1.16 | 5d | 1 | 0.29mi |
| 8410 W Bartell Dr Unit 2187 Houston, TX | 2.0 | 2.0 | 892 | $1,026 | $1.15 | 3d | 1 | 0.29mi |
| 8800 Lakes at 610 Dr Houston, TX | 2.0 | 2.0 | 951 | $1,280 | $1.35 | 24d | 1 | 0.32mi |
| 2989 Westridge St Houston, TX | 2.0 | 2.0 | 1108 | $1,639 | $1.48 | 12d | 1 | 0.32mi |
| 2801 Broadmead Dr Unit 2047 Houston, TX | 2.0 | 2.0 | 850 | $1,199 | $1.41 | 12d | 1 | 0.37mi |
| 2801 Broadmead Dr Unit 425 Houston, TX | 2.0 | 2.0 | 850 | $1,207 | $1.42 | 3d | 1 | 0.37mi |
| 2801 Broadmead Dr Unit 2858 Houston, TX | 2.0 | 2.0 | 850 | $1,250 | $1.47 | 12d | 1 | 0.37mi |
| 2801 Broadmead Dr Unit 723 Houston, TX | 1.0 | 1.0 | 768 | $1,100 | $1.43 | 43d | 1 | 0.37mi |
| 2801 Broadmead Dr Unit 424 Houston, TX | 2.0 | 2.0 | 850 | $1,215 | $1.43 | 7d | 1 | 0.37mi |
| 2801 Broadmead Dr Unit 2174 Houston, TX | 2.0 | 2.0 | 850 | $1,239 | $1.46 | 11d | 1 | 0.37mi |
| 2801 Broadmead Dr Unit 1008 Houston, TX | 2.0 | 2.0 | 965 | $1,200 | $1.24 | 43d | 1 | 0.37mi |
HOA detail condo
- Monthly dues
- $390 · $4,680/yr
- Likely covers
- poolsecurity
- Assessments
- None detected in remarks — confirm with the listing agent.
Listing history 17 events
-
2026-06-18days on market $55,000 Active 58 DOM
-
2026-06-17days on market $55,000 Active 57 DOM
-
2026-06-16days on market $55,000 Active 56 DOM
-
2026-06-15days on market $55,000 Active 55 DOM
-
2026-06-13days on market $55,000 Active 53 DOM
-
2026-06-10days on market $55,000 Active 49 DOM
-
2026-06-08days on market $55,000 Active 48 DOM
-
2026-06-07days on market $55,000 Active 47 DOM
-
2026-06-04days on market $55,000 Active 44 DOM
-
2026-06-01days on market $55,000 Active 41 DOM
-
2026-05-31days on market $55,000 Active 40 DOM
-
2026-04-28price $55,000 768-char remark
Show marketing remark (768 chars)
Step into this spacious two bedroom two bath condo in the heart of the Medical Center area. The open living and dining spaceoffers great natural light and easy flow, with access to a private covered patio perfect for relaxing or container gardening. The kitchen offers ample cabinet storage and a functional layout. Both bedrooms are generously sized, and the primary suite includes a wide vanity area and large closet. Enjoy the convenience of an in unit laundry area and plenty of storage throughout. The community features controlled access, gated parking, and a refreshing pool. Located moments from the Texas Medical Center, NRG, dining, and major freeways, this condo is ideal for investment or personal use with incredible potential to update and make your own.
-
2026-04-21$70,000 Active 768-char remark
Show marketing remark (768 chars)
Step into this spacious two bedroom two bath condo in the heart of the Medical Center area. The open living and dining spaceoffers great natural light and easy flow, with access to a private covered patio perfect for relaxing or container gardening. The kitchen offers ample cabinet storage and a functional layout. Both bedrooms are generously sized, and the primary suite includes a wide vanity area and large closet. Enjoy the convenience of an in unit laundry area and plenty of storage throughout. The community features controlled access, gated parking, and a refreshing pool. Located moments from the Texas Medical Center, NRG, dining, and major freeways, this condo is ideal for investment or personal use with incredible potential to update and make your own.
-
2026-02-03historical
-
2026-01-09price $70,000
-
2025-11-17$99,000 Active
-
1991-01-03soldstatus
ⓘ Source: listings_history table (triggers on properties + properties_extension) + one-shot
backfill from property_details.listing_events for pre-trigger history.
Tax reassessment forecast TX · Resets to sale price
- Current annual tax
- $1,914 · $160/mo
- Projected year-2 tax
- $1,914 · $160/mo
- Expected delta
- $0/yr ($0/mo · 0.0%)
ⓘ Screening estimate from a state-policy table — verify with the county assessor before closing.
Climate risk First Street
- Flood 8/10 Severe FEMA zone X (unshaded) · 99% chance over 30 yrs
- Wildfire 1/10 Low
- Heat 9/10 Extreme 7 d/yr ≥109°F today · 25 d/yr by 30 yrs out
- Wind 9/10 Extreme 99% chance of damaging wind over 30 yrs
- Air quality 2/10 Low 2 unhealthy d/yr today · 2 by 30 yrs out
Nearby sold comps map
Loading sold comps map…
Walkable amenities ~0.75 mi
Loading nearby amenities…
Taxation est. · year 1
- Rental income
- $14,337
- − Mortgage interest
- −$3,081
- − Property taxes
- −$1,914
- − Insurance
- −$1,072
- − Repairs & maintenance
- −$1,147
- − Management
- −$1,147
- − HOA
- −$4,680
- − Depreciation
- −$1,600
- Taxable loss
- −$305
- Est. tax savings @ 24.0%
- +$73
- After-tax cash flow
- $271/yr
For passive investors: Depreciation is non-cash, so a rental often shows a tax loss while cash-flowing — sheltering income. Rental losses are passive: they offset passive income freely, and up to $25,000/yr can offset ordinary (W-2) income if you actively participate and your MAGI is under $100k (phasing out to $0 by $150k); unused losses carry forward. On sale, claimed depreciation is recaptured at up to 25%, and gains may owe capital-gains tax (a 1031 exchange can defer both). Figures are a year-1 estimate at your 24.0% rate — not tax advice; consult a CPA.
Schools (NCES district)
- District
- Houston ISD
- NCES district ID
- 4823640
- Math proficiency
- 27% ▼ -18.00%
- Reading proficiency
- 35% ▼ -6.00%
- Median HH income
- $46,054
- Composite
- 26.63/100
- National rank
- #7173
- State rank
- #593 of 826 in TX
Livability — Houston
- Score
- 74/100
- State rank
- #184
- US rank
- #4771
Category grades
Schools grade is shown separately in the Schools card above.
Census & demographics
- Census place
- Houston, TX
- County
- Harris County · 4,702,590 people
- City population
- 3,226,434
- Metro
- Houston-The Woodlands-Sugar Land, TX
- Population (ZIP)
- 28,272
- Household income
- $62,106
- Rent vs Own
- Severe rent burden
- 2814.0
Population outlook (Harris County) Hauer SSP2
- Today (2025)
- 5,571,493 people
- By 2030
- 6,089,821 · +9.3%
- By 2040
- 7,142,806 · +28.2%
- By 2050
- 8,185,864 · +46.9%
- By 2075
- 10,574,329 · +89.8%
- By 2100
- 12,109,958 · +117.4%
Race, ethnicity, and origin ACS 2023
- Neighborhood character
- Highly diverse neighborhood (Simpson 0.72)
- Race & ethnicity
- Black 41% Asian 22% White 20% Hispanic / Latino 14% Two or more races 10%
- Hispanic origin (detail)
- Mexican 7%
- Common ancestry
- Slovak 2% Romanian 1% Italian 1%
- Foreign-born
- 29% · China, Canada, Jamaica
- Languages at home
- 67% English-only · Spanish 9% Chinese 7% Other Indo-European 5%
Political lean MEDSL · Harris
- 2024 margin
- Lean D (+5.5) · D 52.0% · R 46.4% · Other 1.6%
- 2008→2024 swing
- +3.9pp toward D · 2008: 1.6pp · 2024: 5.5pp
- All cycles
- 2024: D+5.5 2020: D+13.3 2016: D+12.4 2012: D+0.1 2008: D+1.6
Not yet ingested
- Civics
- —
Market trends
- HPI YoY
- ▼ -4.51%
- Current HPI
- 170.4017
- Rent YoY
- ▼ -2.82%
- Metro
- Houston-The Woodlands-Sugar Land, TX
- State GDP YoY
- ▲ 3.95%
- F500 in state
- 110
Industry mix (Fortune 500 HQ in TX)
| Industry | F500 HQs | Revenue |
|---|---|---|
| Energy | 16 | $1,198B |
|
||
| Technology | 5 | $198B |
|
||
| Engineering / Construction | 4 | $72B |
|
||
| Energy Services | 3 | $60B |
|
||
| Utilities | 3 | $41B |
|
||
| Healthcare | 2 | $330B |
|
||
Price history
-44.4% since first listed6 events — show timeline
- 2026-04-28 Price Changed $55,000 HARMLS
- 2026-04-21 Listed $70,000 HARMLS
- 2026-02-03 Listing Removed — HARMLS
- 2026-01-09 Price Changed $70,000 HARMLS
- 2025-11-17 Listed $99,000 HARMLS
- 1991-01-03 Sold (Public Records) — Public Records
Property tax history
+8.0%/yrLatest (2025): $1,914 · +8.6% YoY. Source: county tax records.
Cash-flow waterfall
monthlySold comps — $/sqft
last 12 mo · ≤1 miLoading sold comps…