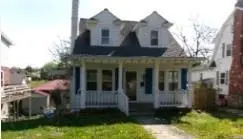
115 Granville Ave · Beckley, WV
Flood risk 1/10 · Minimal
- FEMA flood zone
- X (unshaded)
- Chance of flooding over 30 yrs
- 0.0%
- Est. flood insurance / yr
- $473 – $860
Fire risk 4/10 · Minor
- Est. fire insurance / yr
- $787 – $1,461
Heat risk 3/10 · Minor
- Hot days now (above 91°F)
- 7 days/yr
- Hot days in 30 yrs
- 21 days/yr
Wind risk 1/10 · Minimal
- Chance of severe wind over 30 yrs
- —
Air-quality risk 1/10 · Minimal
- Unhealthy air days now
- 0 days/yr
- Unhealthy air days in 30 yrs
- 0 days/yr
Risk factors via First Street. Map © Google.
Why this score? — see what drove the B+ grade
The composite is a weighted blend of 9 inputs, each scored 0–100. Each bar is that input's sub-score; the figure is the points it added to the 100-point composite (weight × sub-score).
- Cash flow +30.0/30.0
- ARV discount +15.0/15.0
- DSCR +10.0/10.0
- 1% rule +9.0/10.0
- Rent growth +3.6/5.0
- Schools +3.0/10.0
- Livability +3.0/5.0
- Condition / age +2.5/5.0
- Appreciation +0.0/10.0
$99,500
🖨 Deal sheet 📄 Offer letter ✓ Due diligence
Listing remarks
Potential awaits at this four bedroom, two bath cape cod style home. Close to everything Beckley has to offer, Call for more information today!
Key facts
- 6,969 sq ft lot
- Built 1945
- Listed 61 days
Property features AI
Exterior
- Parking: Open parking; No garage; Concrete parking surface
- Security: No security details provided
- Utilities: Public water; Public sewer
- Home design: Residential property
- Construction: Vinyl siding
- Exterior features: Asphalt roof; Property has a view; Lot is level to rolling
Interior
- Kitchen: No kitchen appliance details provided
- Bedrooms: 1 main level bedroom
- Flooring: Wood
- Bathrooms: 2 full bathrooms
- Heating & cooling: Hot water heating; Central air conditioning
- Interior features: Wood flooring; Electric water heater
- Laundry & utility: Laundry in basement
Neighborhood map
What this means for you Summary
Snapshot
- This is a 4-bed/2.0-bath single-family listed at $100k.
Deal economics
- At list price, monthly cash flow is $474 ($6k/yr) — positive.
- The deal already cash-flows at list — no discount required.
- Meets the 1% rule at list price ($1k rent vs $100k).
- Recommended offer: $94k (6.0% below list) — sets the bar for market timing.
- Cap rate 12.0% vs local median 7.0% in Beckley — top-decile yield for the area; either an underpriced asset or a hidden risk that comps aren't pricing in. Stress-test before assuming the spread holds.
Location & tenants
- Location reads 59/100 on livability (#235 in WV) — a working-class tenant base; expect higher turnover. Strengths: cost of living A+, housing A-; Watch: employment D, crime F, amenities F.
- Raleigh County Schools (rural): math 29% / reading 42% proficiency, ranked #14 of 55 in WV (top 26%) — families likely to look elsewhere, expect single-tenant / working-renter base with shorter leases.
- Zoned schools: Maxwell Hill Elementary (math 42% / reading 42%, grade F, #87 of 377 statewide, top 28%, 211 students, 0% FRL); Beckley-Stratton Middle School (math 14% / reading 27%, grade F, #102 of 109 statewide, top 94%, 674 students, 0% FRL); Woodrow Wilson High School (math 24% / reading 56%, grade F, #20 of 110 statewide, top 17%, 1,330 students, 0% FRL) — zoned schools average 0% FRL vs 46% district-wide (46 pts lower); this property's tenant base skews higher-income than the district average.
- Market conditions: Rents rising fast (+4.2%/yr); 112 active listings in the ZIP; 41 units permitted in Raleigh County in 2024 (0 in 5+ unit buildings).
Forward outlook
- Local home prices are declining (-3.0%/yr); year-one equity from $688 of loan paydown is wiped out by about $3k of value loss. Plan a longer hold.
- Raleigh County population projected at -16% by 2050 — secular population decline; favor cash flow + early exit over multi-decade hold.
- At projected returns (-3.0% appreciation + 4.2% rent growth), your $28k cash investment doubles in ~6 years — after that, you're playing with house money.
Negotiation context
- It's been on market 62 days — a 6% lower offer ($94k) is reasonable based on typical stale-listing flexibility.
- Current owner paid $35k; list at $100k implies a 184% gain — meaningful room to come down on a strong offer.
Risks & watch-outs
- Watch-outs: built in 1945 — expect roof / HVAC / electrical / plumbing capex.
Questions for the listing agent
- It's been on market 62 days. Have you received any prior offers? Is the seller open to a 6% concession, seller financing, or rate buy-down credit?
- Built in 1945 — when were the roof, HVAC, electrical panel, plumbing, and water heater last replaced?
- Why hasn't it sold? Are there any deal-killer items the seller is aware of (foundation, flood, title, zoning, code violations)?
- Is there a deadline driving the sale (1031 exchange, divorce, estate, relocation)? That informs how much negotiation room exists.
- Schools are D-rated, which usually means shorter tenancies and higher turnover. Who's the typical renter profile here, and what's been the actual vacancy rate?
- Crime grade is F in this area — have there been break-ins, vandalism, or insurance claims at this property in the last 3 years? What carrier currently insures it and at what premium?
- What's the average days-on-market for RENTAL listings here right now (not sales)? A rising rental-DOM trend means longer vacancies and softer asking-rent achievability than the comps imply.
- What's the recent tenant-quality profile in this submarket — average credit score on applications, eviction rate, late-payment / NSF rate, and stable-employment percentage? A property-management company in the area should have these aggregated.
- How much new for-sale + rental construction is in the pipeline within 1–3 miles? Heavy new supply typically softens prices + rents 12–24 months out; constrained supply supports both.
Investment metrics
- 1% rule
- 1.40% ✓
- Cap rate
- 12.01%
- Cash-on-cash
- 20.43%
- DSCR
- 1.91
- GRM
- 5.9
CMA / ARV
- ARV (on-the-fly)
- $160,289
- Comps found
- 12
Show comp detail 12 sales within ~0.75 mi
| Address | Dist | Beds/Ba | Sqft | Sold | Price | $/sf | Match |
|---|---|---|---|---|---|---|---|
| 113 Queen St | 0.30mi | 4/3.0 | 1,840 (+2%) | 9mo | $273,000 | $148 | 71 |
| 805 Woodlawn Ave | 0.31mi | 3/1.5 (-1) | 1,840 (+2%) | 5mo | $231,000 | $126 | 71 |
| 226 Granville Ave | 0.21mi | 3/1.0 (-1) | 1,842 (+2%) | 9mo | $115,000 | $62 | 70 |
| 106 King St | 0.38mi | 3/2.0 (-1) | 1,703 (-5%) | 12mo | $279,000 | $164 | 58 |
| 209 Belle Vue Ln | 0.25mi | 3/1.5 (-1) | 1,604 (-11%) | 10mo | $52,000 | $32 | 54 |
| 115 Williams St | 0.51mi | 3/3.0 (-1) | 1,676 (-7%) | 4mo | $139,900 | $83 | 52 |
| 759 South Fayette St | 0.34mi | 3/2.0 (-1) | 1,597 (-11%) | 15mo | $65,000 | $41 | 48 |
| 905 S Kanawha St | 0.65mi | 3/2.0 (-1) | 1,916 (+6%) | 7mo | $172,000 | $90 | 48 |
| 103 Wickham Ave | 0.67mi | 3/2.5 (-1) | 1,903 (+6%) | 9mo | $169,000 | $89 | 45 |
| 107 Croft St | 0.65mi | 3/1.5 (-1) | 1,628 (-10%) | 5mo | $140,000 | $86 | 42 |
| 104 Rice St | 0.61mi | 4/2.0 | 2,022 (+12%) | 11mo | $110,000 | $54 | 42 |
| 203 Campbell St | 0.72mi | 5/2.0 (+1) | 1,935 (+7%) | 12mo | $230,000 | $119 | 39 |
Match score weights: distance 35% · size 25% · config 20% · recency 20%. Top-matched comps best support the ARV.
Projected returns pro-forma
-3.0% appreciation · 4.25% rent growth · sell at horizon
- IRR
- 14.0%
- Equity multiple
- 1.57×
- Total profit
- $15,844
- Equity at exit
- $14,836
- IRR
- 23.7%
- Equity multiple
- 3.16×
- Total profit
- $60,114
- Equity at exit
- $8,603
Cash invested: $27,860 (down + closing). Projections, not guarantees.
Landlord ↔ Tenant lean methodology
- Overall (STATE)
- 83 Strongly Landlord-Friendly
- State West Virginia
- 83 Strongly Landlord-Friendly · R+22
- County
- — inherits STATE
- City
- — inherits STATE
ZIP-level market 25801
- Home prices YoY
- -17.8%
- Rents YoY
- 4.2%
- Active inventory
- 112
- Price-to-rent
- 5.9×
Monthly cashflow live
- Estimated rent
- $1,396 medium interval (Pro) →
- Mortgage (P&I)
- −$522
- Tax from tax record
- −$66 /mo · $788/yr
- Insurance
- −$41
- HOA
- −$0
- Vacancy / Maint / Mgmt
- −$293
- Net cashflow
- $474
Break-even live
UW: 25.0% down · 7.5% · 30yr · 1.5% tax · 5.0% vac · 8.0% maint · 8.0% mgmt
Financing live
Cash to close
- Down payment
- $24,875
- Closing costs
- $2,985
- Reserves months
- —
- Total cash needed
- —
Loan-product check · same deal, 3 products live
Conventional
25% down · 7.5% · 30yr
- Down + closing
- —
- Monthly P&I
- —
- Monthly cashflow
- —
- DSCR
- —
- Eligible?
- —
Personal DTI + credit; lowest rate.
DSCR
20% down · 8.5% · 30yr
- Down + closing
- —
- Monthly P&I
- —
- Monthly cashflow
- —
- DSCR
- —
- Eligible?
- —
No personal income docs; deal must DSCR.
Hard money
10% down · 12.0% · 12mo
- Down + closing
- —
- Monthly P&I
- —
- Monthly cashflow
- —
- DSCR
- —
- Eligible?
- —
Short-term bridge; refi at stabilization.
Listing history 17 events
-
2026-06-19days on market $99,500 Active 62 DOM
-
2026-06-18days on market $99,500 Active 61 DOM
-
2026-06-17days on market $99,500 Active 60 DOM
-
2026-06-16days on market $99,500 Active 59 DOM
-
2026-06-15days on market $99,500 Active 58 DOM
-
2026-06-14days on market $99,500 Active 56 DOM
-
2026-06-12days on market $99,500 Active 55 DOM
-
2026-06-09days on market $99,500 Active 52 DOM
-
2026-06-08days on market $99,500 Active 51 DOM
-
2026-06-07pricedays on market $99,500 Active 50 DOM
-
2026-06-03days on market $107,500 Active 46 DOM
-
2026-06-02days on market $107,500 Active 45 DOM
-
2026-06-01days on market $107,500 Active 44 DOM
-
2026-05-31days on market $107,500 Active 43 DOM
-
2026-05-30days on market $107,500 Active 42 DOM
-
2026-04-17$107,500 Active
-
2002-02-26soldstatus $35,000
ⓘ Source: listings_history table (triggers on properties + properties_extension) + one-shot
backfill from property_details.listing_events for pre-trigger history.
Tax reassessment forecast WV · Resets to sale price
- Current annual tax
- $788 · $66/mo
- Projected year-2 tax
- $788 · $66/mo
- Expected delta
- $0/yr ($0/mo · 0.0%)
ⓘ Screening estimate from a state-policy table — verify with the county assessor before closing.
Climate risk First Street
- Flood 1/10 Low FEMA zone X (unshaded) · 0% chance over 30 yrs
- Wildfire 4/10 Moderate
- Heat 3/10 Moderate 7 d/yr ≥91°F today · 21 d/yr by 30 yrs out
- Wind 1/10 Low
- Air quality 1/10 Low 0 unhealthy d/yr today · 0 by 30 yrs out
Nearby sold comps map
Loading sold comps map…
Walkable amenities ~0.75 mi
Loading nearby amenities…
Taxation est. · year 1
- Rental income
- $16,757
- − Mortgage interest
- −$5,574
- − Property taxes
- −$788
- − Insurance
- −$498
- − Repairs & maintenance
- −$1,341
- − Management
- −$1,341
- − Depreciation
- −$2,895
- Taxable income
- $4,322
- Est. tax owed @ 24.0%
- −$1,037
- After-tax cash flow
- $4,654/yr
For passive investors: Depreciation is non-cash, so a rental often shows a tax loss while cash-flowing — sheltering income. Rental losses are passive: they offset passive income freely, and up to $25,000/yr can offset ordinary (W-2) income if you actively participate and your MAGI is under $100k (phasing out to $0 by $150k); unused losses carry forward. On sale, claimed depreciation is recaptured at up to 25%, and gains may owe capital-gains tax (a 1031 exchange can defer both). Figures are a year-1 estimate at your 24.0% rate — not tax advice; consult a CPA.
Schools (NCES district)
- District
- Raleigh County Schools
- NCES district ID
- 5401230
- Math proficiency
- 29% ▼ -8.00%
- Reading proficiency
- 42% ▼ -3.00%
- Median HH income
- $39,828
- Composite
- 29.74/100
- National rank
- #6445
- State rank
- #14 of 55 in WV
Livability — Beckley
- Score
- 59/100
- State rank
- #235
- US rank
- #20551
Category grades
Schools grade is shown separately in the Schools card above.
Census & demographics
- Census place
- Beckley, WV
- County
- Raleigh County · 31,128 people
- City population
- 31,128
- Metro
- Beckley, WV
- Population (ZIP)
- 31,128
- Household income
- $56,836
- Rent vs Own
- Severe rent burden
- 1384.0
Population outlook (Raleigh County) Hauer SSP2
- Today (2025)
- 73,505 people
- By 2030
- 70,954 · -3.5%
- By 2040
- 66,038 · -10.2%
- By 2050
- 61,919 · -15.8%
- By 2075
- 51,954 · -29.3%
- By 2100
- 39,724 · -46.0%
Race, ethnicity, and origin ACS 2023
- Neighborhood character
- Predominantly White (81%)
- Race & ethnicity
- White 81% Black 10% Two or more races 7% Hispanic / Latino 2% Asian 2%
- Common ancestry
- Slovak 2% Italian 1% Lithuanian 1%
- Foreign-born
- 2% · Canada
- Languages at home
- 96% English-only · Spanish 2% Other Indo-European 1%
Political lean MEDSL · Raleigh
- 2024 margin
- Solid R (+54.3) · D 22.0% · R 76.3% · Other 1.6%
- 2008→2024 swing
- -28.5pp toward R · 2008: -25.9pp · 2024: -54.3pp
- All cycles
- 2024: R+54.3 2020: R+50.4 2016: R+52.8 2012: R+44.6 2008: R+25.9
Not yet ingested
- Civics
- —
Market trends
- HPI YoY
- ▼ -45.60%
- Current HPI
- 210.0114
- Rent YoY
- ▲ 4.25%
- Metro
- Beckley, WV
- State GDP YoY
- —
- F500 in state
- 0
Price history
+207.1% since first listed2 events — show timeline
- 2026-04-17 Listed $107,500 BBOR
- 2002-02-26 Sold (Public Records) $35,000 Public Records
Property tax history
-2.3%/yrLatest (2025): $788 · +7.3% YoY. Source: county tax records.
Cash-flow waterfall
monthlySold comps — $/sqft
last 12 mo · ≤1 miLoading sold comps…