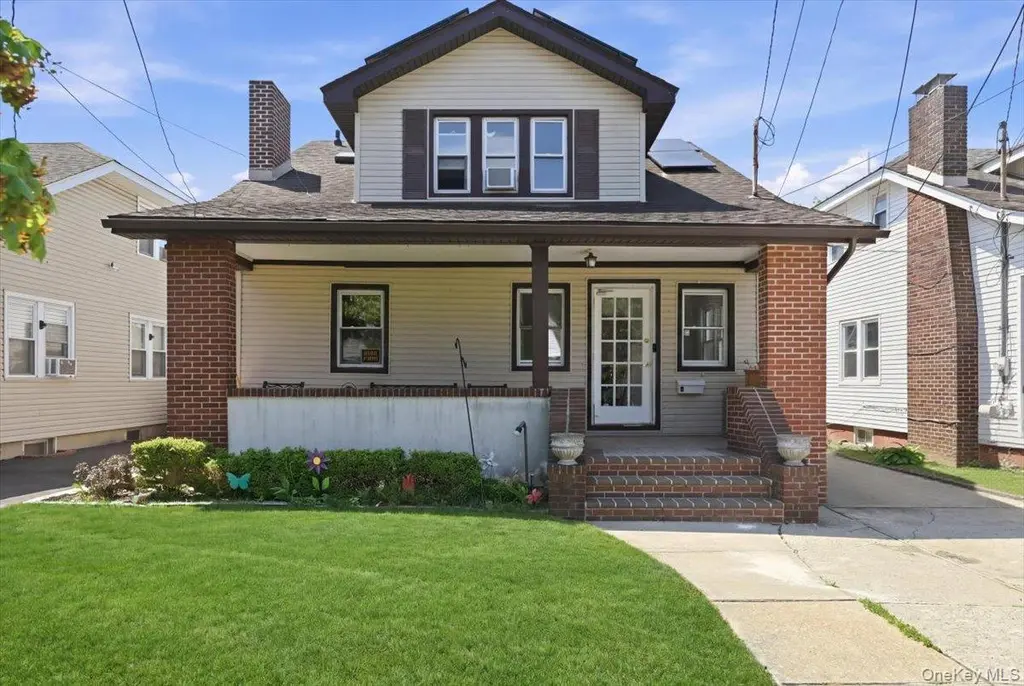
8 Foster Pl · Hempstead, NY
Flood risk 1/10 · Minimal
- FEMA flood zone
- X (unshaded)
- Chance of flooding over 30 yrs
- 0.0%
- Est. flood insurance / yr
- $473 – $860
Fire risk 1/10 · Minimal
- Est. fire insurance / yr
- $691 – $1,283
Heat risk 6/10 · Moderate
- Hot days now (above 96°F)
- 7 days/yr
- Hot days in 30 yrs
- 16 days/yr
Wind risk 6/10 · Moderate
- Chance of severe wind over 30 yrs
- 58.0%
Air-quality risk 4/10 · Minor
- Unhealthy air days now
- 5 days/yr
- Unhealthy air days in 30 yrs
- 8 days/yr
Risk factors via First Street. Map © Google.
Why this score? — see what drove the C grade
The composite is a weighted blend of 9 inputs, each scored 0–100. Each bar is that input's sub-score; the figure is the points it added to the 100-point composite (weight × sub-score).
- Cash flow +16.7/30.0
- ARV discount +15.0/15.0
- Schools +5.8/10.0
- DSCR +5.2/10.0
- Livability +4.0/5.0
- 1% rule +3.9/10.0
- Rent growth +2.5/5.0
- Condition / age +2.5/5.0
- Appreciation +0.0/10.0
$599,999
🖨 Deal sheet 📄 Offer letter ✓ Due diligence
Listing remarks
Welcome to 8 Foster Place, a spacious and well-maintained Hempstead home offering versatility, charm, and room to grow. Set behind a welcoming front porch, this 5 bedroom, 2 full bath residence features a functional layout with generous living space across multiple levels. Inside, hardwood floors run throughout much of the home, adding warmth and continuity to the interior. The expansive layout provides flexibility for larger households, guest space, a home office setup, or multi-generational living. Natural light fills the home, creating a bright and comfortable atmosphere throughout. The backyard is designed for both everyday enjoyment and entertaining, featuring a paver patio with space
Key facts
- Natural light
- Functional layout
- Paver patio
Tags
Property features AI
Exterior
- Parking: Private driveway
- Utilities: Electricity connected (PSEG); Natural gas connected; Public sewer
- Home design: Single family residence; Two-story
- Construction: Vinyl siding construction
- Exterior features: Vinyl siding; Not waterfront; No additional parcels
Interior
- Kitchen: Dishwasher; Gas oven; Refrigerator
- Bedrooms: Includes a bedroom on the first floor
- Bathrooms: 2 full bathrooms
- Heating & cooling: Hot water heating (natural gas); No central air conditioning
- Interior features: First-floor bedroom; Partially finished basement; Crawl attic; Two levels; Patio and porch
- Laundry & utility: Washer; Dryer
Neighborhood map
What this means for you Summary
Snapshot
- This is a 5-bed/2.0-bath single-family listed at $600k.
Deal economics
- At list price, monthly cash flow is $370 ($4k/yr) — positive.
- The deal already cash-flows at list — no discount required.
- To meet the 1% rule (rent ≥ 1% of price), the offer needs to be $534k (11.0% below list).
- Recommended offer: $534k (11.0% below list) — sets the bar for 1% rule.
- Cap rate 7.0% vs local median 5.1% in Hempstead — top-decile yield for the area; either an underpriced asset or a hidden risk that comps aren't pricing in. Stress-test before assuming the spread holds.
Location & tenants
- Location reads 79/100 on livability (#123 in NY, #2,002 nationally) — a middle-class / working-renter tenant base. Strengths: amenities A+, commute A+, health & safety A; Watch: crime C-, cost of living F.
- Uniondale Union Free School District (suburban): math 59% / reading 70% proficiency, ranked #164 of 590 in NY (top 28%) — acceptable for families but not a draw, mixed tenant base, ~2y average lease.
- Zoned schools: California Avenue Elementary School (math 24% / reading 24%, grade F, #1,846 of 2,108 statewide, top 91%, 663 students, 63% FRL); Turtle Hook Middle School (math 24% / reading 54%, grade F, #418 of 729 statewide, top 59%, 669 students, 66% FRL); Uniondale High School (math 83% / reading 90%, grade A, #336 of 1,100 statewide, top 31%, 2,080 students, 62% FRL).
- Zoned-school proficiency averages 50% at this address vs 64% district-wide (-14 pts) — the specific schools serving this property underperform the Uniondale Union Free School District average; the district grade overstates school quality for this exact location.
- Market conditions: 167 active listings in the ZIP; 3 comparable units currently listed for rent nearby; rentals leasing fast (median 11d on market — plan ~1-2 weeks tenant-placement turnaround); solid renter incomes; 824 units permitted in Nassau County in 2024 (153 in 5+ unit buildings).
Forward outlook
- Local home prices are declining (-3.0%/yr); year-one equity from $4k of loan paydown is wiped out by about $18k of value loss. Plan a longer hold.
- Nassau County population projected at +7% by 2050 — modest demand growth; plan on rents tracking national, not racing it.
Negotiation context
- Only 6 days on market — expect competitive offers; lowballing is unlikely to land.
- 2 sale attempts with the ask held roughly flat each time — persistent listings suggest the price (not the market) is what's stuck; bring a comps-based counter.
- Current owner paid $130k; list at $600k implies a 362% gain — meaningful room to come down on a strong offer.
Risks & watch-outs
- Watch-outs: built in 1923 — expect roof / HVAC / electrical / plumbing capex.
- Climate carrying-cost: major wind risk, 58% chance of damaging wind over 30y; extreme-heat days projected 7→16/yr by 2055 (HVAC capex compounding) — expect insurance premiums to compound above CPI over the hold.
Questions for the listing agent
- Built in 1923 — when were the roof, HVAC, electrical panel, plumbing, and water heater last replaced?
- Is there a deadline driving the sale (1031 exchange, divorce, estate, relocation)? That informs how much negotiation room exists.
- Schools are D-rated, which usually means shorter tenancies and higher turnover. Who's the typical renter profile here, and what's been the actual vacancy rate?
- What's the average days-on-market for RENTAL listings here right now (not sales)? A rising rental-DOM trend means longer vacancies and softer asking-rent achievability than the comps imply.
- What's the recent tenant-quality profile in this submarket — average credit score on applications, eviction rate, late-payment / NSF rate, and stable-employment percentage? A property-management company in the area should have these aggregated.
- How much new for-sale + rental construction is in the pipeline within 1–3 miles? Heavy new supply typically softens prices + rents 12–24 months out; constrained supply supports both.
Investment metrics
- 1% rule
- 0.89% ✗
- Cap rate
- 7.03%
- Cash-on-cash
- 2.65%
- DSCR
- 1.12
- GRM
- 9.4
CMA / ARV
- ARV (median comp)
- $768,010
- List price
- $599,999
- Delta
- -21.88%
- Verdict
- UNDERPRICED
- Comps
- 20 within 1.0 mi
Show comp detail 10 sales within ~0.75 mi
| Address | Dist | Beds/Ba | Sqft | Sold | Price | $/sf | Match |
|---|---|---|---|---|---|---|---|
| 7 Stanley Pl | 0.14mi | 4/2.0 (-1) | 1,125 (+3%) | 6mo | $750,000 | $667 | 78 |
| 541 Bedford Ave | 0.49mi | 4/2.0 (-1) | 1,109 (+2%) | 6mo | $700,000 | $631 | 64 |
| 41 Perry St | 0.49mi | 5/3.0 | 1,203 (+10%) | 2mo | $889,000 | $739 | 54 |
| 26 California Ave | 0.72mi | 4/2.0 (-1) | 1,100 (+1%) | 11mo | $576,500 | $524 | 51 |
| 112 Rutland Rd | 0.45mi | 5/3.0 | 1,214 (+11%) | 6mo | $720,000 | $593 | 51 |
| 434 Greenwich St | 0.32mi | 4/1.0 (-1) | 1,010 (-8%) | 20mo | $536,000 | $531 | 47 |
| 160 Argyle Ave | 0.55mi | 4/3.0 (-1) | 950 (-13%) | 2mo | $693,598 | $730 | 42 |
| 49 Perry St | 0.48mi | 4/3.0 (-1) | 1,242 (+14%) | 13mo | $640,000 | $515 | 35 |
| 466 Maple Ave | 0.73mi | 4/2.0 (-1) | 1,190 (+9%) | 21mo | $647,500 | $544 | 29 |
| 461 Greengrove Ave | 0.71mi | 4/2.0 (-1) | 1,240 (+14%) | 16mo | $620,000 | $500 | 26 |
Match score weights: distance 35% · size 25% · config 20% · recency 20%. Top-matched comps best support the ARV.
Projected returns pro-forma
-3.0% appreciation · 3.0% rent growth · sell at horizon
- IRR
- -12.1%
- Equity multiple
- 0.56×
- Total profit
- $-73,740
- Equity at exit
- $89,462
- IRR
- -3.0%
- Equity multiple
- 0.80×
- Total profit
- $-34,254
- Equity at exit
- $51,877
Cash invested: $168,000 (down + closing). Projections, not guarantees.
Landlord ↔ Tenant lean methodology
- Overall (STATE)
- 15 Strongly Tenant-Friendly
- State New York
- 15 Strongly Tenant-Friendly · D+10
- County
- — inherits STATE
- City
- — inherits STATE
ZIP-level market 11550
- Active inventory
- 167
- Price-to-rent
- 9.4×
Monthly cashflow live
- Estimated rent
- $5,341 medium interval (Pro) →
- Mortgage (P&I)
- −$3,146
- Tax from tax record
- −$453 /mo · $5,430/yr
- Insurance
- −$250
- HOA
- −$0
- Vacancy / Maint / Mgmt
- −$1,122
- Net cashflow
- $370
Break-even live
UW: 25.0% down · 7.5% · 30yr · 1.5% tax · 5.0% vac · 8.0% maint · 8.0% mgmt
Financing live
Cash to close
- Down payment
- $150,000
- Closing costs
- $18,000
- Reserves months
- —
- Total cash needed
- —
Loan-product check · same deal, 3 products live
Conventional
25% down · 7.5% · 30yr
- Down + closing
- —
- Monthly P&I
- —
- Monthly cashflow
- —
- DSCR
- —
- Eligible?
- —
Personal DTI + credit; lowest rate.
DSCR
20% down · 8.5% · 30yr
- Down + closing
- —
- Monthly P&I
- —
- Monthly cashflow
- —
- DSCR
- —
- Eligible?
- —
No personal income docs; deal must DSCR.
Hard money
10% down · 12.0% · 12mo
- Down + closing
- —
- Monthly P&I
- —
- Monthly cashflow
- —
- DSCR
- —
- Eligible?
- —
Short-term bridge; refi at stabilization.
Rent comps 3 comps
| Address | Beds | Baths | Sqft | Rent | $/sqft | DOM | Units | Dist |
|---|---|---|---|---|---|---|---|---|
| 21 Union Ave Hempstead, NY | 4.0 | 3.0 | 1342 | $5,700 | $4.25 | 1d | 1 | 0.97mi |
| 67 W Marshall St Hempstead, NY | 6.0 | 2.0 | 1400 | $4,800 | $3.43 | 11d | 1 | 1.20mi |
| 204 Wellington St Hempstead, NY | 4.0 | 2.0 | 1075 | $4,300 | $4.00 | 22d | 1 | 1.32mi |
Listing history 4 events
-
2026-06-08statusdays on market $599,999 Pending 6 DOM
-
2026-05-13$599,999 Active 1085-char remark
-
2025-12-29$630,000 Active
-
1989-06-06soldstatus $130,000
ⓘ Source: listings_history table (triggers on properties + properties_extension) + one-shot
backfill from property_details.listing_events for pre-trigger history.
Tax reassessment forecast NY · Partial reset (capped growth)
- Current annual tax
- $5,430 · $453/mo
- Projected year-2 tax
- $7,785 · $649/mo
- Expected delta
- +$2,355/yr (+$196/mo · 43.4%)
ⓘ Screening estimate from a state-policy table — verify with the county assessor before closing.
Climate risk First Street
- Flood 1/10 Low FEMA zone X (unshaded) · 0% chance over 30 yrs
- Wildfire 1/10 Low
- Heat 6/10 Major 7 d/yr ≥96°F today · 16 d/yr by 30 yrs out
- Wind 6/10 Major 58% chance of damaging wind over 30 yrs
- Air quality 4/10 Moderate 5 unhealthy d/yr today · 8 by 30 yrs out
Nearby sold comps map
Loading sold comps map…
Walkable amenities ~0.75 mi
Loading nearby amenities…
Taxation est. · year 1
- Rental income
- $64,091
- − Mortgage interest
- −$33,609
- − Property taxes
- −$5,430
- − Insurance
- −$3,000
- − Repairs & maintenance
- −$5,127
- − Management
- −$5,127
- − Depreciation
- −$17,455
- Taxable loss
- −$5,658
- Est. tax savings @ 24.0%
- +$1,358
- After-tax cash flow
- $5,802/yr
For passive investors: Depreciation is non-cash, so a rental often shows a tax loss while cash-flowing — sheltering income. Rental losses are passive: they offset passive income freely, and up to $25,000/yr can offset ordinary (W-2) income if you actively participate and your MAGI is under $100k (phasing out to $0 by $150k); unused losses carry forward. On sale, claimed depreciation is recaptured at up to 25%, and gains may owe capital-gains tax (a 1031 exchange can defer both). Figures are a year-1 estimate at your 24.0% rate — not tax advice; consult a CPA.
Schools (NCES district)
- District
- Uniondale Union Free School District
- NCES district ID
- 3629280
- Math proficiency
- 59% ▲ 8.00%
- Reading proficiency
- 70% ▲ 17.00%
- Median HH income
- $78,596
- Composite
- 57.5/100
- National rank
- #1071
- State rank
- #164 of 590 in NY
Livability — Hempstead
- Score
- 79/100
- State rank
- #123
- US rank
- #2002
Category grades
Schools grade is shown separately in the Schools card above.
Census & demographics
- Census place
- Hempstead, NY
- County
- Nassau County · 653,051 people
- City population
- 60,960
- Metro
- New York-Newark-Jersey City, NY-NJ-PA
- Population (ZIP)
- 60,960
- Household income
- $92,677
- Rent vs Own
- Severe rent burden
- 2535.0
Population outlook (Nassau County) Hauer SSP2
- Today (2025)
- 1,409,302 people
- By 2030
- 1,431,482 · +1.6%
- By 2040
- 1,471,607 · +4.4%
- By 2050
- 1,502,845 · +6.6%
- By 2075
- 1,575,403 · +11.8%
- By 2100
- 1,554,356 · +10.3%
Race, ethnicity, and origin ACS 2023
- Neighborhood character
- Diverse neighborhood (Simpson 0.62)
- Race & ethnicity
- Hispanic / Latino 44% Black 43% Two or more races 14% White 7% Asian 2%
- Hispanic origin (detail)
- Mexican 1% Puerto Rican 3% Dominican 4%
- Common ancestry
- Hispanic 4%
- Foreign-born
- 37% · Canada, Jamaica
- Languages at home
- 53% English-only · Spanish 40% French/Haitian/Cajun 4% Other Indo-European 1%
Political lean MEDSL · Nassau
- 2024 margin
- Toss-up / Even · D 47.9% · R 52.1%
- 2008→2024 swing
- -12.6pp toward R · 2008: 8.4pp · 2024: -4.2pp
- All cycles
- 2024: R+4.2 2020: D+9.5 2016: D+5.3 2012: D+6.7 2008: D+8.4
Not yet ingested
- Civics
- —
Market trends
- HPI YoY
- ▼ -297.72%
- Current HPI
- 339.055
- Rent YoY
- —
- Metro
- New York-Newark-Jersey City, NY-NJ-PA
- State GDP YoY
- ▲ 2.60%
- F500 in state
- 92
Industry mix (Fortune 500 HQ in NY)
| Industry | F500 HQs | Revenue |
|---|---|---|
| Financial Services | 10 | $950B |
|
||
| Consumer Goods | 9 | $162B |
|
||
| Insurance | 4 | $225B |
|
||
| Telecommunications | 2 | $144B |
|
||
| Pharmaceuticals | 2 | $112B |
|
||
| Media / Entertainment | 2 | $69B |
|
||
Price history
+361.5% since first listed4 events — show timeline
- 2026-06-08 Pending — OneKey® MLS as Distributed by MLS Grid
- 2026-05-13 Listed $599,999 OneKey® MLS as Distributed by MLS Grid
- 2025-12-29 Listed $630,000 OneKey® MLS as Distributed by MLS Grid
- 1989-06-06 Sold (Public Records) $130,000 Public Records
Property tax history
+2.4%/yrLatest (2024): $5,430 · +10.4% YoY. Source: county tax records.
Cash-flow waterfall
monthlySold comps — $/sqft
last 12 mo · ≤1 miLoading sold comps…