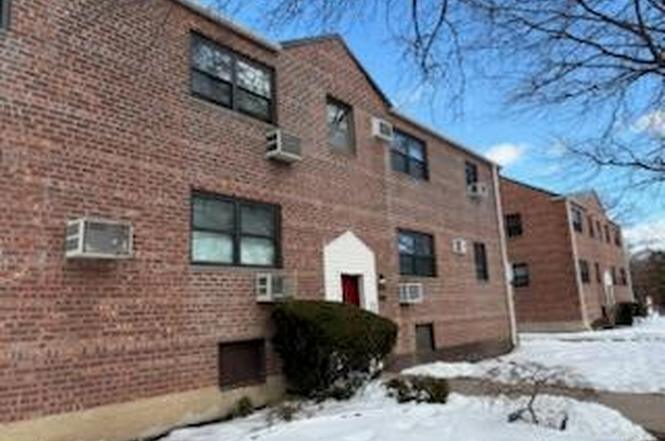
8017 156th Ave #129 · New York, NY
Flood risk 7/10 · Major
- FEMA flood zone
- X (unshaded)
- Chance of flooding over 30 yrs
- 0.59%
- Est. flood insurance / yr
- $507 – $1,088
Fire risk 2/10 · Minimal
- Est. fire insurance / yr
- $691 – $1,283
Heat risk 7/10 · Major
- Hot days now (above 99°F)
- 7 days/yr
- Hot days in 30 yrs
- 15 days/yr
Wind risk 6/10 · Moderate
- Chance of severe wind over 30 yrs
- 69.0%
Air-quality risk 5/10 · Moderate
- Unhealthy air days now
- 6 days/yr
- Unhealthy air days in 30 yrs
- 8 days/yr
Risk factors via First Street. Map © Google.
Why this score? — see what drove the C grade
The composite is a weighted blend of 9 inputs, each scored 0–100. Each bar is that input's sub-score; the figure is the points it added to the 100-point composite (weight × sub-score).
- Cash flow +22.5/30.0
- ARV discount +7.5/15.0
- DSCR +7.2/10.0
- 1% rule +5.9/10.0
- Schools +5.0/10.0
- Livability +3.8/5.0
- Rent growth +2.5/5.0
- Condition / age +2.2/5.0
- Appreciation +0.0/10.0
$329,000
🖨 Deal sheet (PDF) 📄 Offer letter ✓ Due diligence
Listing remarks
Welcome to Lindenwood Gardens in Howard Beach. This garden 2nd floor CO-OP Features 5 rooms. It is a 3 bedroom used as a 2 bedroom. Updated kitchen w/ granite counter & marble ceramic floor with all appliances. There is a formal dining room (Orginally a 3rd bedroom). The Living room has planty of sunlight with its southern exposure. We have the 2 bedrooms and updated full bath and plenty of closets. Laundry room in complex . Private parking garage. There is a shopping center close by and the Q11 Ecpress bus.
Key facts
- Marble ceramic floor
- Formal dining room
- Granite counter
Tags
Property features AI
Exterior
- Parking: On-street parking
- Utilities: Sewer: Other; Utilities: None
- Home design: Stock cooperative
- Construction: Brick construction
- Exterior features: Brick exterior; Not waterfront
Interior
- Kitchen: Dishwasher; Microwave; Refrigerator
- Bedrooms: Entry level bedrooms on level 2
- Bathrooms: 1 full bathroom
- Heating & cooling: Hot water heating; Natural gas heating; Other heating; Wall/window air conditioning unit(s)
- Interior features: Other interior features
Neighborhood map
What this means for you Summary
Snapshot
- This is a 3-bed/1.0-bath condo listed at $329k. Condition is rated fair.
Deal economics
- At list price, monthly cash flow is $488 ($6k/yr) — positive.
- The deal already cash-flows at list — no discount required.
- Meets the 1% rule at list price ($4k rent vs $329k).
- Recommended offer: $309k (6.0% below list) — sets the bar for market timing.
- Cap rate 8.3% vs local median 2.6% in New York — top-decile yield for the area; either an underpriced asset or a hidden risk that comps aren't pricing in. Stress-test before assuming the spread holds.
Location & tenants
- Location reads 75/100 on livability (#268 in NY, #4,188 nationally) — a middle-class / working-renter tenant base. Strengths: amenities A+, commute A+, health & safety A; Watch: crime F, cost of living F.
- Market conditions: 260 active listings in the ZIP; 9 comparable units currently listed for rent nearby; rentals at typical pace (median 25d on market — plan ~3-4 weeks tenant-placement turnaround); solid renter incomes; 5,302 units permitted in Queens County in 2024 (4,918 in 5+ unit buildings).
- At $3,580/mo this rent would consume 45% of the median local household income ($95k/yr) (locally 985% of renters already pay >50% of income on rent) — very limited rent-growth headroom before tenants either downsize or default.
Forward outlook
- Local home prices are declining (-3.0%/yr); year-one equity from $2k of loan paydown is wiped out by about $10k of value loss. Plan a longer hold.
- Queens County population projected at +16% by 2050 — long-run rental-demand tailwind backs the buy-and-hold thesis.
Negotiation context
- It's been on market 68 days — a 6% lower offer ($309k) is reasonable based on typical stale-listing flexibility.
Risks & watch-outs
- Watch-outs: flood insurance adds $66/mo.
- Climate carrying-cost: major flood risk; major wind risk, 69% chance of damaging wind over 30y; extreme-heat days projected 7→15/yr by 2055 (HVAC capex compounding) — expect insurance premiums to compound above CPI over the hold.
Questions for the listing agent
- It's been on market 68 days. Have you received any prior offers? Is the seller open to a 6% concession, seller financing, or rate buy-down credit?
- Have any recent inspections been done? Can we get a copy of the seller's disclosures and any deferred-maintenance estimates?
- Built in 1960 — when were the roof, HVAC, electrical panel, plumbing, and water heater last replaced?
- What's the actual annual flood-insurance premium (NFIP or private), and is the property in a SFHA with mandatory coverage?
- Any open or pending special assessments — roof, HVAC, plumbing, elevator, façade? What's the per-unit balance and payoff schedule, and is the seller paying it off at close or rolling it to the buyer?
- Why hasn't it sold? Are there any deal-killer items the seller is aware of (foundation, flood, title, zoning, code violations)?
- Is there a deadline driving the sale (1031 exchange, divorce, estate, relocation)? That informs how much negotiation room exists.
- Schools are B-rated — typically a magnet for longer-tenancy family renters. What's the average tenant stay here, and is there a school-zone premium baked into asking?
- Crime grade is F in this area — have there been break-ins, vandalism, or insurance claims at this property in the last 3 years? What carrier currently insures it and at what premium?
- What's the average days-on-market for RENTAL listings here right now (not sales)? A rising rental-DOM trend means longer vacancies and softer asking-rent achievability than the comps imply.
- What's the recent tenant-quality profile in this submarket — average credit score on applications, eviction rate, late-payment / NSF rate, and stable-employment percentage? A property-management company in the area should have these aggregated.
- How much new apartment / multifamily construction is in the pipeline within 1–3 miles? Heavy new supply (>2% of stock underway) typically softens rents 12–24 months out; light construction supports rent growth.
Investment metrics
- 1% rule
- 1.09% ✓
- Cap rate
- 8.31%
- Cash-on-cash
- 7.22%
- DSCR
- 1.32
- GRM
- 7.7
CMA / ARV
No comps found within radius.
Projected returns pro-forma
-3.0% appreciation · 3.0% rent growth · sell at horizon
- IRR
- -6.5%
- Equity multiple
- 0.76×
- Total profit
- $-22,151
- Equity at exit
- $49,055
- IRR
- 3.2%
- Equity multiple
- 1.23×
- Total profit
- $21,099
- Equity at exit
- $28,446
Cash invested: $92,120 (down + closing). Projections, not guarantees.
Landlord ↔ Tenant lean methodology
- Overall (CITY)
- 0 Strongly Tenant-Friendly
- State New York
- 15 Strongly Tenant-Friendly · D+10
- County
- — inherits STATE
- City New York
- 0 Strongly Tenant-Friendly · D+34
ZIP-level market 11414
- Active inventory
- 260
- Price-to-rent
- 7.7×
Monthly cashflow live
- Estimated rent
- $3,580 high interval (Pro) →
- Mortgage (P&I)
- −$1,725
- Tax est. 1.5%
- −$411 /mo · $4,935/yr
- Insurance
- −$137
- Flood insurance flood zone
- −$66 /mo · $798/yr
- HOA
- −$0
- Vacancy / Maint / Mgmt
- −$752
- Net cashflow
- $488
Break-even live
Sensitivity live
| Price | -10% $715 | -5% $601 | +0% $488 | +5% $374 | +10% $260 |
|---|---|---|---|---|---|
| Rent | -10% $205 | -5% $346 | +0% $488 | +5% $629 | +10% $771 |
| Rate | -1.0pp $653 | -0.5pp $571 | base $488 | +0.5pp $403 | +1.0pp $316 |
UW: 25.0% down · 7.5% · 30yr · 1.5% tax · 5.0% vac · 8.0% maint · 8.0% mgmt
Financing live
Cash to close
- Down payment
- $82,250
- Closing costs
- $9,870
- Reserves months
- —
- Total cash needed
- —
Loan-product check · same deal, 3 products live
Conventional
25% down · 7.5% · 30yr
- Down + closing
- —
- Monthly P&I
- —
- Monthly cashflow
- —
- DSCR
- —
- Eligible?
- —
Personal DTI + credit; lowest rate.
DSCR
20% down · 8.5% · 30yr
- Down + closing
- —
- Monthly P&I
- —
- Monthly cashflow
- —
- DSCR
- —
- Eligible?
- —
No personal income docs; deal must DSCR.
Hard money
10% down · 12.0% · 12mo
- Down + closing
- —
- Monthly P&I
- —
- Monthly cashflow
- —
- DSCR
- —
- Eligible?
- —
Short-term bridge; refi at stabilization.
Rent comps 9 comps
| Address | Beds | Baths | Sqft | Rent | $/sqft | DOM | Units | Dist |
|---|---|---|---|---|---|---|---|---|
| 156-49 76th St Unit 2 Jamaica, NY | 3.0 | 2.0 | 1250 | $3,300 | $2.64 | 18d | 1 | 0.25mi |
| 14912 83rd St Howard Beach, NY | 3.0 | 2.0 | 1250 | $3,200 | $2.56 | 25d | 1 | 0.40mi |
| 13214 81st St Ozone Park, NY | 3.0 | 1.0 | 1280 | $4,100 | $3.20 | 12d | 1 | 0.82mi |
| 132-13 81st St #1 Jamaica, NY | 3.0 | 1.0 | 1280 | $4,100 | $3.20 | 4d | 1 | 0.82mi |
| 155-69 99th St Unit 2nd Floor Jamaica, NY | 3.0 | 1.5 | 1500 | $3,200 | $2.13 | 21d | 1 | 0.95mi |
| 10541 90th St Ozone Park, NY | 3.0 | 2.0 | 1264 | $4,111 | $3.25 | 25d | 1 | 1.12mi |
| 134-31 Hawtree St Unit 1 Jamaica, NY | 2.0 | 1.0 | 2176 | $3,300 | $1.52 | 25d | 1 | 1.15mi |
| 10124 78th St Ozone Park, NY | 3.0 | 1.0 | 2299 | $3,500 | $1.52 | 25d | 1 | 1.20mi |
| 9309 103rd Ave Ozone Park, NY | 3.0 | 1.5 | 1892 | $3,000 | $1.59 | 25d | 1 | 1.37mi |
HOA detail condo
- Monthly dues
- $0 · $0/yr
- Assessments
- None detected in remarks — confirm with the listing agent.
Listing history 3 events
-
2026-04-21status Pending
-
2026-03-24price $329,000
-
2026-02-12$349,000 Active
ⓘ Source: listings_history table (triggers on properties + properties_extension) + one-shot
backfill from property_details.listing_events for pre-trigger history.
Climate risk First Street
- Flood 7/10 Severe FEMA zone X (unshaded) · 59% chance over 30 yrs
- Wildfire 2/10 Low
- Heat 7/10 Severe 7 d/yr ≥99°F today · 15 d/yr by 30 yrs out
- Wind 6/10 Major 69% chance of damaging wind over 30 yrs
- Air quality 5/10 Major 6 unhealthy d/yr today · 8 by 30 yrs out
Nearby sold comps map
Loading sold comps map…
Walkable amenities ~0.75 mi
Loading nearby amenities…
Taxation est. · year 1
- Rental income
- $42,955
- − Mortgage interest
- −$18,429
- − Property taxes
- −$4,935
- − Insurance
- −$2,442
- − Repairs & maintenance
- −$3,436
- − Management
- −$3,436
- − Depreciation
- −$9,571
- Taxable income
- $705
- Est. tax owed @ 24.0%
- −$169
- After-tax cash flow
- $5,684/yr
For passive investors: Depreciation is non-cash, so a rental often shows a tax loss while cash-flowing — sheltering income. Rental losses are passive: they offset passive income freely, and up to $25,000/yr can offset ordinary (W-2) income if you actively participate and your MAGI is under $100k (phasing out to $0 by $150k); unused losses carry forward. On sale, claimed depreciation is recaptured at up to 25%, and gains may owe capital-gains tax (a 1031 exchange can defer both). Figures are a year-1 estimate at your 24.0% rate — not tax advice; consult a CPA.
Condition & rehab AI · 12 photos
The property is in fair condition with moderate rehabilitation needs, including kitchen appliances and landscaping. Upgrades in these areas can significantly increase its value.
Repairs flagged
- Minor Kitchen appliances — Appears dated and may need replacement.
- Major Landscaping — Minimal landscaping and snow present, may need improvement.
Value-add opportunities
- Resale New kitchen appliances — Modern appliances can significantly enhance the appeal of the kitchen.
- Both Landscaping improvements — Enhances curb appeal and can attract more potential buyers or renters.
Renovation cost estimate screening
| Repair item | Severity | Est. cost |
|---|---|---|
| Kitchen appliances · Appears dated and may need replacement. | Minor | $500–3,000 |
| Landscaping · Minimal landscaping and snow present, may need improvement. | Major | $15,000–50,000 |
| Total estimated repair cost · 2 items | $15,500–53,000 |
Value-add ROI direction
- Resale New kitchen appliances — Modern appliances can significantly enhance the appeal of the kitchen. ↑
- Both Landscaping improvements — Enhances curb appeal and can attract more potential buyers or renters. ↑
ⓘ Cost ranges are severity-bucket heuristics (US national rule-of-thumb). Get contractor quotes + a written scope before underwriting a rehab budget.
Schools (NCES district)
No district data.
Livability — New York
- Score
- 75/100
- State rank
- #268
- US rank
- #4188
Category grades
Schools grade is shown separately in the Schools card above.
Census & demographics
- Census place
- New York, NY
- County
- Queens County · 1,914,869 people
- City population
- 7,731,280
- Metro
- New York-Newark-Jersey City, NY-NJ-PA
- Population (ZIP)
- 31,308
- Household income
- $95,051
- Rent vs Own
- Severe rent burden
- 985.0
Population outlook (Queens County) Hauer SSP2
- Today (2025)
- 2,546,320 people
- By 2030
- 2,643,059 · +3.8%
- By 2040
- 2,815,563 · +10.6%
- By 2050
- 2,944,423 · +15.6%
- By 2075
- 3,123,338 · +22.7%
- By 2100
- 3,098,688 · +21.7%
Race, ethnicity, and origin ACS 2023
- Neighborhood character
- Diverse neighborhood (Simpson 0.56)
- Race & ethnicity
- White 61% Hispanic / Latino 25% Two or more races 13% Black 5% Asian 5%
- Hispanic origin (detail)
- Puerto Rican 11% Dominican 6%
- Common ancestry
- Romanian 4% Scotch-Irish 1%
- Foreign-born
- 20% · Canada, Jamaica, China
- Languages at home
- 63% English-only · Spanish 17% Other Indo-European 14% Russian/Polish/Slavic 2%
Political lean MEDSL · Queens
- 2024 margin
- Strong D (+24.6) · D 62.3% · R 37.7%
- 2008→2024 swing
- -26.2pp toward R · 2008: 50.8pp · 2024: 24.6pp
- All cycles
- 2024: D+24.6 2020: D+45.2 2016: D+53.4 2012: D+58.5 2008: D+50.8
Not yet ingested
- Civics
- —
Market trends
- HPI YoY
- ▼ -227.02%
- Current HPI
- 206.6334
- Rent YoY
- —
- Metro
- New York-Newark-Jersey City, NY-NJ-PA
- State GDP YoY
- ▲ 2.60%
- F500 in state
- 92
Industry mix (Fortune 500 HQ in NY)
| Industry | F500 HQs | Revenue |
|---|---|---|
| Financial Services | 10 | $950B |
|
||
| Consumer Goods | 9 | $162B |
|
||
| Insurance | 4 | $225B |
|
||
| Telecommunications | 2 | $144B |
|
||
| Pharmaceuticals | 2 | $112B |
|
||
| Media / Entertainment | 2 | $69B |
|
||
Price history
-5.7% since first listed3 events — show timeline
- 2026-04-21 Pending — OneKey® MLS as Distributed by MLS Grid
- 2026-03-24 Price Changed $329,000 OneKey® MLS as Distributed by MLS Grid
- 2026-02-12 Listed $349,000 OneKey® MLS as Distributed by MLS Grid
Cash-flow waterfall
monthlySold comps — $/sqft
last 12 mo · ≤1 miLoading sold comps…