1010 Siesta Ln · Lake Isabella, MI
Flood risk 1/10 · Minimal
- FEMA flood zone
- X (unshaded)
- Chance of flooding over 30 yrs
- 0.0%
- Est. flood insurance / yr
- $507 – $1,088
Fire risk 3/10 · Minor
- Est. fire insurance / yr
- $784 – $1,456
Heat risk 2/10 · Minimal
- Hot days now (above 96°F)
- 7 days/yr
- Hot days in 30 yrs
- 14 days/yr
Wind risk 1/10 · Minimal
- Chance of severe wind over 30 yrs
- —
Air-quality risk 2/10 · Minimal
- Unhealthy air days now
- 1 days/yr
- Unhealthy air days in 30 yrs
- 2 days/yr
Risk factors via First Street. Map © Google.
Why this score? — see what drove the D+ grade
The composite is a weighted blend of 9 inputs, each scored 0–100. Each bar is that input's sub-score; the figure is the points it added to the 100-point composite (weight × sub-score).
- Cash flow +16.5/30.0
- Appreciation +10.0/10.0
- DSCR +5.1/10.0
- 1% rule +3.5/10.0
- Livability +3.5/5.0
- ARV discount +3.0/15.0
- Schools +2.8/10.0
- Rent growth +2.5/5.0
- Condition / age +2.5/5.0
$109,900
🖨 Deal sheet (PDF) 📄 Offer letter ✓ Due diligence
Listing remarks MLS
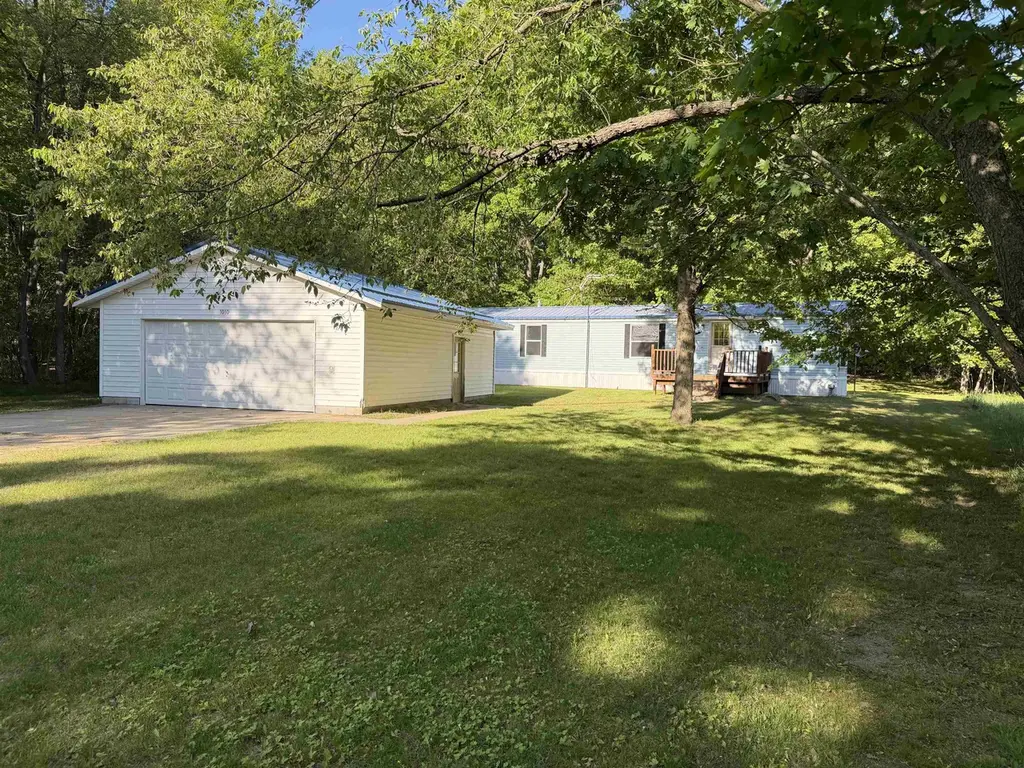
Perfect for an affordable cottage get away or a cozy full-time home. This home offers incredible potential! Tucked away on 2 lots that ensures privacy, while located in the desirable Lake Isabella community, near Central Michigan’s premier 800 acre all-sports lake and access to The Pines Golf Course. The bright, open-concept living area flows directly into a functional kitchen. A major highlight of this property is the detached two-car garage, providing the perfect setup for storing your vehicles, watercraft, golf carts, or setting up a workshop. Don't wait to make this home yours and enjoy all the amenities Lake Isabella has to offer!
Key facts
- Functional kitchen
- 0.93 acre lot
- 2 garage spots
Tags
Property features AI
Finance
- HOA & community: Homeowners association with annual fee; Subdivision: Lake Isabella; Community tennis courts
Exterior
- Parking: Detached garage with 2 parking spaces
- Utilities: Private well water; Septic tank
- Home design: Single-family residence; Residential property; Approximately 800 above-grade finished square feet
- Construction: Vinyl siding; Slab foundation
- Exterior features: Deck; On or near golf course; Wooded lot
Interior
- Kitchen: Oven; Range; Microwave; Refrigerator; Water softener (owned)
- Bedrooms: 5 total rooms (includes bedrooms and living areas)
- Bathrooms: 1 full bathroom
- Heating & cooling: Forced air heating (natural gas); Ceiling fan(s); Exhaust fan; Has cooling
- Interior features: Pantry; Gas fireplace
- Laundry & utility: Washer; Dryer; Gas water heater
Neighborhood map
What this means for you Summary
Snapshot
- This is a 2-bed/1.0-bath single-family listed at $110k.
Deal economics
- At list price, monthly cash flow is $64 ($762/yr) — positive.
- The deal already cash-flows at list — no discount required.
- To meet the 1% rule (rent ≥ 1% of price), the offer needs to be $93k (15.1% below list).
- Recommended offer: $93k (15.1% below list) — sets the bar for 1% rule.
- Cap rate 7.0% vs local median 1.4% in Lake Isabella — top-decile yield for the area; either an underpriced asset or a hidden risk that comps aren't pricing in. Stress-test before assuming the spread holds.
Location & tenants
- Location reads 70/100 on livability (#329 in MI) — a middle-class / working-renter tenant base. Strengths: crime A+, employment A+, cost of living A+; Watch: amenities F, commute F, health & safety D-.
- Chippewa Hills School District (rural): math 24% / reading 42% proficiency, ranked #324 of 540 in MI (top 60%) — families likely to look elsewhere, expect single-tenant / working-renter base with shorter leases.
- Zoned schools: Mecosta Elementary School (math 42% / reading 52%, grade D-, #433 of 1,397 statewide, top 34%, 228 students, 66% FRL); Chippewa Hills Intermediate School (math 17% / reading 37%, grade F, #372 of 493 statewide, top 77%, 513 students, 69% FRL); Chippewa Hills High School (math 27% / reading 57%, grade F, #264 of 713 statewide, top 41%, 476 students, 59% FRL).
- Market conditions: 78 active listings in the ZIP; 72 units permitted in Isabella County in 2024 (0 in 5+ unit buildings).
Forward outlook
- In year one you build about $12k of equity ($760 loan paydown + $11k appreciation (10.0% local appreciation)).
- Isabella County population projected at +9% by 2050 — modest demand growth; plan on rents tracking national, not racing it.
- At projected returns (10.0% appreciation + 3.0% rent growth), your $31k cash investment doubles in ~3 years — after that, you're playing with house money.
- By year 4, paydown + projected appreciation supports a ~$42k cash-out refi (75% LTV) — recoverable capital for the next deal without selling this one.
Negotiation context
- Only 3 days on market — expect competitive offers; lowballing is unlikely to land.
- 2 sale attempts with the ask held roughly flat each time — persistent listings suggest the price (not the market) is what's stuck; bring a comps-based counter.
Questions for the listing agent
- Is there a deadline driving the sale (1031 exchange, divorce, estate, relocation)? That informs how much negotiation room exists.
- Schools are D-rated, which usually means shorter tenancies and higher turnover. Who's the typical renter profile here, and what's been the actual vacancy rate?
- The area grade is low — what's the realistic commute time and amenity access for the typical tenant pool here? Any planned neighborhood developments (good or bad) we should know about?
- What's the average days-on-market for RENTAL listings here right now (not sales)? A rising rental-DOM trend means longer vacancies and softer asking-rent achievability than the comps imply.
- What's the recent tenant-quality profile in this submarket — average credit score on applications, eviction rate, late-payment / NSF rate, and stable-employment percentage? A property-management company in the area should have these aggregated.
- How much new for-sale + rental construction is in the pipeline within 1–3 miles? Heavy new supply typically softens prices + rents 12–24 months out; constrained supply supports both.
Investment metrics
- 1% rule
- 0.85% ✗
- Cap rate
- 6.99%
- Cash-on-cash
- 2.48%
- DSCR
- 1.11
- GRM
- 9.8
CMA / ARV
- ARV (on-the-fly)
- $100,000
- Comps found
- 1
Show comp detail 1 sale within ~0.75 mi
| Address | Dist | Beds/Ba | Sqft | Sold | Price | $/sf | Match |
|---|---|---|---|---|---|---|---|
| 1010 Siesta Ln | 0.00mi | 2/1.0 | 800 (0%) | 0mo | $100,000 | $125 | 100 |
Match score weights: distance 35% · size 25% · config 20% · recency 20%. Top-matched comps best support the ARV.
Projected returns pro-forma
10.0% appreciation · 3.0% rent growth · sell at horizon
- IRR
- 26.0%
- Equity multiple
- 3.08×
- Total profit
- $63,860
- Equity at exit
- $99,007
- IRR
- 22.9%
- Equity multiple
- 7.01×
- Total profit
- $184,801
- Equity at exit
- $213,512
Cash invested: $30,772 (down + closing). Projections, not guarantees.
Landlord ↔ Tenant lean methodology
- Overall (STATE)
- 62 Landlord-Friendly
- State Michigan
- 62 Landlord-Friendly · EVEN
- County
- — inherits STATE
- City
- — inherits STATE
ZIP-level market 48893
- Home prices YoY
- 6.6%
- Active inventory
- 78
- Price-to-rent
- 9.8×
Monthly cashflow live
- Estimated rent
- $933 medium interval (Pro) →
- Mortgage (P&I)
- −$576
- Tax from tax record
- −$52 /mo · $621/yr
- Insurance
- −$46
- HOA
- −$0
- Lot rent
- −$0
- Vacancy / Maint / Mgmt
- −$196
- Net cashflow
- $64
Break-even live
Sensitivity live
| Price | -10% $126 | -5% $95 | +0% $64 | +5% $32 | +10% $1 |
|---|---|---|---|---|---|
| Rent | -10% $-10 | -5% $27 | +0% $64 | +5% $100 | +10% $137 |
| Rate | -1.0pp $119 | -0.5pp $91 | base $64 | +0.5pp $35 | +1.0pp $6 |
UW: 25.0% down · 7.5% · 30yr · 1.5% tax · 5.0% vac · 8.0% maint · 8.0% mgmt
Financing live
Cash to close
- Down payment
- $27,475
- Closing costs
- $3,297
- Reserves months
- —
- Total cash needed
- —
Loan-product check · same deal, 3 products live
Conventional
25% down · 7.5% · 30yr
- Down + closing
- —
- Monthly P&I
- —
- Monthly cashflow
- —
- DSCR
- —
- Eligible?
- —
Personal DTI + credit; lowest rate.
DSCR
20% down · 8.5% · 30yr
- Down + closing
- —
- Monthly P&I
- —
- Monthly cashflow
- —
- DSCR
- —
- Eligible?
- —
No personal income docs; deal must DSCR.
Hard money
10% down · 12.0% · 12mo
- Down + closing
- —
- Monthly P&I
- —
- Monthly cashflow
- —
- DSCR
- —
- Eligible?
- —
Short-term bridge; refi at stabilization.
Listing history 5 events
-
2026-06-05statusdays on market $109,900 Pending 3 DOM
-
2026-06-03days on market $109,900 Active 2 DOM
-
2026-06-03remarks 699-char remark
-
2026-06-02remarks 642-char remark
-
2026-06-02$109,900 Active 1 DOM
ⓘ Source: listings_history table (triggers on properties + properties_extension) + one-shot
backfill from property_details.listing_events for pre-trigger history.
Tax reassessment forecast MI · Partial reset (capped growth)
- Current annual tax
- $621 · $52/mo
- Projected year-2 tax
- $1,157 · $96/mo
- Expected delta
- +$536/yr (+$45/mo · 86.2%)
ⓘ Screening estimate from a state-policy table — verify with the county assessor before closing.
Climate risk First Street
- Flood 1/10 Low FEMA zone X (unshaded) · 0% chance over 30 yrs
- Wildfire 3/10 Moderate
- Heat 2/10 Low 7 d/yr ≥96°F today · 14 d/yr by 30 yrs out
- Wind 1/10 Low
- Air quality 2/10 Low 1 unhealthy d/yr today · 2 by 30 yrs out
Nearby sold comps map
Loading sold comps map…
Walkable amenities ~0.75 mi
Loading nearby amenities…
Taxation est. · year 1
- Rental income
- $11,201
- − Mortgage interest
- −$6,156
- − Property taxes
- −$621
- − Insurance
- −$550
- − Repairs & maintenance
- −$896
- − Management
- −$896
- − Depreciation
- −$3,197
- Taxable loss
- −$1,115
- Est. tax savings @ 24.0%
- +$268
- After-tax cash flow
- $1,030/yr
For passive investors: Depreciation is non-cash, so a rental often shows a tax loss while cash-flowing — sheltering income. Rental losses are passive: they offset passive income freely, and up to $25,000/yr can offset ordinary (W-2) income if you actively participate and your MAGI is under $100k (phasing out to $0 by $150k); unused losses carry forward. On sale, claimed depreciation is recaptured at up to 25%, and gains may owe capital-gains tax (a 1031 exchange can defer both). Figures are a year-1 estimate at your 24.0% rate — not tax advice; consult a CPA.
Schools (NCES district)
- District
- Chippewa Hills School District
- NCES district ID
- 2609560
- Math proficiency
- 24% ▼ -10.00%
- Reading proficiency
- 42% ▼ -5.00%
- Median HH income
- $43,598
- Composite
- 28.01/100
- National rank
- #6849
- State rank
- #324 of 540 in MI
Livability — Lake Isabella
- Score
- 70/100
- State rank
- #329
- US rank
- #8104
Category grades
Schools grade is shown separately in the Schools card above.
Census & demographics
- Census place
- Lake Isabella, MI
- Population (ZIP)
- 5,660
Population outlook (Isabella County) Hauer SSP2
- Today (2025)
- 75,111 people
- By 2030
- 77,600 · +3.3%
- By 2040
- 79,890 · +6.4%
- By 2050
- 81,568 · +8.6%
- By 2075
- 86,602 · +15.3%
- By 2100
- 92,201 · +22.8%
Race, ethnicity, and origin ACS 2023
- Neighborhood character
- Predominantly White (88%)
- Race & ethnicity
- White 88% Two or more races 7% Hispanic / Latino 2%
- Common ancestry
- Lithuanian 11% Romanian 5% Italian 2%
- Foreign-born
- 1%
- Languages at home
- 95% English-only · German/W. Germanic 4%
Political lean MEDSL · Isabella
- 2024 margin
- Lean R (+7.5) · D 45.5% · R 53.0% · Other 1.6%
- 2008→2024 swing
- -26.7pp toward R · 2008: 19.2pp · 2024: -7.5pp
- All cycles
- 2024: R+7.5 2020: R+2.5 2016: R+3.7 2012: D+9.3 2008: D+19.2
Not yet ingested
- Civics
- —
Market trends
- HPI YoY
- ▲ 23.65%
- Current HPI
- 381.2
- Rent YoY
- —
- Metro
- —
- State GDP YoY
- ▲ 1.37%
- F500 in state
- 28
Industry mix (Fortune 500 HQ in MI)
| Industry | F500 HQs | Revenue |
|---|---|---|
| Automotive Parts | 3 | $48B |
|
||
| Automotive | 2 | $372B |
|
||
| Chemicals | 1 | $45B |
|
||
| Automotive Retail | 1 | $29B |
|
||
| Healthcare / Medical Devices | 1 | $23B |
|
||
| Automotive Technology | 1 | $20B |
|
||
Price history
+0.0% since first listed2 events — show timeline
- 2026-06-01 Listed $109,900 REALCOMP
- 2026-06-01 Listed $109,900 MiRealSource-MiMLS
Property tax history
+2.1%/yrLatest (2023): $621 · +73.5% YoY. Source: county tax records.
Cash-flow waterfall
monthlySold comps — $/sqft
last 12 mo · ≤1 miLoading sold comps…