1106 Ripplewood Cir · Chandler, TX
Flood risk No data
- FEMA flood zone
- —
- Chance of flooding over 30 yrs
- —
- Est. flood insurance / yr
- —
Fire risk No data
- Est. fire insurance / yr
- —
Heat risk No data
- Hot days now (above threshold)
- —
- Hot days in 30 yrs
- —
Wind risk No data
- Chance of severe wind over 30 yrs
- —
Air-quality risk No data
- Unhealthy air days now
- —
- Unhealthy air days in 30 yrs
- —
Risk factors via First Street. Map © Google.
Why this score? — see what drove the C+ grade
The composite is a weighted blend of 9 inputs, each scored 0–100. Each bar is that input's sub-score; the figure is the points it added to the 100-point composite (weight × sub-score).
- Cash flow +21.0/30.0
- ARV discount +15.0/15.0
- DSCR +6.7/10.0
- 1% rule +6.1/10.0
- Schools +3.7/10.0
- Livability +3.5/5.0
- Rent growth +2.5/5.0
- Condition / age +2.5/5.0
- Appreciation +0.0/10.0
$202,000
🖨 Deal sheet (PDF) 📄 Offer letter ✓ Due diligence
Listing remarks
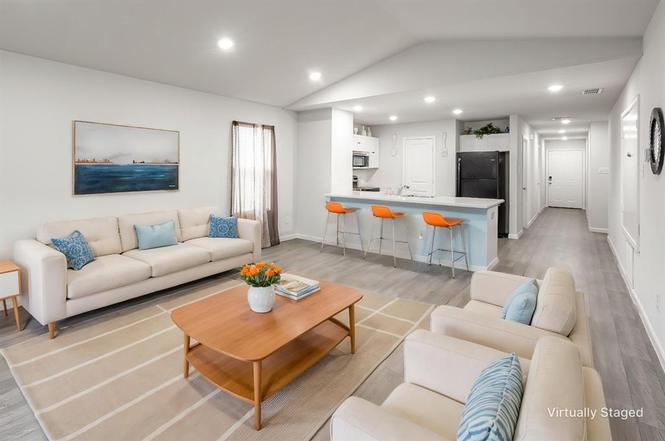
This delightful dream home featuring 4-bedroom, 2-bath home offers the perfect blend of modern convenience and serene countryside charm, complete with a spacious 2-car garage. Nestled in a quaint neighborhood, this property boasts a welcoming ambiance and is framed by lush tree lines providing a sense of tranquility and privacy. Step inside to an inviting open floor plan that seamlessly connects the living, dining, and kitchen areas, creating an ideal space for entertaining and everyday living. The living room is adorned with wood-look vinyl flooring, offering both durability and an elegant aesthetic that flows throughout the home. Large windows infuse the space with natural light, enhancin
Key facts
- Open floor plan
- Ample cabinetry
- Modern appliances
Tags
Property features AI
Finance
- Other: Municipal utility district: No
- Financial info: Association fee $650 annually
- HOA & community: Mandatory association with annual fee (management fees included); HOA managed by Neighborhood Management Inc
Exterior
- Parking: 2 covered spaces; 2-car attached garage with garage door opener, garage faces front; Driveway; Lighted parking area
- Security: Smoke detector(s)
- Utilities: City water; City sewer; Cable available
- Home design: Single family residence; One story; Residential property; Preowned (built 2024)
- Construction: Composition roof; Siding exterior; Slab foundation; Year built 2024
- Exterior features: Interior lot in a subdivision; No fencing listed
Interior
- Kitchen: Dishwasher; Disposal; Electric range
- Bedrooms: Primary bedroom on level 1 with ensuite bath and walk-in closet; Three additional bedrooms on level 1 (split bedrooms layout)
- Flooring: Vinyl flooring
- Bathrooms: 2 full bathrooms
- Heating & cooling: Central heating (electric); Central air (electric)
- Interior features: Open floorplan; Pantry; Walk-in closet(s); Cable TV available; High speed internet available; Window coverings
- Laundry & utility: Utility room with full-size washer/dryer area and washer hookup; Washer included
Neighborhood map
What this means for you Summary
Snapshot
- This is a 4-bed/2.0-bath single-family listed at $202k.
Deal economics
- At list price, monthly cash flow is $285 ($3k/yr) — positive.
- The deal already cash-flows at list — no discount required.
- Meets the 1% rule at list price ($2k rent vs $202k).
- Recommended offer: $190k (6.0% below list) — sets the bar for market timing.
- Cap rate 8.0% vs local median 3.8% in Chandler — top-decile yield for the area; either an underpriced asset or a hidden risk that comps aren't pricing in. Stress-test before assuming the spread holds.
Location & tenants
- Location reads 70/100 on livability (#347 in TX) — a middle-class / working-renter tenant base. Strengths: crime A+, cost of living A+, housing A+; Watch: amenities F, commute F, employment D-.
- Brownsboro ISD (rural): math 42% / reading 46% proficiency, ranked #290 of 826 in TX (top 35%) — families likely to look elsewhere, expect single-tenant / working-renter base with shorter leases.
- Zoned schools: Chandler El (math 42% / reading 37%, grade F, #1,545 of 4,322 statewide, top 38%, 450 students, 74% FRL); Brownsboro J H (math 48% / reading 49%, grade C-, #392 of 1,662 statewide, top 24%, 405 students, 60% FRL); Brownsboro H S (math 31% / reading 63%, grade D-, #591 of 1,632 statewide, top 38%, 757 students, 50% FRL).
- Market conditions: 228 active listings in the ZIP; 2 comparable units currently listed for rent nearby; 263 units permitted in Henderson County in 2024 (0 in 5+ unit buildings).
Forward outlook
- Local home prices are declining (-3.0%/yr); year-one equity from $1k of loan paydown is wiped out by about $6k of value loss. Plan a longer hold.
Negotiation context
- It's been on market 64 days — a 6% lower offer ($190k) is reasonable based on typical stale-listing flexibility.
- 4 sale attempts since 3y ago with the ask held roughly flat each time — persistent listings suggest the price (not the market) is what's stuck; bring a comps-based counter.
Questions for the listing agent
- It's been on market 64 days. Have you received any prior offers? Is the seller open to a 6% concession, seller financing, or rate buy-down credit?
- What does the HOA fee cover, when was the last increase, and are there any pending special assessments or reserve-fund shortfalls?
- Why hasn't it sold? Are there any deal-killer items the seller is aware of (foundation, flood, title, zoning, code violations)?
- Is there a deadline driving the sale (1031 exchange, divorce, estate, relocation)? That informs how much negotiation room exists.
- Schools are D-rated, which usually means shorter tenancies and higher turnover. Who's the typical renter profile here, and what's been the actual vacancy rate?
- What's the average days-on-market for RENTAL listings here right now (not sales)? A rising rental-DOM trend means longer vacancies and softer asking-rent achievability than the comps imply.
- What's the recent tenant-quality profile in this submarket — average credit score on applications, eviction rate, late-payment / NSF rate, and stable-employment percentage? A property-management company in the area should have these aggregated.
- How much new for-sale + rental construction is in the pipeline within 1–3 miles? Heavy new supply typically softens prices + rents 12–24 months out; constrained supply supports both.
Investment metrics
- 1% rule
- 1.11% ✓
- Cap rate
- 7.99%
- Cash-on-cash
- 6.05%
- DSCR
- 1.27
- GRM
- 7.5
CMA / ARV
- ARV (on-the-fly)
- $253,872
- Comps found
- 12
Show comp detail 12 sales within ~0.75 mi
| Address | Dist | Beds/Ba | Sqft | Sold | Price | $/sf | Match |
|---|---|---|---|---|---|---|---|
| 1106 Ripplewood Cir | 0.00mi | 4/2.0 | 1,510 (+2%) | 1mo | $202,000 | $134 | 95 |
| 1003 Ripplewood Cir | 0.05mi | 3/2.0 (-1) | 1,450 (-2%) | 16mo | $249,990 | $172 | 76 |
| 1105 River Oaks Ln | 0.04mi | 3/2.0 (-1) | 1,450 (-2%) | 18mo | $264,490 | $182 | 76 |
| 506 River Oaks Ln | 0.09mi | 3/2.0 (-1) | 1,450 (-2%) | 16mo | $249,990 | $172 | 75 |
| 1004 River Oaks Dr | 0.08mi | 3/2.0 (-1) | 1,447 (-2%) | 16mo | $264,490 | $183 | 74 |
| 102 Parker Oaks Dr | 0.26mi | 3/2.0 (-1) | 1,447 (-2%) | 16mo | $259,990 | $180 | 66 |
| 1002 River Oaks Ln | 0.06mi | 4/2.0 | 1,649 (+12%) | 16mo | $258,990 | $157 | 64 |
| 1010 River Oaks Ln | 0.07mi | 4/2.0 | 1,653 (+12%) | 16mo | $268,990 | $163 | 64 |
| 609 River Oaks Ln | 0.11mi | 4/2.0 | 1,653 (+12%) | 18mo | $275,990 | $167 | 60 |
| 1005 Ripplewood Cir | 0.05mi | 3/2.0 (-1) | 1,294 (-12%) | 16mo | $236,990 | $183 | 59 |
| 508 River Oaks Ln | 0.09mi | 3/2.0 (-1) | 1,294 (-12%) | 17mo | $251,990 | $195 | 56 |
| 530 3rd St | 0.69mi | 3/1.5 (-1) | 1,633 (+11%) | 12mo | $199,000 | $122 | 33 |
Match score weights: distance 35% · size 25% · config 20% · recency 20%. Top-matched comps best support the ARV.
Projected returns pro-forma
-3.0% appreciation · 3.0% rent growth · sell at horizon
- IRR
- -6.9%
- Equity multiple
- 0.74×
- Total profit
- $-14,485
- Equity at exit
- $30,119
- IRR
- 2.7%
- Equity multiple
- 1.20×
- Total profit
- $11,132
- Equity at exit
- $17,465
Cash invested: $56,560 (down + closing). Projections, not guarantees.
Landlord ↔ Tenant lean methodology
- Overall (STATE)
- 87 Strongly Landlord-Friendly
- State Texas
- 87 Strongly Landlord-Friendly · R+5
- County
- — inherits STATE
- City
- — inherits STATE
ZIP-level market 75758
- Home prices YoY
- -27.6%
- Active inventory
- 228
- Price-to-rent
- 7.5×
Monthly cashflow live
- Estimated rent
- $2,243 medium interval (Pro) →
- Mortgage (P&I)
- −$1,059
- Tax from tax record
- −$289 /mo · $3,471/yr
- Insurance
- −$84
- HOA
- −$54
- Lot rent
- −$0
- Vacancy / Maint / Mgmt
- −$471
- Net cashflow
- $285
Break-even live
Sensitivity live
| Price | -10% $399 | -5% $342 | +0% $285 | +5% $228 | +10% $171 |
|---|---|---|---|---|---|
| Rent | -10% $108 | -5% $197 | +0% $285 | +5% $374 | +10% $462 |
| Rate | -1.0pp $387 | -0.5pp $336 | base $285 | +0.5pp $233 | +1.0pp $180 |
UW: 25.0% down · 7.5% · 30yr · 1.5% tax · 5.0% vac · 8.0% maint · 8.0% mgmt
Financing live
Cash to close
- Down payment
- $50,500
- Closing costs
- $6,060
- Reserves months
- —
- Total cash needed
- —
Loan-product check · same deal, 3 products live
Conventional
25% down · 7.5% · 30yr
- Down + closing
- —
- Monthly P&I
- —
- Monthly cashflow
- —
- DSCR
- —
- Eligible?
- —
Personal DTI + credit; lowest rate.
DSCR
20% down · 8.5% · 30yr
- Down + closing
- —
- Monthly P&I
- —
- Monthly cashflow
- —
- DSCR
- —
- Eligible?
- —
No personal income docs; deal must DSCR.
Hard money
10% down · 12.0% · 12mo
- Down + closing
- —
- Monthly P&I
- —
- Monthly cashflow
- —
- DSCR
- —
- Eligible?
- —
Short-term bridge; refi at stabilization.
Rent comps 2 comps
| Address | Beds | Baths | Sqft | Rent | $/sqft | DOM | Units | Dist |
|---|---|---|---|---|---|---|---|---|
| 1008 N River Oaks Ln Chandler, TX | 4.0 | 2.0 | 1706 | $2,295 | $1.35 | 15d | 1 | 0.06mi |
| 501 Kidd Dr Unit 2A Chandler, TX | 3.0 | 2.0 | 1500 | $2,000 | $1.33 | 15d | 1 | 0.53mi |
HOA detail
- Monthly dues
- $54 · $648/yr
Listing history 17 events
-
2026-05-18soldstatus Closed
-
2026-05-17status Pending
-
2026-04-17historical Active Option Contract
-
2026-03-10$202,000 Active
-
2025-11-11historical
-
2025-05-19price $246,000
-
2025-05-19price $246,000
-
2025-03-08$250,000 Active
-
2024-05-29soldstatus Closed
-
2024-04-16status Pending
-
2024-03-27price $236,990
-
2024-03-02price $234,990
-
2024-02-25price $231,990
-
2024-01-23price $236,990
-
2024-01-19price $241,990
-
2024-01-03$246,990 Active
-
2023-09-29$246,990 Active
ⓘ Source: listings_history table (triggers on properties + properties_extension) + one-shot
backfill from property_details.listing_events for pre-trigger history.
Tax reassessment forecast TX · Resets to sale price
- Current annual tax
- $3,471 · $289/mo
- Projected year-2 tax
- $3,697 · $308/mo
- Expected delta
- +$226/yr (+$19/mo · 6.5%)
ⓘ Screening estimate from a state-policy table — verify with the county assessor before closing.
Nearby sold comps map
Loading sold comps map…
Walkable amenities ~0.75 mi
Loading nearby amenities…
Taxation est. · year 1
- Rental income
- $26,914
- − Mortgage interest
- −$11,315
- − Property taxes
- −$3,471
- − Insurance
- −$1,010
- − Repairs & maintenance
- −$2,153
- − Management
- −$2,153
- − HOA
- −$648
- − Depreciation
- −$5,876
- Taxable income
- $287
- Est. tax owed @ 24.0%
- −$69
- After-tax cash flow
- $3,352/yr
For passive investors: Depreciation is non-cash, so a rental often shows a tax loss while cash-flowing — sheltering income. Rental losses are passive: they offset passive income freely, and up to $25,000/yr can offset ordinary (W-2) income if you actively participate and your MAGI is under $100k (phasing out to $0 by $150k); unused losses carry forward. On sale, claimed depreciation is recaptured at up to 25%, and gains may owe capital-gains tax (a 1031 exchange can defer both). Figures are a year-1 estimate at your 24.0% rate — not tax advice; consult a CPA.
Schools (NCES district)
- District
- Brownsboro ISD
- NCES district ID
- 4811640
- Math proficiency
- 42% ▼ -5.00%
- Reading proficiency
- 46% ▬ 0.00%
- Median HH income
- $45,624
- Composite
- 37.38/100
- National rank
- #4429
- State rank
- #290 of 826 in TX
Livability — Chandler
- Score
- 70/100
- State rank
- #347
- US rank
- #7634
Category grades
Schools grade is shown separately in the Schools card above.
Census & demographics
- Census place
- Chandler, TX
- Population (ZIP)
- 10,357
Population outlook (Henderson County) Hauer SSP2
- Today (2025)
- 80,471 people
- By 2030
- 80,608 · +0.2%
- By 2040
- 80,087 · -0.5%
- By 2050
- 78,208 · -2.8%
- By 2075
- 72,423 · -10.0%
- By 2100
- 61,012 · -24.2%
Race, ethnicity, and origin ACS 2023
- Neighborhood character
- Predominantly White (79%)
- Race & ethnicity
- White 79% Hispanic / Latino 16% Two or more races 9% Black 2%
- Hispanic origin (detail)
- Mexican 14%
- Common ancestry
- Slovak 3% Serbian 2% Romanian 1%
- Foreign-born
- 5% · Canada, Vietnam
- Languages at home
- 91% English-only · Spanish 8% Other Indo-European 1%
Political lean MEDSL · Henderson
- 2024 margin
- Solid R (+63.5) · D 18.0% · R 81.4%
- 2008→2024 swing
- -18.8pp toward R · 2008: -44.6pp · 2024: -63.5pp
- All cycles
- 2024: R+63.5 2020: R+60.2 2016: R+60.0 2012: R+54.8 2008: R+44.6
Not yet ingested
- Civics
- —
Market trends
- HPI YoY
- ▼ -73.16%
- Current HPI
- 192.0837
- Rent YoY
- —
- Metro
- —
- State GDP YoY
- ▲ 3.95%
- F500 in state
- 110
Industry mix (Fortune 500 HQ in TX)
| Industry | F500 HQs | Revenue |
|---|---|---|
| Energy | 16 | $1,198B |
|
||
| Technology | 5 | $198B |
|
||
| Engineering / Construction | 4 | $72B |
|
||
| Energy Services | 3 | $60B |
|
||
| Utilities | 3 | $41B |
|
||
| Healthcare | 2 | $330B |
|
||
Price history
-18.2% since first listed17 events — show timeline
- 2026-05-18 Sold (MLS) — NTREIS
- 2026-05-17 Pending — NTREIS
- 2026-04-17 Contingent — NTREIS
- 2026-03-10 Listed $202,000 NTREIS
- 2025-11-11 Listing Removed — NTREIS
- 2025-05-19 Price Changed $246,000 NTREIS
- 2025-05-19 Price Changed $246,000 GTAR
- 2025-03-08 Listed $250,000 NTREIS
- 2024-05-29 Sold (MLS) — NTREIS
- 2024-04-16 Pending — NTREIS
- 2024-03-27 Price Changed $236,990 NTREIS
- 2024-03-02 Price Changed $234,990 NTREIS
- 2024-02-25 Price Changed $231,990 NTREIS
- 2024-01-23 Price Changed $236,990 NTREIS
- 2024-01-19 Price Changed $241,990 NTREIS
- 2024-01-03 Listed $246,990 NTREIS
- 2023-09-29 Listed $246,990 GTAR
Cash-flow waterfall
monthlySold comps — $/sqft
last 12 mo · ≤1 miLoading sold comps…