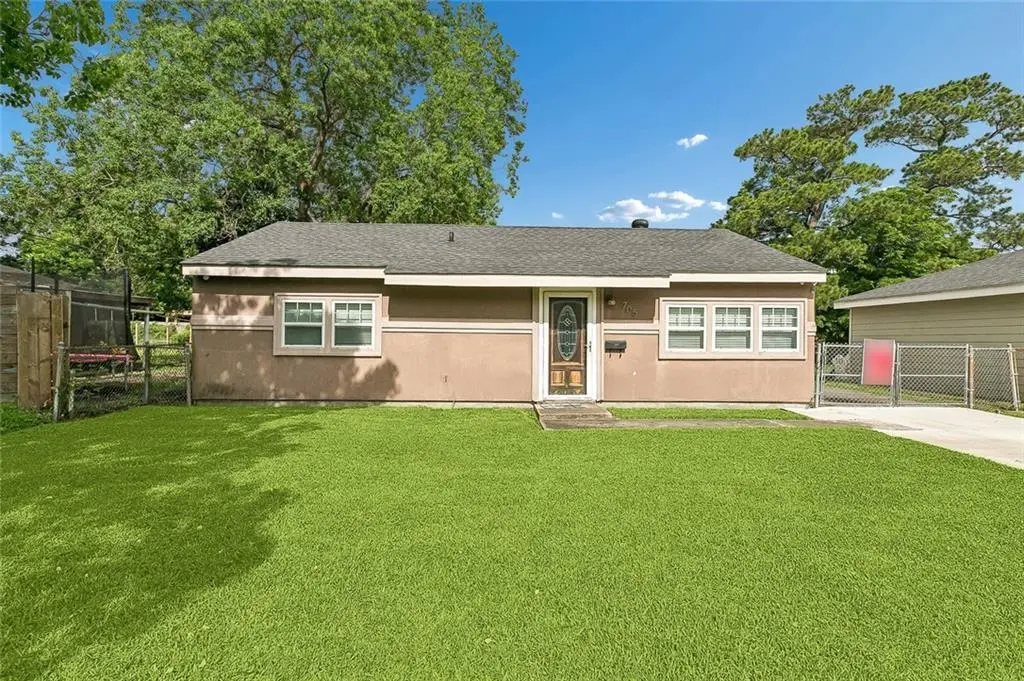
705 Huntlee Dr · New Orleans, LA
Flood risk 8/10 · Major
- FEMA flood zone
- X
- Chance of flooding over 30 yrs
- 0.6%
- Est. flood insurance / yr
- $507 – $1,088
Fire risk 1/10 · Minimal
- Est. fire insurance / yr
- $1,269 – $2,357
Heat risk 10/10 · Severe
- Hot days now (above 108°F)
- 7 days/yr
- Hot days in 30 yrs
- 21 days/yr
Wind risk 10/10 · Severe
- Chance of severe wind over 30 yrs
- 99.0%
Air-quality risk 2/10 · Minimal
- Unhealthy air days now
- 2 days/yr
- Unhealthy air days in 30 yrs
- 2 days/yr
Risk factors via First Street. Map © Google.
Why this score? — see what drove the D grade
The composite is a weighted blend of 9 inputs, each scored 0–100. Each bar is that input's sub-score; the figure is the points it added to the 100-point composite (weight × sub-score).
- Cash flow +18.5/30.0
- DSCR +5.8/10.0
- 1% rule +4.4/10.0
- Livability +4.0/5.0
- ARV discount +2.7/15.0
- Condition / age +2.5/5.0
- Rent growth +2.3/5.0
- Schools +1.6/10.0
- Appreciation +0.0/10.0
$142,000
🖨 Deal sheet (PDF) 📄 Offer letter ✓ Due diligence
Listing remarks MLS
Lovely 2 bedroom 1 bathroom home located in Algiers area. Newly renovated freshly painted and this one has a huge lot for the kiddos. Off street parking and a garage give you options.
Key facts
- Off street parking
- Garage
- Huge lot
Tags
Property features AI
Exterior
- Parking: Garage with two parking spaces
- Utilities: Public water; Public sewer
- Home design: Single-story; Stucco exterior; Shingle roof; Built on a slab foundation
- Construction: Stucco construction; Shingle roof; Slab foundation; Excellent condition
- Exterior features: City lot; Rectangular lot; Lot dimensions approximately 55 x 109
Interior
- Kitchen: Dishwasher; Range; Refrigerator
- Bedrooms: 4 total rooms
- Bathrooms: 1 full bathroom
- Heating & cooling: Central heating; Central air conditioning
- Interior features: Excellent condition
Neighborhood map
What this means for you Summary
Snapshot
- This is a 2-bed/1.0-bath single-family listed at $142k.
Deal economics
- At list price, monthly cash flow is $68 ($820/yr) — positive.
- The deal already cash-flows at list — no discount required.
- To meet the 1% rule (rent ≥ 1% of price), the offer needs to be $133k (6.3% below list).
- Recommended offer: $133k (6.3% below list) — sets the bar for 1% rule.
- Cap rate 7.4% vs local median 4.4% in New Orleans — top-decile yield for the area; either an underpriced asset or a hidden risk that comps aren't pricing in. Stress-test before assuming the spread holds.
Location & tenants
- Location reads 81/100 on livability (#3 in LA, #1,383 nationally) — a professional / high-income tenant draw. Strengths: amenities A+, commute A+, health & safety A+; Watch: crime C-, employment D.
- Orleans Parish (urban): math 11% / reading 27% proficiency, ranked #69 of 98 in LA (top 70%) — low school quality limits family demand, transient renter base, plan for 1-2y turnover; 68% free/reduced lunch — lower-income household profile, screen leases tightly.
- Zoned schools: Benjamin Franklin Elem. Math And Science (math 12% / reading 23%, grade F, #479 of 646 statewide, top 75%, 747 students, 98% FRL, charter) — zoned schools average 98% FRL vs 68% district-wide (30 pts higher); higher-poverty schools than district average — tighter screening recommended.
- Market conditions: Rents soft (-0.7%/yr); 265 active listings in the ZIP; 13 comparable units currently listed for rent nearby; rentals at typical pace (median 26d on market — plan ~3-4 weeks tenant-placement turnaround); lower-income renter base — watch delinquency; 710 units permitted in Orleans Parish in 2024 (244 in 5+ unit buildings).
- This rent runs 37% of the median local income ($43k/yr) — at the standard rent-burdened threshold; future hikes will face affordability resistance.
Forward outlook
- Local home prices are declining (-3.0%/yr); year-one equity from $982 of loan paydown is wiped out by about $4k of value loss. Plan a longer hold.
- Orleans County population projected at +61% by 2050 — long-run rental-demand tailwind backs the buy-and-hold thesis.
Negotiation context
- It's been on market 20 days — a 2% lower offer ($140k) is reasonable based on typical stale-listing flexibility.
- 11 sale attempts since 33y ago; this cycle's ask has dropped $8k (5%) from the opening price — seller is motivated, your offer sets the floor, not the list.
- Current owner paid $42k; list at $142k implies a 238% gain — meaningful room to come down on a strong offer.
Risks & watch-outs
- Watch-outs: flood insurance adds $66/mo.
- Climate carrying-cost: severe flood risk; severe wind risk, 99% chance of damaging wind over 30y; extreme-heat days projected 7→21/yr by 2055 (HVAC capex compounding) — expect insurance premiums to compound above CPI over the hold.
Questions for the listing agent
- What's the actual annual flood-insurance premium (NFIP or private), and is the property in a SFHA with mandatory coverage?
- Is there a deadline driving the sale (1031 exchange, divorce, estate, relocation)? That informs how much negotiation room exists.
- The area grade is low — what's the realistic commute time and amenity access for the typical tenant pool here? Any planned neighborhood developments (good or bad) we should know about?
- What's the average days-on-market for RENTAL listings here right now (not sales)? A rising rental-DOM trend means longer vacancies and softer asking-rent achievability than the comps imply.
- What's the recent tenant-quality profile in this submarket — average credit score on applications, eviction rate, late-payment / NSF rate, and stable-employment percentage? A property-management company in the area should have these aggregated.
- How much new for-sale + rental construction is in the pipeline within 1–3 miles? Heavy new supply typically softens prices + rents 12–24 months out; constrained supply supports both.
Investment metrics
- 1% rule
- 0.94% ✗
- Cap rate
- 7.43%
- Cash-on-cash
- 4.07%
- DSCR
- 1.18
- GRM
- 8.9
CMA / ARV
- ARV (on-the-fly)
- $128,271
- Comps found
- 6
Show comp detail 6 sales within ~0.75 mi
| Address | Dist | Beds/Ba | Sqft | Sold | Price | $/sf | Match |
|---|---|---|---|---|---|---|---|
| 610 Huntlee Dr | 0.13mi | 3/1.0 (+1) | 900 (+0%) | 4mo | $33,000 | $37 | 85 |
| 638 Huntlee Dr | 0.06mi | 3/1.0 (+1) | 874 (-3%) | 11mo | $125,000 | $143 | 79 |
| 4956 Copernicus St | 0.48mi | 2/1.0 | 900 (+0%) | 2mo | $133,500 | $148 | 75 |
| 14 Sullivan Pl | 0.41mi | 2/1.0 | 874 (-3%) | 22mo | $82,500 | $94 | 58 |
| 41 Sullivan Pl | 0.36mi | 3/1.0 (+1) | 841 (-6%) | 23mo | $71,200 | $85 | 49 |
| 27 Sullivan Pl | 0.38mi | 3/1.0 (+1) | 1,000 (+12%) | 18mo | $160,000 | $160 | 43 |
Match score weights: distance 35% · size 25% · config 20% · recency 20%. Top-matched comps best support the ARV.
Projected returns pro-forma
-3.0% appreciation · 0.0% rent growth · sell at horizon
- IRR
- -16.4%
- Equity multiple
- 0.43×
- Total profit
- $-22,533
- Equity at exit
- $21,173
- IRR
- -14.8%
- Equity multiple
- 0.27×
- Total profit
- $-28,994
- Equity at exit
- $12,278
Cash invested: $39,760 (down + closing). Projections, not guarantees.
Landlord ↔ Tenant lean methodology
- Overall (STATE)
- 90 Strongly Landlord-Friendly
- State Louisiana
- 90 Strongly Landlord-Friendly · R+12
- County
- — inherits STATE
- City
- — inherits STATE
ZIP-level market 70114
- Rents YoY
- -0.7%
- Active inventory
- 265
- Price-to-rent
- 8.9×
Monthly cashflow live
- Estimated rent
- $1,330 high interval (Pro) →
- Mortgage (P&I)
- −$745
- Tax from tax record
- −$112 /mo · $1,345/yr
- Insurance
- −$59
- Flood insurance flood zone
- −$66 /mo · $798/yr
- HOA
- −$0
- Vacancy / Maint / Mgmt
- −$279
- Net cashflow
- $68
Break-even live
Sensitivity live
| Price | -10% $149 | -5% $109 | +0% $68 | +5% $28 | +10% $-12 |
|---|---|---|---|---|---|
| Rent | -10% $-37 | -5% $16 | +0% $68 | +5% $121 | +10% $173 |
| Rate | -1.0pp $140 | -0.5pp $104 | base $68 | +0.5pp $32 | +1.0pp $-6 |
UW: 25.0% down · 7.5% · 30yr · 1.5% tax · 5.0% vac · 8.0% maint · 8.0% mgmt
Financing live
Cash to close
- Down payment
- $35,500
- Closing costs
- $4,260
- Reserves months
- —
- Total cash needed
- —
Loan-product check · same deal, 3 products live
Conventional
25% down · 7.5% · 30yr
- Down + closing
- —
- Monthly P&I
- —
- Monthly cashflow
- —
- DSCR
- —
- Eligible?
- —
Personal DTI + credit; lowest rate.
DSCR
20% down · 8.5% · 30yr
- Down + closing
- —
- Monthly P&I
- —
- Monthly cashflow
- —
- DSCR
- —
- Eligible?
- —
No personal income docs; deal must DSCR.
Hard money
10% down · 12.0% · 12mo
- Down + closing
- —
- Monthly P&I
- —
- Monthly cashflow
- —
- DSCR
- —
- Eligible?
- —
Short-term bridge; refi at stabilization.
Rent comps 13 comps
| Address | Beds | Baths | Sqft | Rent | $/sqft | DOM | Units | Dist |
|---|---|---|---|---|---|---|---|---|
| 601 Huntlee Dr New Orleans, LA | 3.0 | 1.0 | 874 | $1,450 | $1.66 | 25d | 1 | 0.17mi |
| 3252 Kabel Dr New Orleans, LA | 2.0 | 1.5 | 1080 | $1,300 | $1.20 | 22d | 1 | 0.22mi |
| 3320 Kabel Dr Unit C New Orleans, LA | 3.0 | 2.0 | 999 | $1,100 | $1.10 | 5d | 1 | 0.25mi |
| 3100 Rue Parc Fontaine New Orleans, LA | 1.0 | 1.0 | 579 | $900 | $1.55 | 25d | 1 | 0.25mi |
| 3307 Kabel Dr New Orleans, LA | 2.0 | 1.5 | 1000 | $1,250 | $1.25 | 5d | 1 | 0.27mi |
| 3362 Kabel Dr New Orleans, LA | 3.0 | 2.0 | 1000 | $1,250 | $1.25 | 25d | 1 | 0.27mi |
| 3315 Kabel Dr New Orleans, LA | 2.0 | 1.5 | 975 | $1,350 | $1.38 | 25d | 1 | 0.27mi |
| 3317 Kabel Dr New Orleans, LA | 2.0 | 1.5 | 975 | $1,350 | $1.38 | 25d | 1 | 0.27mi |
| 3100 Rue Parc Fontaine #2017 New Orleans, LA | 1.0 | 1.0 | 576 | $895 | $1.55 | 25d | 1 | 0.28mi |
| 5400 Lacour Monique St New Orleans, LA | 2.0 | 1.0 | 750 | $1,650 | $2.20 | 5d | 1 | 0.57mi |
| 735 Lees Ln Unit 2 New Orleans, LA | 2.0 | 1.0 | 1000 | $1,600 | $1.60 | 25d | 1 | 1.20mi |
| 4254 Maple Leaf Dr New Orleans, LA | 1.0–3.0 | 1.0–2.5 | 1354 | $1,496 | $1.10 | 3d | 8 | 1.25mi |
| 2002 Pace Blvd Unit 103 New Orleans, LA | 3.0 | 2.0 | 1000 | $1,500 | $1.50 | 16d | 1 | 1.48mi |
Listing history 15 events
-
2026-06-21days on market $142,000 Active 20 DOM
-
2026-06-18days on market $142,000 Active 17 DOM
-
2026-06-18price $142,000 Active 16 DOM
-
2026-06-17days on market $150,000 Active 16 DOM
-
2026-06-16days on market $150,000 Active 15 DOM
-
2026-06-15days on market $150,000 Active 14 DOM
-
2026-06-13days on market $150,000 Active 12 DOM
-
2026-06-10days on market $150,000 Active 9 DOM
-
2026-06-09days on market $150,000 Active 8 DOM
-
2026-06-08days on market $150,000 Active 7 DOM
-
2026-06-07days on market $150,000 Active 6 DOM
-
2026-06-05days on market $150,000 Active 3 DOM
-
2026-06-03days on market $150,000 Active 2 DOM
-
2026-06-02remarks 183-char remark
-
2026-06-02$150,000 Active 1 DOM
ⓘ Source: listings_history table (triggers on properties + properties_extension) + one-shot
backfill from property_details.listing_events for pre-trigger history.
Tax reassessment forecast LA · Resets to sale price
- Current annual tax
- $1,345 · $112/mo
- Projected year-2 tax
- $1,345 · $112/mo
- Expected delta
- $0/yr ($0/mo · 0.0%)
ⓘ Screening estimate from a state-policy table — verify with the county assessor before closing.
Climate risk First Street
- Flood 8/10 Severe FEMA zone X · 60% chance over 30 yrs
- Wildfire 1/10 Low
- Heat 10/10 Extreme 7 d/yr ≥108°F today · 21 d/yr by 30 yrs out
- Wind 10/10 Extreme 99% chance of damaging wind over 30 yrs
- Air quality 2/10 Low 2 unhealthy d/yr today · 2 by 30 yrs out
Nearby sold comps map
Loading sold comps map…
Walkable amenities ~0.75 mi
Loading nearby amenities…
Taxation est. · year 1
- Rental income
- $15,961
- − Mortgage interest
- −$7,954
- − Property taxes
- −$1,345
- − Insurance
- −$1,508
- − Repairs & maintenance
- −$1,277
- − Management
- −$1,277
- − Depreciation
- −$4,131
- Taxable loss
- −$1,531
- Est. tax savings @ 24.0%
- +$367
- After-tax cash flow
- $1,188/yr
For passive investors: Depreciation is non-cash, so a rental often shows a tax loss while cash-flowing — sheltering income. Rental losses are passive: they offset passive income freely, and up to $25,000/yr can offset ordinary (W-2) income if you actively participate and your MAGI is under $100k (phasing out to $0 by $150k); unused losses carry forward. On sale, claimed depreciation is recaptured at up to 25%, and gains may owe capital-gains tax (a 1031 exchange can defer both). Figures are a year-1 estimate at your 24.0% rate — not tax advice; consult a CPA.
Schools (NCES district)
- District
- Orleans Parish
- NCES district ID
- 2201170
- Math proficiency
- 11% ▼ -52.00%
- Reading proficiency
- 27% ▼ -46.00%
- Median HH income
- $37,011
- Composite
- 15.78/100
- National rank
- #9271
- State rank
- #69 of 98 in LA
Livability — New Orleans
- Score
- 81/100
- State rank
- #3
- US rank
- #1383
Category grades
Schools grade is shown separately in the Schools card above.
Census & demographics
- Census place
- New Orleans, LA
- County
- Orleans Parish · 338,817 people
- City population
- 338,817
- Metro
- New Orleans-Metairie, LA
- Population (ZIP)
- 22,659
- Household income
- $43,493
- Rent vs Own
- Severe rent burden
- 2240.0
Population outlook (Orleans County) Hauer SSP2
- Today (2025)
- 513,025 people
- By 2030
- 575,781 · +12.2%
- By 2040
- 700,174 · +36.5%
- By 2050
- 826,541 · +61.1%
- By 2075
- 1,123,374 · +119.0%
- By 2100
- 1,355,609 · +164.2%
Race, ethnicity, and origin ACS 2023
- Neighborhood character
- Predominantly Black (72%)
- Race & ethnicity
- Black 72% White 16% Hispanic / Latino 8% Two or more races 5%
- Hispanic origin (detail)
- Mexican 2% Puerto Rican 1%
- Common ancestry
- Lithuanian 3% Slovak 1% Italian 1%
- Foreign-born
- 5% · Canada
- Languages at home
- 91% English-only · Spanish 6% French/Haitian/Cajun 2% Other Indo-European 1%
Political lean MEDSL · Orleans
- 2024 margin
- Solid D (+67.0) · D 82.2% · R 15.2% · Other 2.7%
- 2008→2024 swing
- +6.7pp toward D · 2008: 60.3pp · 2024: 67.0pp
- All cycles
- 2024: D+67.0 2020: D+68.2 2016: D+66.2 2012: D+62.5 2008: D+60.3
Not yet ingested
- Civics
- —
Market trends
- HPI YoY
- ▼ -98.56%
- Current HPI
- 149.0172
- Rent YoY
- ▼ -0.72%
- Metro
- New Orleans-Metairie, LA
- State GDP YoY
- ▲ 3.29%
- F500 in state
- 10
Industry mix (Fortune 500 HQ in LA)
| Industry | F500 HQs | Revenue |
|---|---|---|
| Telecommunications | 2 | $23B |
|
||
| Utilities | 1 | $12B |
|
||
| Wholesale / Distribution | 1 | $5B |
|
||
| Advertising | 1 | $2B |
|
||
Price history
+275.9% since first listed19 events — show timeline
- 2026-06-01 Listed $150,000 GSREIN
- 2026-06-01 Listed $150,000 AcadianaMLS
- 2023-03-08 Price Changed $145,000 GSREIN
- 2023-02-27 Price Changed $147,000 GSREIN
- 2023-01-13 Price Changed $152,000 GSREIN
- 2023-01-02 Listed $145,000 AcadianaMLS
- 2013-02-06 Sold (MLS) $42,013 GSREIN
- 2012-10-18 Listed $51,800 AcadianaMLS
- 2012-10-18 Listed $51,800 GSREIN
- 2012-09-26 Sold (Public Records) $30,000 Public Records
- 2012-06-06 Listed $120,000 GSREIN
- 2012-06-06 Listed $120,000 AcadianaMLS
- 2009-08-27 Listed $125,000 GSREIN
- 2009-08-27 Listed $125,000 AcadianaMLS
- 2001-05-09 Sold (Public Records) $34,500 Public Records
- 1993-11-05 Sold (Public Records) $38,000 Public Records
- 1993-09-30 Sold (MLS) $38,000 GSREIN
- 1993-04-12 Listed $39,900 AcadianaMLS
- 1993-04-12 Listed $39,900 GSREIN
Property tax history
+1.1%/yrLatest (2026): $1,345 · +0.0% YoY. Source: county tax records.
Cash-flow waterfall
monthlySold comps — $/sqft
last 12 mo · ≤1 miLoading sold comps…