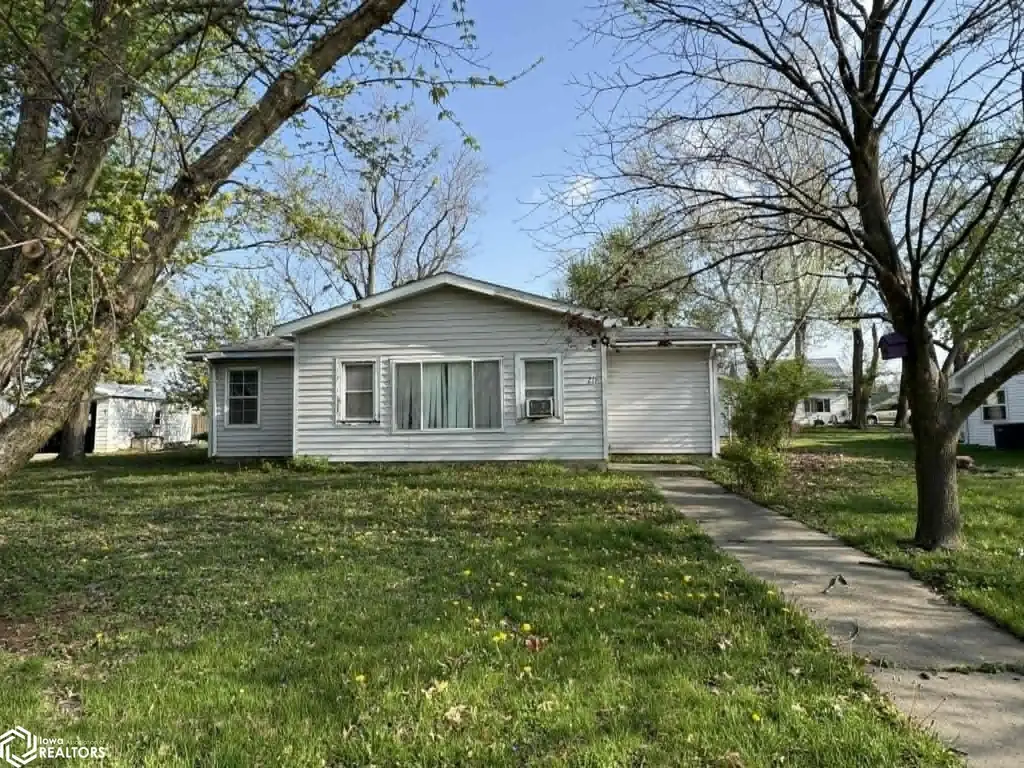
211 E Short St · Centerville, IA
Flood risk 1/10 · Minimal
- FEMA flood zone
- X (unshaded)
- Chance of flooding over 30 yrs
- 0.0%
- Est. flood insurance / yr
- $507 – $1,088
Fire risk 3/10 · Minor
- Est. fire insurance / yr
- $902 – $1,676
Heat risk 3/10 · Minor
- Hot days now (above 105°F)
- 7 days/yr
- Hot days in 30 yrs
- 14 days/yr
Wind risk 2/10 · Minimal
- Chance of severe wind over 30 yrs
- —
Air-quality risk 2/10 · Minimal
- Unhealthy air days now
- 1 days/yr
- Unhealthy air days in 30 yrs
- 3 days/yr
Risk factors via First Street. Map © Google.
Why this score? — see what drove the B+ grade
The composite is a weighted blend of 9 inputs, each scored 0–100. Each bar is that input's sub-score; the figure is the points it added to the 100-point composite (weight × sub-score).
- Cash flow +30.0/30.0
- DSCR +10.0/10.0
- 1% rule +9.5/10.0
- ARV discount +7.5/15.0
- Appreciation +5.5/10.0
- Schools +5.0/10.0
- Livability +3.7/5.0
- Rent growth +2.5/5.0
- Condition / age +2.5/5.0
$65,000
🖨 Deal sheet (PDF) 📄 Offer letter ✓ Due diligence
Listing remarks
This 3 bedroom, 2 bath home offers a great opportunity for investors or buyers looking to add their personal touch. Offering both enclosed front and back porch areas, there's plenty of space to relax and enjoy year round. The property also includes a 2 car detached garage, providing ample storage and parking. With a little love and TLC, this home could truly shine whether you're looking for a solid investment property or a place to make your own. Priced well and full of potential, this is an opportunity you won't want to miss.
Key facts
- 0.3 acre lot
- 2 garage spots
- Built 1990
Property features AI
Finance
- Financial info: Annual tax: $1,486
Exterior
- Parking: Detached 2-car garage
- Utilities: Public water; Public sewer
- Home design: Single-family residence; Residential property
- Construction: Vinyl siding
- Exterior features: Approximately 0.27-acre lot; Subdivision: FAIRLAWN
Interior
- Bathrooms: 2 full bathrooms
- Interior features: Central air conditioning; Forced air heating
Neighborhood map
What this means for you Summary
Snapshot
- This is a 3-bed/2.0-bath other listed at $65k.
Deal economics
- At list price, monthly cash flow is $254 ($3k/yr) — positive.
- The deal already cash-flows at list — no discount required.
- Meets the 1% rule at list price ($944 rent vs $65k).
- Recommended offer: $61k (6.0% below list) — sets the bar for market timing.
- Cap rate 11.0% vs local median 4.0% in Centerville — top-decile yield for the area; either an underpriced asset or a hidden risk that comps aren't pricing in. Stress-test before assuming the spread holds.
Location & tenants
- Location reads 73/100 on livability (#277 in IA) — a middle-class / working-renter tenant base. Strengths: cost of living A+, housing A+, health & safety A+; Watch: amenities F, commute F, employment F.
- Centerville Community School District (town): math 57% / reading 65% proficiency, ranked #251 of 289 in IA (top 87%) — acceptable for families but not a draw, mixed tenant base, ~2y average lease.
- Zoned schools: Lakeview Elementary (math 57% / reading 60%, grade B-, #432 of 616 statewide, top 71%, 575 students, 50% FRL); Howar Middle School (math 57% / reading 66%, grade B+, #179 of 246 statewide, top 73%, 299 students, 50% FRL); Centerville High School (math 58% / reading 71%, grade B-, #211 of 336 statewide, top 70%, 404 students, 44% FRL).
- Market conditions: 83 active listings in the ZIP; 6 units permitted in Appanoose County in 2024 (0 in 5+ unit buildings).
Forward outlook
- In year one you build about $1k of equity ($449 loan paydown + $702 appreciation (1.1% local appreciation)).
- Appanoose County population projected at -24% by 2050 — secular population decline; favor cash flow + early exit over multi-decade hold.
- At projected returns (1.1% appreciation + 3.0% rent growth), your $18k cash investment doubles in ~4 years — after that, you're playing with house money.
Negotiation context
- It's been on market 65 days — a 6% lower offer ($61k) is reasonable based on typical stale-listing flexibility.
- Current owner paid $50k; 30% above their basis — modest negotiation headroom, anchor on the comps not their cost.
Questions for the listing agent
- It's been on market 65 days. Have you received any prior offers? Is the seller open to a 6% concession, seller financing, or rate buy-down credit?
- Why hasn't it sold? Are there any deal-killer items the seller is aware of (foundation, flood, title, zoning, code violations)?
- Is there a deadline driving the sale (1031 exchange, divorce, estate, relocation)? That informs how much negotiation room exists.
- Schools are A-rated — typically a magnet for longer-tenancy family renters. What's the average tenant stay here, and is there a school-zone premium baked into asking?
- What's the average days-on-market for RENTAL listings here right now (not sales)? A rising rental-DOM trend means longer vacancies and softer asking-rent achievability than the comps imply.
- What's the recent tenant-quality profile in this submarket — average credit score on applications, eviction rate, late-payment / NSF rate, and stable-employment percentage? A property-management company in the area should have these aggregated.
- How much new for-sale + rental construction is in the pipeline within 1–3 miles? Heavy new supply typically softens prices + rents 12–24 months out; constrained supply supports both.
Investment metrics
- 1% rule
- 1.45% ✓
- Cap rate
- 10.98%
- Cash-on-cash
- 16.73%
- DSCR
- 1.74
- GRM
- 5.7
CMA / ARV
No comps found within radius.
Projected returns pro-forma
1.08% appreciation · 3.0% rent growth · sell at horizon
- IRR
- 18.9%
- Equity multiple
- 1.97×
- Total profit
- $17,669
- Equity at exit
- $22,461
- IRR
- 22.0%
- Equity multiple
- 3.69×
- Total profit
- $48,878
- Equity at exit
- $30,059
Cash invested: $18,200 (down + closing). Projections, not guarantees.
Landlord ↔ Tenant lean methodology
- Overall (STATE)
- 83 Strongly Landlord-Friendly
- State Iowa
- 83 Strongly Landlord-Friendly · R+6
- County
- — inherits STATE
- City
- — inherits STATE
ZIP-level market 52544
- Home prices YoY
- 0.5%
- Active inventory
- 83
- Price-to-rent
- 5.7×
Monthly cashflow live
- Estimated rent
- $944 medium interval (Pro) →
- Mortgage (P&I)
- −$341
- Tax from tax record
- −$124 /mo · $1,486/yr
- Insurance
- −$27
- HOA
- −$0
- Vacancy / Maint / Mgmt
- −$198
- Net cashflow
- $254
Break-even live
Sensitivity live
| Price | -10% $291 | -5% $272 | +0% $254 | +5% $235 | +10% $217 |
|---|---|---|---|---|---|
| Rent | -10% $179 | -5% $216 | +0% $254 | +5% $291 | +10% $328 |
| Rate | -1.0pp $286 | -0.5pp $270 | base $254 | +0.5pp $237 | +1.0pp $220 |
UW: 25.0% down · 7.5% · 30yr · 1.5% tax · 5.0% vac · 8.0% maint · 8.0% mgmt
Financing live
Cash to close
- Down payment
- $16,250
- Closing costs
- $1,950
- Reserves months
- —
- Total cash needed
- —
Loan-product check · same deal, 3 products live
Conventional
25% down · 7.5% · 30yr
- Down + closing
- —
- Monthly P&I
- —
- Monthly cashflow
- —
- DSCR
- —
- Eligible?
- —
Personal DTI + credit; lowest rate.
DSCR
20% down · 8.5% · 30yr
- Down + closing
- —
- Monthly P&I
- —
- Monthly cashflow
- —
- DSCR
- —
- Eligible?
- —
No personal income docs; deal must DSCR.
Hard money
10% down · 12.0% · 12mo
- Down + closing
- —
- Monthly P&I
- —
- Monthly cashflow
- —
- DSCR
- —
- Eligible?
- —
Short-term bridge; refi at stabilization.
Listing history 20 events
-
2026-06-21days on market $65,000 Active 65 DOM
-
2026-06-21days on market $65,000 Active 64 DOM
-
2026-06-18days on market $65,000 Active 62 DOM
-
2026-06-17days on market $65,000 Active 61 DOM
-
2026-06-16days on market $65,000 Active 60 DOM
-
2026-06-15days on market $65,000 Active 59 DOM
-
2026-06-13days on market $65,000 Active 57 DOM
-
2026-06-12days on market $65,000 Active 56 DOM
-
2026-06-09days on market $65,000 Active 53 DOM
-
2026-06-08days on market $65,000 Active 52 DOM
-
2026-06-07days on market $65,000 Active 51 DOM
-
2026-06-07days on market $65,000 Active 50 DOM
-
2026-06-04days on market $65,000 Active 47 DOM
-
2026-06-02days on market $65,000 Active 46 DOM
-
2026-06-01days on market $65,000 Active 45 DOM
-
2026-05-31days on market $65,000 Active 44 DOM
-
2026-05-31days on market $65,000 Active 43 DOM
-
2026-04-29historical Active Under Contract
-
2026-04-16$65,000 Active
-
2019-04-12soldstatus $50,000
ⓘ Source: listings_history table (triggers on properties + properties_extension) + one-shot
backfill from property_details.listing_events for pre-trigger history.
Tax reassessment forecast IA · Partial reset (capped growth)
- Current annual tax
- $1,486 · $124/mo
- Projected year-2 tax
- $1,486 · $124/mo
- Expected delta
- $0/yr ($0/mo · 0.0%)
ⓘ Screening estimate from a state-policy table — verify with the county assessor before closing.
Climate risk First Street
- Flood 1/10 Low FEMA zone X (unshaded) · 0% chance over 30 yrs
- Wildfire 3/10 Moderate
- Heat 3/10 Moderate 7 d/yr ≥105°F today · 14 d/yr by 30 yrs out
- Wind 2/10 Low
- Air quality 2/10 Low 1 unhealthy d/yr today · 3 by 30 yrs out
Nearby sold comps map
Loading sold comps map…
Walkable amenities ~0.75 mi
Loading nearby amenities…
Taxation est. · year 1
- Rental income
- $11,324
- − Mortgage interest
- −$3,641
- − Property taxes
- −$1,486
- − Insurance
- −$325
- − Repairs & maintenance
- −$906
- − Management
- −$906
- − Depreciation
- −$1,891
- Taxable income
- $2,169
- Est. tax owed @ 24.0%
- −$521
- After-tax cash flow
- $2,524/yr
For passive investors: Depreciation is non-cash, so a rental often shows a tax loss while cash-flowing — sheltering income. Rental losses are passive: they offset passive income freely, and up to $25,000/yr can offset ordinary (W-2) income if you actively participate and your MAGI is under $100k (phasing out to $0 by $150k); unused losses carry forward. On sale, claimed depreciation is recaptured at up to 25%, and gains may owe capital-gains tax (a 1031 exchange can defer both). Figures are a year-1 estimate at your 24.0% rate — not tax advice; consult a CPA.
Schools (NCES district)
- District
- Centerville Community School District
- NCES district ID
- 1906750
- Math proficiency
- 57% ▼ -8.00%
- Reading proficiency
- 65% ▼ -5.00%
- Median HH income
- $35,401
- Composite
- 50.48/100
- National rank
- #1854
- State rank
- #251 of 289 in IA
Livability — Centerville
- Score
- 73/100
- State rank
- #277
- US rank
- #5375
Category grades
Schools grade is shown separately in the Schools card above.
Census & demographics
- Census place
- Centerville, IA
- Population (ZIP)
- 8,110
Population outlook (Appanoose County) Hauer SSP2
- Today (2025)
- 11,726 people
- By 2030
- 11,194 · -4.5%
- By 2040
- 10,063 · -14.2%
- By 2050
- 8,976 · -23.5%
- By 2075
- 6,785 · -42.1%
- By 2100
- 4,819 · -58.9%
Race, ethnicity, and origin ACS 2023
- Neighborhood character
- Predominantly White (93%)
- Race & ethnicity
- White 93% Two or more races 4% Hispanic / Latino 2% Black 1%
- Common ancestry
- Italian 6% Lithuanian 3% Slovak 2%
- Foreign-born
- 1% · Canada
- Languages at home
- 94% English-only · German/W. Germanic 5%
Political lean MEDSL · Appanoose
- 2024 margin
- Solid R (+46.7) · D 26.1% · R 72.8% · Other 1.2%
- 2008→2024 swing
- -44.8pp toward R · 2008: -1.9pp · 2024: -46.7pp
- All cycles
- 2024: R+46.7 2020: R+40.2 2016: R+36.4 2012: R+3.5 2008: R+1.9
Not yet ingested
- Civics
- —
Market trends
- HPI YoY
- ▲ 1.08%
- Current HPI
- 212.65
- Rent YoY
- —
- Metro
- —
- State GDP YoY
- ▲ 2.48%
- F500 in state
- 4
Industry mix (Fortune 500 HQ in IA)
| Industry | F500 HQs | Revenue |
|---|---|---|
| Financial Services | 1 | $16B |
|
||
| Retail / Convenience | 1 | $15B |
|
||
Price history
+30.0% since first listed3 events — show timeline
- 2026-04-29 Contingent — IAR
- 2026-04-16 Listed $65,000 IAR
- 2019-04-12 Sold (Public Records) $50,000 Public Records
Property tax history
-1.0%/yrLatest (2025): $1,486 · +1.5% YoY. Source: county tax records.
Cash-flow waterfall
monthlySold comps — $/sqft
last 12 mo · ≤1 miLoading sold comps…