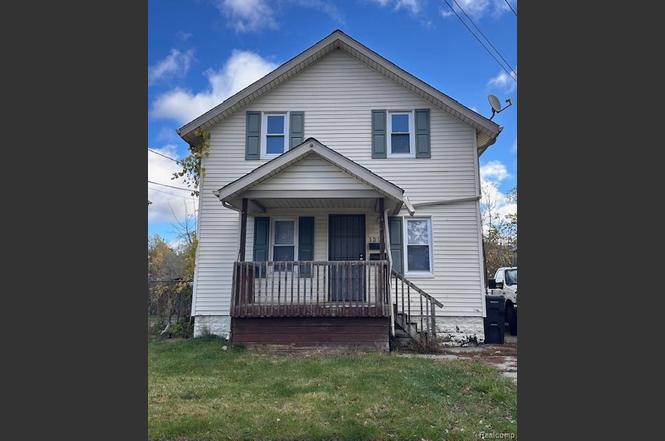
1511 Tacoma St · Flint, MI
Flood risk 4/10 · Minor
- FEMA flood zone
- X (unshaded)
- Chance of flooding over 30 yrs
- 0.2%
- Est. flood insurance / yr
- $507 – $1,088
Fire risk 1/10 · Minimal
- Est. fire insurance / yr
- $784 – $1,456
Heat risk 2/10 · Minimal
- Hot days now (above 97°F)
- 7 days/yr
- Hot days in 30 yrs
- 15 days/yr
Wind risk 2/10 · Minimal
- Chance of severe wind over 30 yrs
- —
Air-quality risk 3/10 · Minor
- Unhealthy air days now
- 3 days/yr
- Unhealthy air days in 30 yrs
- 4 days/yr
Risk factors via First Street. Map © Google.
Why this score? — see what drove the C+ grade
The composite is a weighted blend of 9 inputs, each scored 0–100. Each bar is that input's sub-score; the figure is the points it added to the 100-point composite (weight × sub-score).
- Cash flow +30.0/30.0
- 1% rule +10.0/10.0
- DSCR +10.0/10.0
- Rent growth +5.0/5.0
- Livability +3.7/5.0
- Condition / age +2.5/5.0
- Schools +1.1/10.0
- ARV discount +0.0/15.0
- Appreciation +0.0/10.0
$59,000
🖨 Deal sheet (PDF) 📄 Offer letter ✓ Due diligence
Listing remarks MLS
Excellent investment opportunity! 2 Unit Multi-Family Property! Ideal for investors or owner occupants, this versatile duplex offers great income potential. The property features two separate units: a 1-bedroom, 1 bath unit on the first floor and a 2-bedroom, 1-bath unit upstairs. The upper unit has been fully updated, offering modern finishes and move in ready appeal. The first floor unit will need some light updates such as new carpet in the bedroom and cleaning in the basement, allowing you to lease it right away. Currently, utilities are not separated but this should be an easy fix. Conveniently located near schools, parks and U of M, this property is a great opportunity to generate steady cash flow for a long term.
Key facts
- Near schools
- Two separate units
- Fully updated
Tags
Property features AI
Finance
- Other: Lot dimensions approximately 40 x 100; Above-grade finished area reported at 1,001 (unit breakdown: ~500 sq ft and ~500 sq ft)
- Financial info: Designed as residential income (multi-family)
Exterior
- Utilities: Public water; Public sewer
- Home design: Multi-family residential property; Two-story building; Zoned for multi-family
- Construction: Aluminum and vinyl siding; Block foundation
- Exterior features: Front porch; Paved road access
Interior
- Bedrooms: One 1-bedroom unit; One 2-bedroom unit
- Bathrooms: Two full bathrooms total (one in each unit)
- Heating & cooling: Forced air heating; Natural gas heating; No central cooling
- Interior features: Unfinished basement
Neighborhood map
What this means for you Summary
Snapshot
- This is a 3-bed/2.0-bath single-family listed at $59k.
Deal economics
- At list price, monthly cash flow is $275 ($3k/yr) — positive.
- The deal already cash-flows at list — no discount required.
- Meets the 1% rule at list price ($936 rent vs $59k).
- Recommended offer: $52k (12.0% below list) — sets the bar for market timing.
Location & tenants
- Location reads 74/100 on livability (#196 in MI, #4,946 nationally) — a middle-class / working-renter tenant base. Strengths: commute A+, cost of living A+, housing A+; Watch: schools F, crime F, employment F.
- Flint School District (urban): math 7% / reading 13% proficiency, ranked #714 of 760 in MI (top 94%) — low school quality limits family demand, transient renter base, plan for 1-2y turnover; 83% free/reduced lunch — lower-income household profile, screen leases tightly.
- Market conditions: Rents rising fast (+12.3%/yr); 135 active listings in the ZIP; 4 comparable units currently listed for rent nearby; rentals at typical pace (median 15d on market — plan ~3-4 weeks tenant-placement turnaround); lower-income renter base — watch delinquency; 419 units permitted in Genesee County in 2024 (68 in 5+ unit buildings).
Forward outlook
- Local home prices are declining (-3.0%/yr); year-one equity from $408 of loan paydown is wiped out by about $2k of value loss. Plan a longer hold.
- Genesee County population projected at -27% by 2050 — secular population decline; favor cash flow + early exit over multi-decade hold.
- At projected returns (-3.0% appreciation + 8.0% rent growth), your $17k cash investment doubles in ~5 years — after that, you're playing with house money.
Negotiation context
- It's been on market 237 days — a 12% lower offer ($52k) is reasonable based on typical stale-listing flexibility.
- 21 sale attempts since 22y ago with the ask held roughly flat each time — persistent listings suggest the price (not the market) is what's stuck; bring a comps-based counter.
- Current owner paid $46k; 28% above their basis — modest negotiation headroom, anchor on the comps not their cost.
Risks & watch-outs
- Watch-outs: property tax is 2.7% of price; built in 1929 — expect roof / HVAC / electrical / plumbing capex.
Questions for the listing agent
- It's been on market 237 days. Have you received any prior offers? Is the seller open to a 12% concession, seller financing, or rate buy-down credit?
- Built in 1929 — when were the roof, HVAC, electrical panel, plumbing, and water heater last replaced?
- Property tax is high relative to price — has the assessment been appealed recently, and will the sale trigger a re-assessment?
- Why hasn't it sold? Are there any deal-killer items the seller is aware of (foundation, flood, title, zoning, code violations)?
- Is there a deadline driving the sale (1031 exchange, divorce, estate, relocation)? That informs how much negotiation room exists.
- Schools are F-rated, which usually means shorter tenancies and higher turnover. Who's the typical renter profile here, and what's been the actual vacancy rate?
- Crime grade is F in this area — have there been break-ins, vandalism, or insurance claims at this property in the last 3 years? What carrier currently insures it and at what premium?
- What's the average days-on-market for RENTAL listings here right now (not sales)? A rising rental-DOM trend means longer vacancies and softer asking-rent achievability than the comps imply.
- What's the recent tenant-quality profile in this submarket — average credit score on applications, eviction rate, late-payment / NSF rate, and stable-employment percentage? A property-management company in the area should have these aggregated.
- How much new for-sale + rental construction is in the pipeline within 1–3 miles? Heavy new supply typically softens prices + rents 12–24 months out; constrained supply supports both.
Investment metrics
- 1% rule
- 1.59% ✓
- Cap rate
- 11.89%
- Cash-on-cash
- 19.98%
- DSCR
- 1.89
- GRM
- 5.3
CMA / ARV
- ARV (on-the-fly)
- $42,042
- Comps found
- 12
Show comp detail 12 sales within ~0.75 mi
| Address | Dist | Beds/Ba | Sqft | Sold | Price | $/sf | Match |
|---|---|---|---|---|---|---|---|
| 1517 Tacoma St | 0.02mi | 3/1.0 | 875 (-13%) | 1mo | $46,500 | $53 | 74 |
| 2041 Warner Ave | 0.66mi | 3/1.0 | 1,001 (0%) | 1mo | $24,000 | $24 | 64 |
| 2021 Brooks St | 0.51mi | 2/1.0 (-1) | 987 (-1%) | 3mo | $55,000 | $56 | 62 |
| 2314 S Grand Traverse St | 0.36mi | 2/1.5 (-1) | 922 (-8%) | 7mo | $30,000 | $33 | 57 |
| 913 Davis St | 0.68mi | 3/1.0 | 972 (-3%) | 3mo | $14,500 | $15 | 57 |
| 401 Monroe St | 0.42mi | 3/1.0 | 912 (-9%) | 13mo | $10,000 | $11 | 51 |
| 921 Cedar St | 0.59mi | 3/1.0 | 1,024 (+2%) | 17mo | $45,000 | $44 | 51 |
| 620 Simcoe Ave | 0.69mi | 4/1.5 (+1) | 1,000 (-0%) | 16mo | $42,000 | $42 | 47 |
| 609 Lippincott Blvd | 0.73mi | 3/1.0 | 1,080 (+8%) | 9mo | $40,000 | $37 | 41 |
| 2002 Ferris Ave | 0.70mi | 4/1.0 (+1) | 1,087 (+9%) | 8mo | $29,000 | $27 | 37 |
| 1608 Broad Ct | 0.68mi | 3/1.5 | 1,130 (+13%) | 18mo | $92,500 | $82 | 30 |
| 2054 Dwight Ave | 0.74mi | 3/1.0 | 864 (-14%) | 18mo | $40,000 | $46 | 23 |
Match score weights: distance 35% · size 25% · config 20% · recency 20%. Top-matched comps best support the ARV.
Projected returns pro-forma
-3.0% appreciation · 8.0% rent growth · sell at horizon
- IRR
- 18.1%
- Equity multiple
- 1.78×
- Total profit
- $12,956
- Equity at exit
- $8,797
- IRR
- 30.1%
- Equity multiple
- 4.42×
- Total profit
- $56,561
- Equity at exit
- $5,101
Cash invested: $16,520 (down + closing). Projections, not guarantees.
Landlord ↔ Tenant lean methodology
- Overall (STATE)
- 62 Landlord-Friendly
- State Michigan
- 62 Landlord-Friendly · EVEN
- County
- — inherits STATE
- City
- — inherits STATE
ZIP-level market 48503
- Home prices YoY
- -27.7%
- Rents YoY
- 12.3%
- Active inventory
- 135
- Price-to-rent
- 5.3×
Monthly cashflow live
- Estimated rent
- $936 medium interval (Pro) →
- Mortgage (P&I)
- −$309
- Tax from tax record
- −$131 /mo · $1,567/yr
- Insurance
- −$25
- HOA
- −$0
- Vacancy / Maint / Mgmt
- −$197
- Net cashflow
- $275
Break-even live
Sensitivity live
| Price | -10% $308 | -5% $292 | +0% $275 | +5% $258 | +10% $242 |
|---|---|---|---|---|---|
| Rent | -10% $201 | -5% $238 | +0% $275 | +5% $312 | +10% $349 |
| Rate | -1.0pp $305 | -0.5pp $290 | base $275 | +0.5pp $260 | +1.0pp $244 |
UW: 25.0% down · 7.5% · 30yr · 1.5% tax · 5.0% vac · 8.0% maint · 8.0% mgmt
Financing live
Cash to close
- Down payment
- $14,750
- Closing costs
- $1,770
- Reserves months
- —
- Total cash needed
- —
Loan-product check · same deal, 3 products live
Conventional
25% down · 7.5% · 30yr
- Down + closing
- —
- Monthly P&I
- —
- Monthly cashflow
- —
- DSCR
- —
- Eligible?
- —
Personal DTI + credit; lowest rate.
DSCR
20% down · 8.5% · 30yr
- Down + closing
- —
- Monthly P&I
- —
- Monthly cashflow
- —
- DSCR
- —
- Eligible?
- —
No personal income docs; deal must DSCR.
Hard money
10% down · 12.0% · 12mo
- Down + closing
- —
- Monthly P&I
- —
- Monthly cashflow
- —
- DSCR
- —
- Eligible?
- —
Short-term bridge; refi at stabilization.
Rent comps 4 comps
| Address | Beds | Baths | Sqft | Rent | $/sqft | DOM | Units | Dist |
|---|---|---|---|---|---|---|---|---|
| 410 Lippincott Blvd Flint, MI | 2.0 | 1.0 | 800 | $695 | $0.87 | 14d | 1 | 0.68mi |
| 912 Waldman Ave Flint, MI | 3.0 | 2.0 | 1223 | $675 | $0.55 | 14d | 1 | 1.08mi |
| 1426 Pettibone Ave Flint, MI | 2.0 | 1.0 | 750 | $900 | $1.20 | 22d | 1 | 1.22mi |
| 813 Alvord Ave Flint, MI | 2.0 | 1.0 | 724 | $850 | $1.17 | 14d | 1 | 1.34mi |
Listing history 50 events
-
2026-06-18days on market $59,000 Active 237 DOM
-
2026-06-17days on market $59,000 Active 236 DOM
-
2026-06-16days on market $59,000 Active 235 DOM
-
2026-06-15days on market $59,000 Active 234 DOM
-
2026-06-14days on market $59,000 Active 232 DOM
-
2026-06-13days on market $59,000 Active 231 DOM
-
2026-06-10days on market $59,000 Active 229 DOM
-
2026-06-09days on market $59,000 Active 228 DOM
-
2026-06-08days on market $59,000 Active 227 DOM
-
2026-06-07days on market $59,000 Active 226 DOM
-
2026-06-05days on market $59,000 Active 223 DOM
-
2026-06-03days on market $59,000 Active 222 DOM
-
2026-06-02days on market $59,000 Active 221 DOM
-
2026-06-01days on market $59,000 Active 220 DOM
-
2026-05-31days on market $59,000 Active 219 DOM
-
2026-05-30days on market $59,000 Active 218 DOM
-
2025-10-24$59,000 Active
Show marketing remark (729 chars)
Excellent investment opportunity! 2 Unit Multi-Family Property! Ideal for investors or owner occupants, this versatile duplex offers great income potential. The property features two separate units: a 1-bedroom, 1 bath unit on the first floor and a 2-bedroom, 1-bath unit upstairs. The upper unit has been fully updated, offering modern finishes and move in ready appeal. The first floor unit will need some light updates such as new carpet in the bedroom and cleaning in the basement, allowing you to lease it right away. Currently, utilities are not separated but this should be an easy fix. Conveniently located near schools, parks and U of M, this property is a great opportunity to generate steady cash flow for a long term.
-
2025-10-24$59,000 Active 729-char remark
Show marketing remark (729 chars)
Excellent investment opportunity! 2 Unit Multi-Family Property! Ideal for investors or owner occupants, this versatile duplex offers great income potential. The property features two separate units: a 1-bedroom, 1 bath unit on the first floor and a 2-bedroom, 1-bath unit upstairs. The upper unit has been fully updated, offering modern finishes and move in ready appeal. The first floor unit will need some light updates such as new carpet in the bedroom and cleaning in the basement, allowing you to lease it right away. Currently, utilities are not separated but this should be an easy fix. Conveniently located near schools, parks and U of M, this property is a great opportunity to generate steady cash flow for a long term.
-
2025-09-08historical
-
2025-09-08historical
-
2025-08-13$55,000 Active
-
2025-08-13$55,000 Active
-
2025-06-13historical $725
-
2025-05-01$725
-
2025-01-28soldstatus $46,000
-
2025-01-13soldstatus $46,000 Closed
-
2025-01-13soldstatus $46,000 Closed
-
2025-01-07status Pending
-
2025-01-07status Pending
-
2024-12-20price $54,900
-
2024-12-19price $54,900
-
2024-11-20$59,900 Active
-
2024-11-20$59,900 Active
-
2024-04-10historical $725
-
2024-03-22$725
-
2023-07-20historical
-
2023-04-04soldstatus $37,500 Sold
-
2023-04-04soldstatus $37,500 Sold
-
2023-04-04soldstatus $37,500 Closed
-
2023-04-04soldstatus $37,500 Closed
-
2023-03-23status Pending
-
2023-03-23status Pending
-
2023-03-23status Pending
-
2023-03-23status Pending
-
2023-03-20$39,900 Active
-
2023-03-20$39,900 Active
-
2023-03-20$39,900 Active
-
2023-03-20$39,900 Active
-
2021-05-13soldstatus $20,000 Sold
-
2021-05-13soldstatus $20,000 Closed
ⓘ Source: listings_history table (triggers on properties + properties_extension) + one-shot
backfill from property_details.listing_events for pre-trigger history.
Tax reassessment forecast MI · Partial reset (capped growth)
- Current annual tax
- $1,567 · $131/mo
- Projected year-2 tax
- $1,567 · $131/mo
- Expected delta
- $0/yr ($0/mo · 0.0%)
ⓘ Screening estimate from a state-policy table — verify with the county assessor before closing.
Climate risk First Street
- Flood 4/10 Moderate FEMA zone X (unshaded) · 20% chance over 30 yrs
- Wildfire 1/10 Low
- Heat 2/10 Low 7 d/yr ≥97°F today · 15 d/yr by 30 yrs out
- Wind 2/10 Low
- Air quality 3/10 Moderate 3 unhealthy d/yr today · 4 by 30 yrs out
Nearby sold comps map
Loading sold comps map…
Walkable amenities ~0.75 mi
Loading nearby amenities…
Taxation est. · year 1
- Rental income
- $11,235
- − Mortgage interest
- −$3,305
- − Property taxes
- −$1,567
- − Insurance
- −$295
- − Repairs & maintenance
- −$899
- − Management
- −$899
- − Depreciation
- −$1,716
- Taxable income
- $2,554
- Est. tax owed @ 24.0%
- −$613
- After-tax cash flow
- $2,688/yr
For passive investors: Depreciation is non-cash, so a rental often shows a tax loss while cash-flowing — sheltering income. Rental losses are passive: they offset passive income freely, and up to $25,000/yr can offset ordinary (W-2) income if you actively participate and your MAGI is under $100k (phasing out to $0 by $150k); unused losses carry forward. On sale, claimed depreciation is recaptured at up to 25%, and gains may owe capital-gains tax (a 1031 exchange can defer both). Figures are a year-1 estimate at your 24.0% rate — not tax advice; consult a CPA.
Schools (NCES district)
- District
- Flint School District
- NCES district ID
- 2614520
- Math proficiency
- 7% ▬ 0.00%
- Reading proficiency
- 13% ▲ 3.00%
- Median HH income
- $25,954
- Composite
- 10.97/100
- National rank
- #14642
- State rank
- #714 of 760 in MI
Livability — Flint
- Score
- 74/100
- State rank
- #196
- US rank
- #4946
Category grades
Schools grade is shown separately in the Schools card above.
Census & demographics
- Census place
- Flint, MI
- County
- Genesee County · 221,329 people
- City population
- 93,814
- Metro
- Flint, MI
- Population (ZIP)
- 22,347
- Household income
- $44,411
- Rent vs Own
- Severe rent burden
- 1293.0
Population outlook (Genesee County) Hauer SSP2
- Today (2025)
- 381,312 people
- By 2030
- 362,731 · -4.9%
- By 2040
- 321,550 · -15.7%
- By 2050
- 279,212 · -26.8%
- By 2075
- 193,336 · -49.3%
- By 2100
- 128,118 · -66.4%
Race, ethnicity, and origin ACS 2023
- Neighborhood character
- Diverse neighborhood (Simpson 0.56)
- Race & ethnicity
- Black 55% White 36% Two or more races 4% Hispanic / Latino 3%
- Common ancestry
- Romanian 2% Lithuanian 2% Slovak 1%
- Foreign-born
- 5% · China, Canada
- Languages at home
- 93% English-only · Arabic 4% Spanish 1% Chinese 1%
Political lean MEDSL · Genesee
- 2024 margin
- Toss-up / Even · D 51.4% · R 47.2% · Other 1.4%
- 2008→2024 swing
- -28.3pp toward R · 2008: 32.5pp · 2024: 4.2pp
- All cycles
- 2024: D+4.2 2020: D+9.3 2016: D+9.5 2012: D+28.2 2008: D+32.5
Not yet ingested
- Civics
- —
Market trends
- HPI YoY
- ▼ -49.84%
- Current HPI
- 130.1152
- Rent YoY
- ▲ 12.35%
- Metro
- Flint, MI
- State GDP YoY
- ▲ 1.37%
- F500 in state
- 28
Industry mix (Fortune 500 HQ in MI)
| Industry | F500 HQs | Revenue |
|---|---|---|
| Automotive Parts | 3 | $48B |
|
||
| Automotive | 2 | $372B |
|
||
| Chemicals | 1 | $45B |
|
||
| Automotive Retail | 1 | $29B |
|
||
| Healthcare / Medical Devices | 1 | $23B |
|
||
| Automotive Technology | 1 | $20B |
|
||
Price history
-15.6% since first listed56 events — show timeline
- 2025-10-24 Listed $59,000 MiRealSource-MiMLS
- 2025-10-24 Listed $59,000 REALCOMP
- 2025-09-08 Listing Removed — REALCOMP
- 2025-09-08 Listing Removed — MiRealSource-MiMLS
- 2025-08-13 Listed $55,000 REALCOMP
- 2025-08-13 Listed $55,000 MiRealSource-MiMLS
- 2025-06-13 Rental Removed $725 TENANTTURNER2
- 2025-05-01 Listed for Rent $725 TENANTTURNER2
- 2025-01-28 Sold (Public Records) $46,000 Public Records
- 2025-01-13 Sold (MLS) $46,000 REALCOMP
- 2025-01-13 Sold (MLS) $46,000 MiRealSource-MiMLS
- 2025-01-07 Pending — REALCOMP
- 2025-01-07 Pending — MiRealSource-MiMLS
- 2024-12-20 Price Changed $54,900 MiRealSource-MiMLS
- 2024-12-19 Price Changed $54,900 REALCOMP
- 2024-11-20 Listed $59,900 REALCOMP
- 2024-11-20 Listed $59,900 MiRealSource-MiMLS
- 2024-04-10 Rental Removed $725 APPFOLIO
- 2024-03-22 Listed for Rent $725 APPFOLIO
- 2023-07-20 Rental Removed — APPFOLIO
- 2023-04-04 Sold (MLS) $37,500 MiRealSource-MiMLS
- 2023-04-04 Sold (MLS) $37,500 MiRealSource-MiMLS
- 2023-04-04 Sold (MLS) $37,500 REALCOMP
- 2023-04-04 Sold (MLS) $37,500 REALCOMP
- 2023-03-23 Pending — REALCOMP
- 2023-03-23 Pending — REALCOMP
- 2023-03-23 Pending — MiRealSource-MiMLS
- 2023-03-23 Pending — MiRealSource-MiMLS
- 2023-03-20 Listed $39,900 MiRealSource-MiMLS
- 2023-03-20 Listed $39,900 MiRealSource-MiMLS
- 2023-03-20 Listed $39,900 REALCOMP
- 2023-03-20 Listed $39,900 REALCOMP
- 2021-05-13 Sold (MLS) $20,000 MiRealSource-MiMLS
- 2021-05-13 Sold (MLS) $20,000 REALCOMP
- 2021-05-09 Pending — MiRealSource-MiMLS
- 2021-05-09 Pending — REALCOMP
- 2021-04-20 Listed $29,900 MiRealSource-MiMLS
- 2021-04-20 Listed $29,900 REALCOMP
- 2021-04-18 Coming Soon $29,900 MiRealSource-MiMLS
- 2021-04-18 Coming Soon $29,900 REALCOMP
- 2018-12-24 Listing Removed — REALCOMP
- 2012-12-10 Listing Removed — MiRealSource-MiMLS
- 2011-01-27 Listing Removed — REALCOMP
- 2010-10-22 Listed $59,900 MiRealSource-MiMLS
- 2005-11-15 Sold (Public Records) $58,000 Public Records
- 2005-10-21 Sold (MLS) $58,000 REALCOMP
- 2005-10-21 Sold (MLS) $58,000 MiRealSource-MiMLS
- 2005-10-04 Listing Removed — MiRealSource-MiMLS
- 2005-02-07 Listed $61,500 REALCOMP
- 2005-02-07 Listed $61,500 MiRealSource-MiMLS
- 2005-02-07 Listed $61,500 REALCOMP
- 2005-02-07 Listed $61,500 MiRealSource-MiMLS
- 2005-02-07 Listing Removed — MiRealSource-MiMLS
- 2004-04-12 Listing Removed — MiRealSource-MiMLS
- 2004-04-12 Listed $69,900 MiRealSource-MiMLS
- 2004-04-12 Listed $69,900 REALCOMP
Property tax history
+7.4%/yrLatest (2025): $1,567 · -6.1% YoY. Source: county tax records.
Cash-flow waterfall
monthlySold comps — $/sqft
last 12 mo · ≤1 miLoading sold comps…