142 Garth Rd Unit 1R · Eastchester, NY
Flood risk 9/10 · Severe
- FEMA flood zone
- X (unshaded)
- Chance of flooding over 30 yrs
- 0.99%
- Est. flood insurance / yr
- $507 – $1,088
Fire risk 1/10 · Minimal
- Est. fire insurance / yr
- $691 – $1,283
Heat risk 6/10 · Moderate
- Hot days now (above 100°F)
- 7 days/yr
- Hot days in 30 yrs
- 15 days/yr
Wind risk 6/10 · Moderate
- Chance of severe wind over 30 yrs
- 27.0%
Air-quality risk 4/10 · Minor
- Unhealthy air days now
- 3 days/yr
- Unhealthy air days in 30 yrs
- 5 days/yr
Risk factors via First Street. Map © Google.
Why this score? — see what drove the B grade
The composite is a weighted blend of 9 inputs, each scored 0–100. Each bar is that input's sub-score; the figure is the points it added to the 100-point composite (weight × sub-score).
- Cash flow +30.0/30.0
- 1% rule +10.0/10.0
- DSCR +10.0/10.0
- ARV discount +7.5/15.0
- Schools +7.2/10.0
- Livability +3.9/5.0
- Condition / age +3.8/5.0
- Rent growth +2.5/5.0
- Appreciation +0.0/10.0
$265,000
🖨 Deal sheet (PDF) 📄 Offer letter ✓ Due diligence
Listing remarks
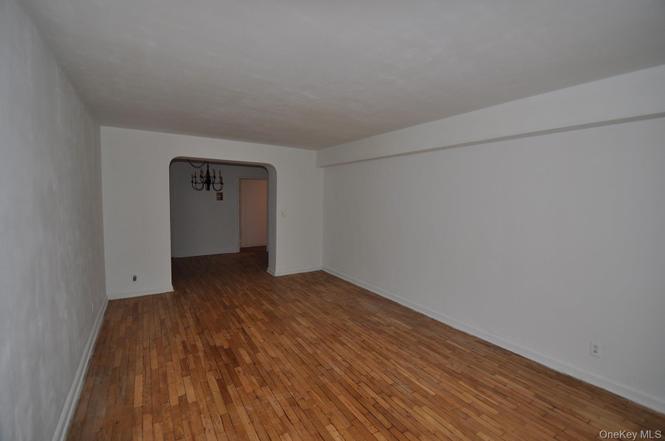
Opportunity Knocks. five minute walk to Scarsdale Train Station. Hardwood floors. Garth Road free parking with permit. Eligible for Lake Isle membership---18 hole golf, 8 tennis courts, 5 swimming courts, 50 meter Olympic Pool.
Key facts
- Garage
- Built 1950
- Listed 40 days
Neighborhood map
What this means for you Summary
Snapshot
- This is a 2-bed/1.0-bath condo listed at $265k. Condition is rated good.
Deal economics
- At list price, monthly cash flow is $1k ($17k/yr) — positive.
- The deal already cash-flows at list — no discount required.
- Meets the 1% rule at list price ($4k rent vs $265k).
- Recommended offer: $257k (3.0% below list) — sets the bar for market timing.
- Cap rate 13.2% vs local median 4.2% in Eastchester — top-decile yield for the area; either an underpriced asset or a hidden risk that comps aren't pricing in. Stress-test before assuming the spread holds.
Location & tenants
- Location reads 78/100 on livability (#159 in NY, #2,451 nationally) — a middle-class / working-renter tenant base. Strengths: crime A+, commute A+, employment A+; Watch: amenities D-, cost of living F, health & safety D-.
- Eastchester Union Free School District (suburban): math 79% / reading 80% proficiency, ranked #42 of 590 in NY (top 7%) — strong family-tenant draw, lease renewals of 3-5y typical; only 2% free/reduced lunch — higher-income household profile.
- Zoned schools: Greenvale School (math 88% / reading 88%, grade A+, #64 of 2,108 statewide, top 3%, 508 students, 0% FRL); Eastchester Middle School (math 56% / reading 76%, grade A-, #118 of 729 statewide, top 16%, 694 students, 0% FRL); Eastchester Senior High School (math 100% / reading 84%, grade A+, #171 of 1,100 statewide, top 18%, 976 students, 0% FRL) — zoned schools at 0% FRL track the district average.
- Market conditions: 293 active listings in the ZIP; 9 comparable units currently listed for rent nearby; rentals at typical pace (median 18d on market — plan ~3-4 weeks tenant-placement turnaround); high-income renter base; 954 units permitted in Westchester County in 2024 (649 in 5+ unit buildings).
Forward outlook
- Local home prices are declining (-3.0%/yr); year-one equity from $2k of loan paydown is wiped out by about $8k of value loss. Plan a longer hold.
- Westchester County population projected at +10% by 2050 — modest demand growth; plan on rents tracking national, not racing it.
- At projected returns (-3.0% appreciation + 3.0% rent growth), your $74k cash investment doubles in ~6 years — after that, you're playing with house money.
Negotiation context
- It's been on market 41 days — a 3% lower offer ($257k) is reasonable based on typical stale-listing flexibility.
- 2 sale attempts with the ask held roughly flat each time — persistent listings suggest the price (not the market) is what's stuck; bring a comps-based counter.
Risks & watch-outs
- Watch-outs: flood insurance adds $66/mo; built in 1950 — expect roof / HVAC / electrical / plumbing capex.
- Climate carrying-cost: severe flood risk; major wind risk, 27% chance of damaging wind over 30y; extreme-heat days projected 7→15/yr by 2055 (HVAC capex compounding) — expect insurance premiums to compound above CPI over the hold.
Questions for the listing agent
- It's been on market 41 days. Have you received any prior offers? Is the seller open to a 3% concession, seller financing, or rate buy-down credit?
- Built in 1950 — when were the roof, HVAC, electrical panel, plumbing, and water heater last replaced?
- What's the actual annual flood-insurance premium (NFIP or private), and is the property in a SFHA with mandatory coverage?
- Any open or pending special assessments — roof, HVAC, plumbing, elevator, façade? What's the per-unit balance and payoff schedule, and is the seller paying it off at close or rolling it to the buyer?
- Is there a deadline driving the sale (1031 exchange, divorce, estate, relocation)? That informs how much negotiation room exists.
- Schools are A-rated — typically a magnet for longer-tenancy family renters. What's the average tenant stay here, and is there a school-zone premium baked into asking?
- What's the average days-on-market for RENTAL listings here right now (not sales)? A rising rental-DOM trend means longer vacancies and softer asking-rent achievability than the comps imply.
- What's the recent tenant-quality profile in this submarket — average credit score on applications, eviction rate, late-payment / NSF rate, and stable-employment percentage? A property-management company in the area should have these aggregated.
- How much new apartment / multifamily construction is in the pipeline within 1–3 miles? Heavy new supply (>2% of stock underway) typically softens rents 12–24 months out; light construction supports rent growth.
Investment metrics
- 1% rule
- 1.60% ✓
- Cap rate
- 13.20%
- Cash-on-cash
- 24.65%
- DSCR
- 2.10
- GRM
- 5.2
CMA / ARV
No comps found within radius.
Projected returns pro-forma
-3.0% appreciation · 3.0% rent growth · sell at horizon
- IRR
- 16.7%
- Equity multiple
- 1.67×
- Total profit
- $50,020
- Equity at exit
- $39,512
- IRR
- 25.3%
- Equity multiple
- 3.20×
- Total profit
- $163,549
- Equity at exit
- $22,912
Cash invested: $74,200 (down + closing). Projections, not guarantees.
Landlord ↔ Tenant lean methodology
- Overall (STATE)
- 15 Strongly Tenant-Friendly
- State New York
- 15 Strongly Tenant-Friendly · D+10
- County
- — inherits STATE
- City
- — inherits STATE
ZIP-level market 10583
- Active inventory
- 293
- Price-to-rent
- 5.2×
Monthly cashflow live
- Estimated rent
- $4,248 high interval (Pro) →
- Mortgage (P&I)
- −$1,390
- Tax est. 1.5%
- −$331 /mo · $3,975/yr
- Insurance
- −$110
- Flood insurance flood zone
- −$66 /mo · $798/yr
- HOA
- −$0
- Vacancy / Maint / Mgmt
- −$892
- Net cashflow
- $1,458
Break-even live
Sensitivity live
| Price | -10% $1,641 | -5% $1,549 | +0% $1,458 | +5% $1,366 | +10% $1,275 |
|---|---|---|---|---|---|
| Rent | -10% $1,122 | -5% $1,290 | +0% $1,458 | +5% $1,626 | +10% $1,793 |
| Rate | -1.0pp $1,591 | -0.5pp $1,525 | base $1,458 | +0.5pp $1,389 | +1.0pp $1,319 |
UW: 25.0% down · 7.5% · 30yr · 1.5% tax · 5.0% vac · 8.0% maint · 8.0% mgmt
Financing live
Cash to close
- Down payment
- $66,250
- Closing costs
- $7,950
- Reserves months
- —
- Total cash needed
- —
Loan-product check · same deal, 3 products live
Conventional
25% down · 7.5% · 30yr
- Down + closing
- —
- Monthly P&I
- —
- Monthly cashflow
- —
- DSCR
- —
- Eligible?
- —
Personal DTI + credit; lowest rate.
DSCR
20% down · 8.5% · 30yr
- Down + closing
- —
- Monthly P&I
- —
- Monthly cashflow
- —
- DSCR
- —
- Eligible?
- —
No personal income docs; deal must DSCR.
Hard money
10% down · 12.0% · 12mo
- Down + closing
- —
- Monthly P&I
- —
- Monthly cashflow
- —
- DSCR
- —
- Eligible?
- —
Short-term bridge; refi at stabilization.
Rent comps 9 comps
| Address | Beds | Baths | Sqft | Rent | $/sqft | DOM | Units | Dist |
|---|---|---|---|---|---|---|---|---|
| 10 Wright Pl Unit C4 Scarsdale, NY | 1.0 | 1.0 | 700 | $2,499 | $3.57 | 25d | 1 | 0.08mi |
| 10 Wright Pl Unit A5 Scarsdale, NY | 1.0 | 1.0 | 700 | $2,550 | $3.64 | 18d | 1 | 0.08mi |
| 36 Grand Blvd Unit 2 Scarsdale, NY | 3.0 | 2.0 | 1500 | $6,100 | $4.07 | 44d | 1 | 0.17mi |
| 26 East Pkwy Unit 14A Scarsdale, NY | 1.0 | 1.0 | 810 | $3,500 | $4.32 | 44d | 1 | 0.32mi |
| 45 Popham Rd Unit 5L Scarsdale, NY | 2.0 | 2.0 | 1041 | $5,100 | $4.90 | 8d | 1 | 0.33mi |
| 69 Harney Rd Unit 6B Scarsdale, NY | 1.0 | 1.0 | 725 | $2,850 | $3.93 | 44d | 1 | 0.34mi |
| 837 White Plains Rd Unit 3R Scarsdale, NY | 2.0 | 1.0 | 950 | $2,500 | $2.63 | 8d | 1 | 0.68mi |
| 155 White Rd Scarsdale, NY | 3.0 | 1.5 | 1232 | $6,900 | $5.60 | 0d | 1 | 1.02mi |
| 500 Central Park Ave Scarsdale, NY | 2.0 | 1.5–2.0 | 1231 | $4,425 | $3.59 | 13d | 1 | 1.37mi |
HOA detail condo
- Monthly dues
- $0 · $0/yr
- Likely covers
- pool
- Assessments
- None detected in remarks — confirm with the listing agent.
Listing history 9 events
-
2026-06-21days on market $265,000 Active 41 DOM
-
2026-06-18days on market $265,000 Active 38 DOM
-
2026-06-17days on market $265,000 Active 37 DOM
-
2026-06-16days on market $265,000 Active 36 DOM
-
2026-06-15statusdays on market $265,000 Active 35 DOM
-
2026-04-08status Pending
-
2026-04-05historical
-
2026-03-07$265,000 Active
-
2026-03-07$265,000 Active
ⓘ Source: listings_history table (triggers on properties + properties_extension) + one-shot
backfill from property_details.listing_events for pre-trigger history.
Climate risk First Street
- Flood 9/10 Extreme FEMA zone X (unshaded) · 99% chance over 30 yrs
- Wildfire 1/10 Low
- Heat 6/10 Major 7 d/yr ≥100°F today · 15 d/yr by 30 yrs out
- Wind 6/10 Major 27% chance of damaging wind over 30 yrs
- Air quality 4/10 Moderate 3 unhealthy d/yr today · 5 by 30 yrs out
Nearby sold comps map
Loading sold comps map…
Walkable amenities ~0.75 mi
Loading nearby amenities…
Taxation est. · year 1
- Rental income
- $50,973
- − Mortgage interest
- −$14,844
- − Property taxes
- −$3,975
- − Insurance
- −$2,122
- − Repairs & maintenance
- −$4,078
- − Management
- −$4,078
- − Depreciation
- −$7,709
- Taxable income
- $14,167
- Est. tax owed @ 24.0%
- −$3,400
- After-tax cash flow
- $14,095/yr
For passive investors: Depreciation is non-cash, so a rental often shows a tax loss while cash-flowing — sheltering income. Rental losses are passive: they offset passive income freely, and up to $25,000/yr can offset ordinary (W-2) income if you actively participate and your MAGI is under $100k (phasing out to $0 by $150k); unused losses carry forward. On sale, claimed depreciation is recaptured at up to 25%, and gains may owe capital-gains tax (a 1031 exchange can defer both). Figures are a year-1 estimate at your 24.0% rate — not tax advice; consult a CPA.
Condition & rehab AI · 13 photos
This property is in good condition with minor repairs needed. It offers a good investment opportunity with potential for value increase through cosmetic updates.
Repairs flagged
- Minor Ceiling — Ceiling has minor discoloration
Value-add opportunities
- Both Paint interior walls — Fresh paint can enhance the home's curb appeal and interior aesthetics.
- Both Replace ceiling — Minor discoloration on the ceiling may affect the home's value and should be addressed.
- Both Clean and maintain hardwood floors — Clean and polished hardwood floors can significantly increase the home's value and appeal.
- Both Inspect and clean windows — Clean windows can improve natural light and the home's overall appearance.
- Both Check HVAC system for functionality — A functional HVAC system is essential for comfort and can impact the home's value and appeal.
- Both Landscaping and curb appeal — A well-maintained landscape and curb appeal can enhance the home's value and attract potential buyers/tenants.
Renovation cost estimate screening
| Repair item | Severity | Est. cost |
|---|---|---|
| Ceiling · Ceiling has minor discoloration | Minor | $500–3,000 |
| Total estimated repair cost · 1 items | $500–3,000 |
Value-add ROI direction
- Both Paint interior walls — Fresh paint can enhance the home's curb appeal and interior aesthetics. ↑
- Both Replace ceiling — Minor discoloration on the ceiling may affect the home's value and should be addressed. ↑
- Both Clean and maintain hardwood floors — Clean and polished hardwood floors can significantly increase the home's value and appeal. ↑
- Both Inspect and clean windows — Clean windows can improve natural light and the home's overall appearance. ↑
- Both Check HVAC system for functionality — A functional HVAC system is essential for comfort and can impact the home's value and appeal. ↑
- Both Landscaping and curb appeal — A well-maintained landscape and curb appeal can enhance the home's value and attract potential buyers/tenants. ↑
ⓘ Cost ranges are severity-bucket heuristics (US national rule-of-thumb). Get contractor quotes + a written scope before underwriting a rehab budget.
Schools (NCES district)
- District
- Eastchester Union Free School District
- NCES district ID
- 3610080
- Math proficiency
- 79% ▲ 1.00%
- Reading proficiency
- 80% ▲ 9.00%
- Median HH income
- $96,944
- Composite
- 71.74/100
- National rank
- #216
- State rank
- #42 of 590 in NY
Livability — Eastchester
- Score
- 78/100
- State rank
- #159
- US rank
- #2451
Category grades
Schools grade is shown separately in the Schools card above.
Census & demographics
- Census place
- Eastchester, NY
- County
- Westchester County · 709,332 people
- City population
- 10,274
- Metro
- New York-Newark-Jersey City, NY-NJ-PA
- Population (ZIP)
- 40,207
- Household income
- $250,001
- Rent vs Own
- Severe rent burden
- 560.0
Population outlook (Westchester County) Hauer SSP2
- Today (2025)
- 1,028,035 people
- By 2030
- 1,051,636 · +2.3%
- By 2040
- 1,098,520 · +6.9%
- By 2050
- 1,136,044 · +10.5%
- By 2075
- 1,196,925 · +16.4%
- By 2100
- 1,175,147 · +14.3%
Race, ethnicity, and origin ACS 2023
- Neighborhood character
- Diverse neighborhood (Simpson 0.55)
- Race & ethnicity
- White 63% Asian 20% Hispanic / Latino 8% Two or more races 7% Black 3%
- Hispanic origin (detail)
- Puerto Rican 2% Dominican 2%
- Common ancestry
- Scotch-Irish 6% Romanian 5% Italian 3%
- Foreign-born
- 25% · Canada, China, South Korea
- Languages at home
- 72% English-only · Other Indo-European 8% Chinese 6% Spanish 5%
Political lean MEDSL · Westchester
- 2024 margin
- Strong D (+26.3) · D 63.1% · R 36.9%
- 2008→2024 swing
- -1.3pp toward R · 2008: 27.6pp · 2024: 26.3pp
- All cycles
- 2024: D+26.3 2020: D+36.3 2016: D+32.8 2012: D+22.2 2008: D+27.6
Not yet ingested
- Civics
- —
Market trends
- HPI YoY
- ▼ -851.83%
- Current HPI
- 283.4725
- Rent YoY
- —
- Metro
- New York-Newark-Jersey City, NY-NJ-PA
- State GDP YoY
- ▲ 2.60%
- F500 in state
- 92
Industry mix (Fortune 500 HQ in NY)
| Industry | F500 HQs | Revenue |
|---|---|---|
| Financial Services | 10 | $950B |
|
||
| Consumer Goods | 9 | $162B |
|
||
| Insurance | 4 | $225B |
|
||
| Telecommunications | 2 | $144B |
|
||
| Pharmaceuticals | 2 | $112B |
|
||
| Media / Entertainment | 2 | $69B |
|
||
Price history
+0.0% since first listed4 events — show timeline
- 2026-04-08 Pending — OneKey® MLS as Distributed by MLS Grid
- 2026-04-05 Listing Removed — OneKey® MLS as Distributed by MLS Grid
- 2026-03-07 Listed $265,000 OneKey® MLS as Distributed by MLS Grid
- 2026-03-07 Listed $265,000 OneKey® MLS as Distributed by MLS Grid
Cash-flow waterfall
monthlySold comps — $/sqft
last 12 mo · ≤1 miLoading sold comps…