 Duplex
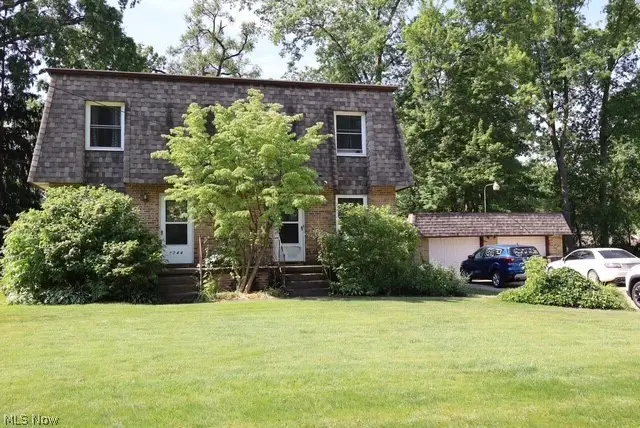
7744 Brookwood Dr NE · Howland Center, OH
Flood risk 1/10 · Minimal
- FEMA flood zone
- X (unshaded)
- Chance of flooding over 30 yrs
- 0.0%
- Est. flood insurance / yr
- $473 – $860
Fire risk 1/10 · Minimal
- Est. fire insurance / yr
- $713 – $1,323
Heat risk 3/10 · Minor
- Hot days now (above 96°F)
- 7 days/yr
- Hot days in 30 yrs
- 17 days/yr
Wind risk 1/10 · Minimal
- Chance of severe wind over 30 yrs
- —
Air-quality risk 3/10 · Minor
- Unhealthy air days now
- 1 days/yr
- Unhealthy air days in 30 yrs
- 4 days/yr
Risk factors via First Street. Map © Google.
Why this score? — see what drove the C grade
The composite is a weighted blend of 9 inputs, each scored 0–100. Each bar is that input's sub-score; the figure is the points it added to the 100-point composite (weight × sub-score).
- Cash flow +20.2/30.0
- ARV discount +11.7/15.0
- DSCR +6.4/10.0
- 1% rule +5.3/10.0
- Schools +5.3/10.0
- Livability +3.8/5.0
- Condition / age +3.8/5.0
- Rent growth +2.5/5.0
- Appreciation +0.0/10.0
$239,900
🖨 Deal sheet (PDF) 📄 Offer letter ✓ Due diligence
Multi-family units
County records classify this as Multi-Family (2-4 Unit). Listing-text estimate: 2 units. confirmed
Listing remarks
A fantastic opportunity to own a turnkey duplex in the sought after area of Howland with endless potential! Don’t miss this well maintained duplex offering two spacious 2-bedroom units. Each unit offers a comfortable living area, separate dining room and functional kitchen providing plenty of space. Additional highlights include a full basement for extra storage, a garage and beautiful yard for enjoying the outdoors. Updates include: new roof - 2019, all new vinyl windows - 2017, (7742 unit) new furnace - 2024, new central A/C - 2021, both units: hot water tanks approx. 8 years. Call now for your private showing!
Key facts
- New furnace
- Turnkey duplex
- New vinyl windows
Tags
Property features AI
Finance
- Other: Property has two buildings; Above-grade finished area per assessor: 2,448
- Financial info: Tenant pays all utilities and cable TV
Exterior
- Parking: Detached 2-car garage; Driveway
- Utilities: Public water; Public sewer
- Home design: Two-story building; Asphalt/fiberglass roof
- Construction: Built (year per public records); Brick exterior; Asphalt/fiberglass roof; Full basement foundation
- Exterior features: Brick construction; Lot approximately 0.29 acres
Interior
- Kitchen: Dishwasher; Range; Refrigerator
- Bedrooms: Total of 12 rooms (bedrooms and other rooms included)
- Bathrooms: Two full bathrooms
- Heating & cooling: Forced air heating; Central air conditioning
- Interior features: Full basement
- Laundry & utility: Laundry area in basement
Neighborhood map
What this means for you Summary
Snapshot
- This is a 2 × 2-bed/1.0-bath units multifamily listed at $240k. Condition is rated good.
Deal economics
- At list price, monthly cash flow is $302 ($4k/yr) — positive. Per door: $151/mo.
- The deal already cash-flows at list — no discount required.
- Meets the 1% rule at list price ($2k rent vs $240k).
- Recommended offer: $236k (1.5% below list) — sets the bar for market timing.
- Cap rate 7.8% vs local median 3.9% in Howland Center — top-decile yield for the area; either an underpriced asset or a hidden risk that comps aren't pricing in. Stress-test before assuming the spread holds.
Location & tenants
- Location reads 76/100 on livability (#207 in OH, #3,283 nationally) — a middle-class / working-renter tenant base. Strengths: cost of living A+, housing A+, health & safety A+; Watch: amenities F, commute F.
- Howland Local (suburban): math 59% / reading 65% proficiency, ranked #260 of 656 in OH (top 40%) — acceptable for families but not a draw, mixed tenant base, ~2y average lease.
- Zoned schools: Mines Elementary School (math 67% / reading 58%, grade B, #580 of 1,584 statewide, top 37%, 330 students, 41% FRL); Howland Middle School (math 56% / reading 66%, grade B+, #252 of 654 statewide, top 39%, 766 students, 38% FRL); Howland High School (math 58% / reading 74%, grade B, #155 of 781 statewide, top 20%, 742 students, 38% FRL).
- Market conditions: 90 active listings in the ZIP; 5 comparable units currently listed for rent nearby; rentals at typical pace (median 15d on market — plan ~3-4 weeks tenant-placement turnaround); 40% of comp listings sitting > 30 days — soft ceiling on asking rent; 129 units permitted in Trumbull County in 2024 (0 in 5+ unit buildings).
- At $2,481/mo this rent would consume 45% of the median local household income ($65k/yr) — very limited rent-growth headroom before tenants either downsize or default.
Forward outlook
- Local home prices are declining (-3.0%/yr); year-one equity from $2k of loan paydown is wiped out by about $7k of value loss. Plan a longer hold.
- Trumbull County population projected at -22% by 2050 — secular population decline; favor cash flow + early exit over multi-decade hold.
Negotiation context
- It's been on market 15 days — a 2% lower offer ($236k) is reasonable based on typical stale-listing flexibility.
Questions for the listing agent
- Can we see the unit-by-unit rent roll, current vacancy, and any below-market leases? What's the average tenancy length?
- What capital expenditures (roof, boiler, parking lot, exteriors) have been made in the last 5 years, and what's planned in the next 2?
- Built in 1977 — when were the roof, HVAC, electrical panel, plumbing, and water heater last replaced?
- Is there a deadline driving the sale (1031 exchange, divorce, estate, relocation)? That informs how much negotiation room exists.
- Schools are B-rated — typically a magnet for longer-tenancy family renters. What's the average tenant stay here, and is there a school-zone premium baked into asking?
- What's the average days-on-market for RENTAL listings here right now (not sales)? A rising rental-DOM trend means longer vacancies and softer asking-rent achievability than the comps imply.
- What's the recent tenant-quality profile in this submarket — average credit score on applications, eviction rate, late-payment / NSF rate, and stable-employment percentage? A property-management company in the area should have these aggregated.
- How much new apartment / multifamily construction is in the pipeline within 1–3 miles? Heavy new supply (>2% of stock underway) typically softens rents 12–24 months out; light construction supports rent growth.
Investment metrics
- 1% rule
- 1.03% ✓
- Cap rate
- 7.80%
- Cash-on-cash
- 5.40%
- DSCR
- 1.24
- GRM
- 8.1
CMA / ARV
- ARV (on-the-fly)
- $264,384
- Comps found
- 2
Show comp detail 2 sales within ~0.75 mi
| Address | Dist | Beds/Ba | Sqft | Sold | Price | $/sf | Match |
|---|---|---|---|---|---|---|---|
| 1352 Castillion Dr NE | 0.15mi | 4/2.0 | 2,085 (-15%) | 10mo | $225,500 | $108 | 60 |
| 7939 & 7941 Cherry Hill Dr NE | 0.21mi | 5/3.5 (+1) | 2,786 (+14%) | 10mo | $140,000 | $50 | 48 |
Match score weights: distance 35% · size 25% · config 20% · recency 20%. Top-matched comps best support the ARV.
Projected returns pro-forma
-3.0% appreciation · 3.0% rent growth · sell at horizon
- IRR
- -7.9%
- Equity multiple
- 0.71×
- Total profit
- $-19,596
- Equity at exit
- $35,770
- IRR
- 1.6%
- Equity multiple
- 1.12×
- Total profit
- $7,864
- Equity at exit
- $20,742
Cash invested: $67,172 (down + closing). Projections, not guarantees.
Landlord ↔ Tenant lean methodology
- Overall (STATE)
- 73 Landlord-Friendly
- State Ohio
- 73 Landlord-Friendly · R+6
- County
- — inherits STATE
- City
- — inherits STATE
ZIP-level market 44484
- Home prices YoY
- -17.5%
- Active inventory
- 90
- Price-to-rent
- 16.1×
Monthly cashflow live
- Estimated rent
- $2,481 medium interval (Pro) →
- Mortgage (P&I)
- −$1,258
- Tax est. 1.5%
- −$300 /mo · $3,598/yr
- Insurance
- −$100
- HOA
- −$0
- Vacancy / Maint / Mgmt
- −$521
- Net cashflow
- $302
Break-even live
Sensitivity live
| Price | -10% $468 | -5% $385 | +0% $302 | +5% $219 | +10% $136 |
|---|---|---|---|---|---|
| Rent | -10% $106 | -5% $204 | +0% $302 | +5% $400 | +10% $498 |
| Rate | -1.0pp $423 | -0.5pp $363 | base $302 | +0.5pp $240 | +1.0pp $177 |
2-unit breakdown (identical units grouped — click to expand)
| Units | Beds | Baths | Est. rent |
|---|---|---|---|
| 2× units | 2 | 1 | $2,482 |
| #1 | 2 | 1 | $1,241 |
| #2 | 2 | 1 | $1,241 |
| Total (2 units) | $2,481 | ||
UW: 25.0% down · 7.5% · 30yr · 1.5% tax · 5.0% vac · 8.0% maint · 8.0% mgmt
Financing live
Cash to close
- Down payment
- $59,975
- Closing costs
- $7,197
- Reserves months
- —
- Total cash needed
- —
Loan-product check · same deal, 3 products live
Conventional
25% down · 7.5% · 30yr
- Down + closing
- —
- Monthly P&I
- —
- Monthly cashflow
- —
- DSCR
- —
- Eligible?
- —
Personal DTI + credit; lowest rate.
DSCR
20% down · 8.5% · 30yr
- Down + closing
- —
- Monthly P&I
- —
- Monthly cashflow
- —
- DSCR
- —
- Eligible?
- —
No personal income docs; deal must DSCR.
Hard money
10% down · 12.0% · 12mo
- Down + closing
- —
- Monthly P&I
- —
- Monthly cashflow
- —
- DSCR
- —
- Eligible?
- —
Short-term bridge; refi at stabilization.
Rent comps 5 comps
| Address | Beds | Baths | Sqft | Rent | $/sqft | DOM | Units | Dist |
|---|---|---|---|---|---|---|---|---|
| 300 Pegotty Ct NE Warren, OH | 3.0 | 2.5 | 1820 | $2,300 | $1.26 | 15d | 1 | 0.38mi |
| 218 Niles Cortland Rd SE Warren, OH | 4.0 | 2.0 | 1784 | $1,600 | $0.90 | 15d | 1 | 1.25mi |
| 1826 Cranberry Ln NE Warren, OH | 2.0–3.0 | 1.5 | 1389 | $1,160 | $0.83 | 15d | 1 | 1.32mi |
| 535 Willow Dr SE Warren, OH | 4.0 | 3.0 | 2500 | $2,695 | $1.08 | 45d | 1 | 1.49mi |
| 535 Willow Dr SE Unit 1 Warren, OH | 4.0 | 2.5 | 2900 | $2,695 | $0.93 | 45d | 1 | 1.49mi |
Listing history 13 events
-
2026-06-22pricedays on market $239,900 Active 15 DOM
-
2026-06-19days on market $249,900 Active 13 DOM
-
2026-06-18days on market $249,900 Active 12 DOM
-
2026-06-17days on market $249,900 Active 11 DOM
-
2026-06-16days on market $249,900 Active 10 DOM
-
2026-06-15days on market $249,900 Active 9 DOM
-
2026-06-14days on market $249,900 Active 7 DOM
-
2026-06-13days on market $249,900 Active 6 DOM
-
2026-06-10days on market $249,900 Active 4 DOM
-
2026-06-09days on market $249,900 Active 3 DOM
-
2026-06-08days on market $249,900 Active 2 DOM
-
2026-06-07remarks 622-char remark
-
2026-06-07$249,900 Active 1 DOM
ⓘ Source: listings_history table (triggers on properties + properties_extension) + one-shot
backfill from property_details.listing_events for pre-trigger history.
Climate risk First Street
- Flood 1/10 Low FEMA zone X (unshaded) · 0% chance over 30 yrs
- Wildfire 1/10 Low
- Heat 3/10 Moderate 7 d/yr ≥96°F today · 17 d/yr by 30 yrs out
- Wind 1/10 Low
- Air quality 3/10 Moderate 1 unhealthy d/yr today · 4 by 30 yrs out
Nearby sold comps map
Loading sold comps map…
Walkable amenities ~0.75 mi
Loading nearby amenities…
Taxation est. · year 1
- Rental income
- $29,772
- − Mortgage interest
- −$13,438
- − Property taxes
- −$3,598
- − Insurance
- −$1,200
- − Repairs & maintenance
- −$2,382
- − Management
- −$2,382
- − Depreciation
- −$6,979
- Taxable loss
- −$207
- Est. tax savings @ 24.0%
- +$50
- After-tax cash flow
- $3,675/yr
For passive investors: Depreciation is non-cash, so a rental often shows a tax loss while cash-flowing — sheltering income. Rental losses are passive: they offset passive income freely, and up to $25,000/yr can offset ordinary (W-2) income if you actively participate and your MAGI is under $100k (phasing out to $0 by $150k); unused losses carry forward. On sale, claimed depreciation is recaptured at up to 25%, and gains may owe capital-gains tax (a 1031 exchange can defer both). Figures are a year-1 estimate at your 24.0% rate — not tax advice; consult a CPA.
Condition & rehab AI · 13 photos
This well-maintained duplex in Howland Center offers two spacious 2-bedroom units with a new roof, new windows, and updated HVAC systems. Fresh paint and landscaping can further enhance its curb appeal and value.
Repairs flagged
- Minor Paint — Paint appears faded in some areas
Value-add opportunities
- Both Paint — Fresh paint can improve the home's curb appeal and interior aesthetics
- Both Landscaping — Well-maintained landscaping can enhance the home's curb appeal and increase its value
Renovation cost estimate screening
| Repair item | Severity | Est. cost |
|---|---|---|
| Paint · Paint appears faded in some areas | Minor | $500–3,000 |
| Total estimated repair cost · 1 items | $500–3,000 |
Value-add ROI direction
- Both Paint — Fresh paint can improve the home's curb appeal and interior aesthetics ↑
- Both Landscaping — Well-maintained landscaping can enhance the home's curb appeal and increase its value ↑
ⓘ Cost ranges are severity-bucket heuristics (US national rule-of-thumb). Get contractor quotes + a written scope before underwriting a rehab budget.
Schools (NCES district)
- District
- Howland Local
- NCES district ID
- 3905016
- Math proficiency
- 59% ▼ -17.00%
- Reading proficiency
- 65% ▼ -13.00%
- Median HH income
- $49,022
- Composite
- 52.63/100
- National rank
- #1556
- State rank
- #260 of 656 in OH
Livability — Howland Center
- Score
- 76/100
- State rank
- #207
- US rank
- #3283
Category grades
Schools grade is shown separately in the Schools card above.
Census & demographics
- Census place
- Howland Center, OH
- County
- Trumbull · 193,293 people
- City population
- 21,634
- Metro
- Youngstown-Warren, OH
- Population (ZIP)
- 21,634
- Household income
- $65,435
- Rent vs Own
- Severe rent burden
- 6.7
Population outlook (Trumbull County) Hauer SSP2
- Today (2025)
- 191,696 people
- By 2030
- 184,015 · -4.0%
- By 2040
- 166,810 · -13.0%
- By 2050
- 149,857 · -21.8%
- By 2075
- 115,769 · -39.6%
- By 2100
- 83,617 · -56.4%
Race, ethnicity, and origin ACS 2023
- Neighborhood character
- Predominantly White (84%)
- Race & ethnicity
- White 84% Black 8% Two or more races 5% Hispanic / Latino 3% Asian 2%
- Common ancestry
- Romanian 3% Lithuanian 2% Serbian 1%
- Foreign-born
- 3% · China, Canada
- Languages at home
- 96% English-only · Other Indo-European 2% Other Asian/Pacific 1% Spanish 1%
Political lean MEDSL · Trumbull
- 2024 margin
- R (+16.8) · D 41.2% · R 58.0%
- 2008→2024 swing
- -39.2pp toward R · 2008: 22.4pp · 2024: -16.8pp
- All cycles
- 2024: R+16.8 2020: R+10.6 2016: R+6.4 2012: D+22.2 2008: D+22.4
Not yet ingested
- Civics
- —
Market trends
- HPI YoY
- ▼ -46.24%
- Current HPI
- 217.6603
- Rent YoY
- —
- Metro
- —
- State GDP YoY
- ▲ 1.98%
- F500 in state
- 48
Industry mix (Fortune 500 HQ in OH)
| Industry | F500 HQs | Revenue |
|---|---|---|
| Insurance | 3 | $145B |
|
||
| Industrial Machinery | 3 | $49B |
|
||
| Financial Services | 3 | $24B |
|
||
| Consumer Goods | 2 | $93B |
|
||
| Aerospace / Defense | 2 | $47B |
|
||
| Utilities | 2 | $33B |
|
||
Price history
1 event — show timeline
- 2026-06-06 Listed $249,900 MLSNOW
Cash-flow waterfall
monthlySold comps — $/sqft
last 12 mo · ≤1 miLoading sold comps…