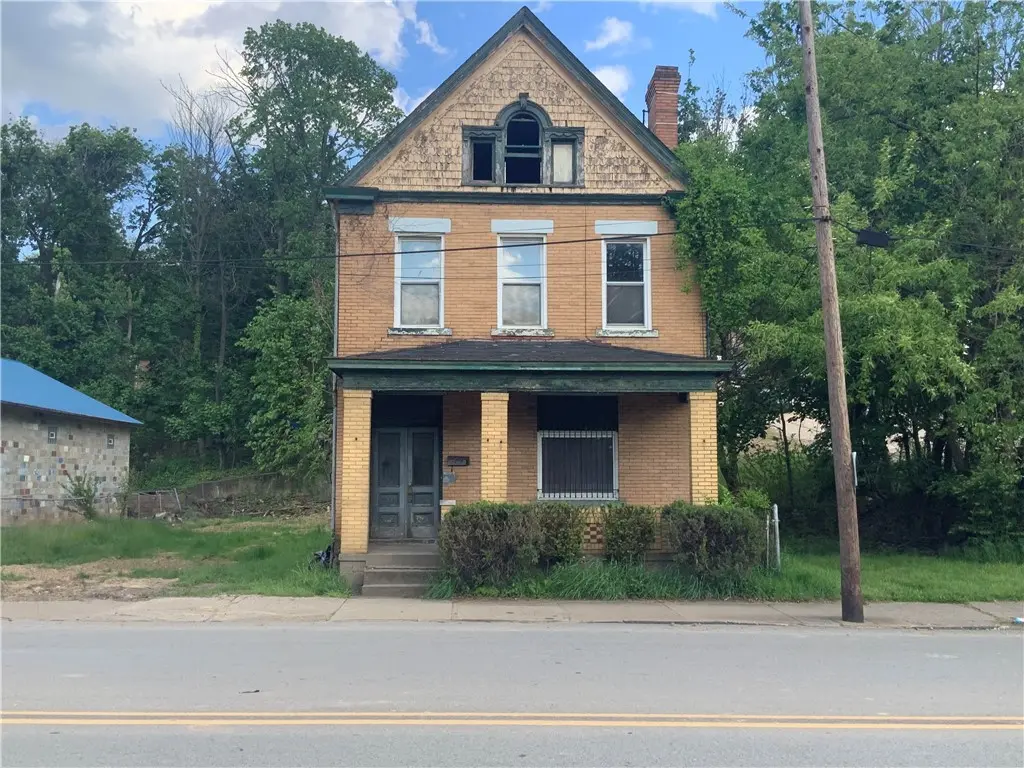
1102 Swissvale Ave · Wilkinsburg, PA
Flood risk 9/10 · Severe
- FEMA flood zone
- X (unshaded)
- Chance of flooding over 30 yrs
- 0.99%
- Est. flood insurance / yr
- $473 – $860
Fire risk 1/10 · Minimal
- Est. fire insurance / yr
- $511 – $949
Heat risk 4/10 · Minor
- Hot days now (above 96°F)
- 7 days/yr
- Hot days in 30 yrs
- 18 days/yr
Wind risk 2/10 · Minimal
- Chance of severe wind over 30 yrs
- —
Air-quality risk 4/10 · Minor
- Unhealthy air days now
- 4 days/yr
- Unhealthy air days in 30 yrs
- 5 days/yr
Risk factors via First Street. Map © Google.
Why this score? — see what drove the B+ grade
The composite is a weighted blend of 9 inputs, each scored 0–100. Each bar is that input's sub-score; the figure is the points it added to the 100-point composite (weight × sub-score).
- Cash flow +30.0/30.0
- ARV discount +15.0/15.0
- 1% rule +10.0/10.0
- DSCR +10.0/10.0
- Livability +3.8/5.0
- Rent growth +3.5/5.0
- Condition / age +2.5/5.0
- Schools +1.5/10.0
- Appreciation +0.0/10.0
$55,000
🖨 Deal sheet 📄 Offer letter ✓ Due diligence
Listing remarks MLS
very clean home move in condition wants offers
Key facts
- 2,252 sq ft lot
- Built 1930
- Listed 43 days
Property features AI
Exterior
- Utilities: Public water
- Home design: 3-story brick building; Resale property
- Construction: Brick construction
- Exterior features: Public water
Interior
- Bathrooms: 1 full bathroom
- Heating & cooling: Electric cooling
- Interior features: Walk-out basement
Neighborhood map
What this means for you Summary
Snapshot
- This is a 3-bed/1.0-bath single-family listed at $55k.
Deal economics
- At list price, monthly cash flow is $1k ($12k/yr) — positive.
- The deal already cash-flows at list — no discount required.
- Meets the 1% rule at list price ($2k rent vs $55k).
- Recommended offer: $53k (3.0% below list) — sets the bar for market timing.
- Cap rate 29.4% vs local median 11.3% in Wilkinsburg — top-decile yield for the area; either an underpriced asset or a hidden risk that comps aren't pricing in. Stress-test before assuming the spread holds.
Location & tenants
- Location reads 76/100 on livability (#411 in PA, #3,754 nationally) — a middle-class / working-renter tenant base. Strengths: commute A+, cost of living A+, housing A+; Watch: schools D+, health & safety D+, crime F.
- Wilkinsburg Borough SD (suburban): math 14% / reading 23% proficiency, ranked #503 of 539 in PA (top 93%) — low school quality limits family demand, transient renter base, plan for 1-2y turnover; 96% free/reduced lunch — lower-income household profile, screen leases tightly.
- Market conditions: Rents rising (+3.9%/yr); 118 active listings in the ZIP; 14 comparable units currently listed for rent nearby; rentals at typical pace (median 24d on market — plan ~3-4 weeks tenant-placement turnaround); 2,996 units permitted in Allegheny County in 2024 (1,588 in 5+ unit buildings).
- This rent runs 40% of the median local income ($55k/yr) — at the standard rent-burdened threshold; future hikes will face affordability resistance.
Forward outlook
- Local home prices are declining (-3.0%/yr); year-one equity from $380 of loan paydown is wiped out by about $2k of value loss. Plan a longer hold.
- At projected returns (-3.0% appreciation + 3.9% rent growth), your $15k cash investment doubles in ~2 years — after that, you're playing with house money.
Negotiation context
- It's been on market 43 days — a 3% lower offer ($53k) is reasonable based on typical stale-listing flexibility.
- 2 sale attempts since 24y ago with the ask held roughly flat each time — persistent listings suggest the price (not the market) is what's stuck; bring a comps-based counter.
- Current owner paid $36k; list at $55k implies a 55% gain — meaningful room to come down on a strong offer.
Risks & watch-outs
- Watch-outs: flood insurance adds $56/mo; built in 1930 — expect roof / HVAC / electrical / plumbing capex.
- Climate carrying-cost: severe flood risk — expect insurance premiums to compound above CPI over the hold.
Questions for the listing agent
- It's been on market 43 days. Have you received any prior offers? Is the seller open to a 3% concession, seller financing, or rate buy-down credit?
- Built in 1930 — when were the roof, HVAC, electrical panel, plumbing, and water heater last replaced?
- What's the actual annual flood-insurance premium (NFIP or private), and is the property in a SFHA with mandatory coverage?
- Is there a deadline driving the sale (1031 exchange, divorce, estate, relocation)? That informs how much negotiation room exists.
- Schools are D-rated, which usually means shorter tenancies and higher turnover. Who's the typical renter profile here, and what's been the actual vacancy rate?
- Crime grade is F in this area — have there been break-ins, vandalism, or insurance claims at this property in the last 3 years? What carrier currently insures it and at what premium?
- What's the average days-on-market for RENTAL listings here right now (not sales)? A rising rental-DOM trend means longer vacancies and softer asking-rent achievability than the comps imply.
- What's the recent tenant-quality profile in this submarket — average credit score on applications, eviction rate, late-payment / NSF rate, and stable-employment percentage? A property-management company in the area should have these aggregated.
- How much new for-sale + rental construction is in the pipeline within 1–3 miles? Heavy new supply typically softens prices + rents 12–24 months out; constrained supply supports both.
Investment metrics
- 1% rule
- 3.29% ✓
- Cap rate
- 29.40%
- Cash-on-cash
- 82.54%
- DSCR
- 4.67
- GRM
- 2.5
CMA / ARV
- ARV (median comp)
- $109,072
- List price
- $55,000
- Delta
- -49.57%
- Verdict
- UNDERPRICED
- Comps
- 20 within 1.0 mi
Show comp detail 12 sales within ~0.75 mi
| Address | Dist | Beds/Ba | Sqft | Sold | Price | $/sf | Match |
|---|---|---|---|---|---|---|---|
| 901 Ross Ave | 0.22mi | 4/1.5 (+1) | 2,196 (+8%) | 2mo | $235,000 | $107 | 67 |
| 1507 Center St | 0.47mi | 4/1.0 (+1) | 1,888 (-7%) | 0mo | $93,000 | $49 | 62 |
| 517 Holmes St | 0.54mi | 4/2.0 (+1) | 2,064 (+2%) | 5mo | $16,000 | $8 | 58 |
| 1454 Center Steet | 0.43mi | 4/1.0 (+1) | 2,248 (+11%) | 3mo | $150,000 | $67 | 54 |
| 16 Love Pl | 0.63mi | 3/2.5 | 1,883 (-7%) | 1mo | $366,000 | $194 | 52 |
| 1424 Walnut St | 0.62mi | 4/2.5 (+1) | 2,086 (+3%) | 4mo | $450,000 | $216 | 52 |
| 1817 Montier St | 0.59mi | 4/2.0 (+1) | 2,156 (+6%) | 6mo | $30,000 | $14 | 48 |
| 431 Locust St | 0.71mi | 4/2.5 (+1) | 1,882 (-7%) | 1mo | $432,000 | $230 | 43 |
| 321 South Ave | 0.74mi | 3/1.0 | 2,250 (+11%) | 10mo | $60,000 | $27 | 39 |
| 132 Beech St | 0.71mi | 4/2.5 (+1) | 2,158 (+7%) | 9mo | $531,115 | $246 | 37 |
| 1509 Walnut St | 0.62mi | 4/3.5 (+1) | 2,300 (+14%) | 10mo | $468,500 | $204 | 26 |
| 257 Maple Ave | 0.74mi | 4/2.0 (+1) | 2,306 (+14%) | 10mo | $210,000 | $91 | 25 |
Match score weights: distance 35% · size 25% · config 20% · recency 20%. Top-matched comps best support the ARV.
Projected returns pro-forma
-3.0% appreciation · 3.86% rent growth · sell at horizon
- IRR
- 79.3%
- Equity multiple
- 4.68×
- Total profit
- $56,655
- Equity at exit
- $8,201
- IRR
- 83.0%
- Equity multiple
- 9.99×
- Total profit
- $138,485
- Equity at exit
- $4,755
Cash invested: $15,400 (down + closing). Projections, not guarantees.
Landlord ↔ Tenant lean methodology
- Overall (STATE)
- 62 Landlord-Friendly
- State Pennsylvania
- 62 Landlord-Friendly · EVEN
- County
- — inherits STATE
- City
- — inherits STATE
ZIP-level market 15221
- Home prices YoY
- -32.3%
- Rents YoY
- 3.9%
- Active inventory
- 118
- Price-to-rent
- 2.5×
Monthly cashflow live
- Estimated rent
- $1,812 high interval (Pro) →
- Mortgage (P&I)
- −$288
- Tax from tax record
- −$60 /mo · $726/yr
- Insurance
- −$23
- Flood insurance flood zone
- −$56 /mo · $666/yr
- HOA
- −$0
- Vacancy / Maint / Mgmt
- −$380
- Net cashflow
- $1,004
Break-even live
UW: 25.0% down · 7.5% · 30yr · 1.5% tax · 5.0% vac · 8.0% maint · 8.0% mgmt
Financing live
Cash to close
- Down payment
- $13,750
- Closing costs
- $1,650
- Reserves months
- —
- Total cash needed
- —
Loan-product check · same deal, 3 products live
Conventional
25% down · 7.5% · 30yr
- Down + closing
- —
- Monthly P&I
- —
- Monthly cashflow
- —
- DSCR
- —
- Eligible?
- —
Personal DTI + credit; lowest rate.
DSCR
20% down · 8.5% · 30yr
- Down + closing
- —
- Monthly P&I
- —
- Monthly cashflow
- —
- DSCR
- —
- Eligible?
- —
No personal income docs; deal must DSCR.
Hard money
10% down · 12.0% · 12mo
- Down + closing
- —
- Monthly P&I
- —
- Monthly cashflow
- —
- DSCR
- —
- Eligible?
- —
Short-term bridge; refi at stabilization.
Rent comps 14 comps
| Address | Beds | Baths | Sqft | Rent | $/sqft | DOM | Units | Dist |
|---|---|---|---|---|---|---|---|---|
| 1030 Ross Ave Pittsburgh, PA | 4.0 | 3.5 | 2856 | $2,200 | $0.77 | 1d | 1 | 0.13mi |
| 1148 East St Pittsburgh, PA | 3.0 | 3.0 | 1738 | $1,700 | $0.98 | 43d | 1 | 0.19mi |
| 745 Franklin Ave Pittsburgh, PA | 4.0 | 2.0 | 1948 | $1,599 | $0.82 | 43d | 1 | 0.38mi |
| 515 Hill Ave Pittsburgh, PA | 4.0 | 1.0 | 1628 | $1,300 | $0.80 | 43d | 1 | 0.54mi |
| 442 Locust St Pittsburgh, PA | 2.0 | 1.0 | 1600 | $2,600 | $1.62 | 2d | 1 | 0.73mi |
| 1962 McNary Blvd Pittsburgh, PA | 3.0 | 1.0 | 1517 | $1,545 | $1.02 | 7d | 1 | 0.86mi |
| 2210 Hampton St Pittsburgh, PA | 3.0 | 1.5 | 1512 | $1,650 | $1.09 | 23d | 1 | 1.21mi |
| 8606 Westwood Rd Pittsburgh, PA | 4.0 | 1.0 | 1596 | $1,425 | $0.89 | 43d | 1 | 1.31mi |
| 2525 Greensburg Pike #305 Pittsburgh, PA | 2.0 | 3.0 | 2964 | $2,975 | $1.00 | 1d | 1 | 1.32mi |
| 1250 Blackadore Ave Pittsburgh, PA | 3.0 | 1.0 | 1440 | $1,750 | $1.22 | 23d | 1 | 1.34mi |
| 8918 Frankstown Rd Pittsburgh, PA | 3.0 | 1.0 | 1400 | $1,907 | $1.36 | 14d | 1 | 1.36mi |
| 2323 Patterson Ave Pittsburgh, PA | 3.0 | 1.0 | 1440 | $1,800 | $1.25 | 43d | 1 | 1.37mi |
| 2323 Patterson Ave Unit NA Pittsburgh, PA | 3.0 | 1.0 | 1440 | $1,500 | $1.04 | 23d | 1 | 1.37mi |
| 2219 Manor Ave Pittsburgh, PA | 3.0 | 1.0 | 1638 | $1,600 | $0.98 | 23d | 1 | 1.48mi |
Listing history 17 events
-
2026-06-18days on market $55,000 Active 43 DOM
-
2026-06-17days on market $55,000 Active 42 DOM
-
2026-06-16days on market $55,000 Active 41 DOM
-
2026-06-15days on market $55,000 Active 40 DOM
-
2026-06-13days on market $55,000 Active 38 DOM
-
2026-06-09days on market $55,000 Active 34 DOM
-
2026-06-08days on market $55,000 Active 33 DOM
-
2026-06-07days on market $55,000 Active 32 DOM
-
2026-06-05days on market $55,000 Active 29 DOM
-
2026-06-03days on market $55,000 Active 28 DOM
-
2026-06-02days on market $55,000 Active 27 DOM
-
2026-06-01days on market $55,000 Active 26 DOM
-
2026-05-31days on market $55,000 Active 25 DOM
-
2026-05-05$55,000 Active 357-char remark
-
2002-10-28soldstatus $35,500 46-char remark
Show marketing remark (46 chars)
very clean home move in condition wants offers
-
2002-10-17soldstatus $35,500
-
2002-07-15$35,500 46-char remark
Show marketing remark (46 chars)
very clean home move in condition wants offers
ⓘ Source: listings_history table (triggers on properties + properties_extension) + one-shot
backfill from property_details.listing_events for pre-trigger history.
Tax reassessment forecast PA · Partial reset (capped growth)
- Current annual tax
- $726 · $60/mo
- Projected year-2 tax
- $797 · $66/mo
- Expected delta
- +$72/yr (+$6/mo · 9.9%)
ⓘ Screening estimate from a state-policy table — verify with the county assessor before closing.
Climate risk First Street
- Flood 9/10 Extreme FEMA zone X (unshaded) · 99% chance over 30 yrs
- Wildfire 1/10 Low
- Heat 4/10 Moderate 7 d/yr ≥96°F today · 18 d/yr by 30 yrs out
- Wind 2/10 Low
- Air quality 4/10 Moderate 4 unhealthy d/yr today · 5 by 30 yrs out
Nearby sold comps map
Loading sold comps map…
Walkable amenities ~0.75 mi
Loading nearby amenities…
Taxation est. · year 1
- Rental income
- $21,738
- − Mortgage interest
- −$3,081
- − Property taxes
- −$726
- − Insurance
- −$942
- − Repairs & maintenance
- −$1,739
- − Management
- −$1,739
- − Depreciation
- −$1,600
- Taxable income
- $11,912
- Est. tax owed @ 24.0%
- −$2,859
- After-tax cash flow
- $9,186/yr
For passive investors: Depreciation is non-cash, so a rental often shows a tax loss while cash-flowing — sheltering income. Rental losses are passive: they offset passive income freely, and up to $25,000/yr can offset ordinary (W-2) income if you actively participate and your MAGI is under $100k (phasing out to $0 by $150k); unused losses carry forward. On sale, claimed depreciation is recaptured at up to 25%, and gains may owe capital-gains tax (a 1031 exchange can defer both). Figures are a year-1 estimate at your 24.0% rate — not tax advice; consult a CPA.
Schools (NCES district)
- District
- Wilkinsburg Borough SD
- NCES district ID
- 4226370
- Math proficiency
- 14% ▼ -8.00%
- Reading proficiency
- 23% ▼ -9.00%
- Median HH income
- $32,204
- Composite
- 14.94/100
- National rank
- #9368
- State rank
- #503 of 539 in PA
Livability — Wilkinsburg
- Score
- 76/100
- State rank
- #411
- US rank
- #3754
Category grades
Schools grade is shown separately in the Schools card above.
Census & demographics
- Census place
- Wilkinsburg, PA
- County
- Allegheny County · 1,022,028 people
- City population
- 29,513
- Metro
- Pittsburgh, PA
- Population (ZIP)
- 29,374
- Household income
- $55,028
- Rent vs Own
- Severe rent burden
- 1933.0
Population outlook (Allegheny County) Hauer SSP2
- Today (2025)
- 1,250,282 people
- By 2030
- 1,256,482 · +0.5%
- By 2040
- 1,256,318 · +0.5%
- By 2050
- 1,244,169 · -0.5%
- By 2075
- 1,197,693 · -4.2%
- By 2100
- 1,093,187 · -12.6%
Race, ethnicity, and origin ACS 2023
- Neighborhood character
- Diverse neighborhood (Simpson 0.60)
- Race & ethnicity
- White 47% Black 43% Two or more races 7% Hispanic / Latino 4% Asian 1%
- Common ancestry
- Romanian 4% Lithuanian 2% Serbian 1%
- Foreign-born
- 4% · Canada, South Korea, China
- Languages at home
- 93% English-only · Spanish 2% French/Haitian/Cajun 1% Other Indo-European 1%
Political lean MEDSL · Allegheny
- 2024 margin
- Strong D (+20.3) · D 59.7% · R 39.4%
- 2008→2024 swing
- +4.8pp toward D · 2008: 15.5pp · 2024: 20.3pp
- All cycles
- 2024: D+20.3 2020: D+20.4 2016: D+16.4 2012: D+14.4 2008: D+15.5
Not yet ingested
- Civics
- —
Market trends
- HPI YoY
- ▼ -109.77%
- Current HPI
- 230.0486
- Rent YoY
- ▲ 3.86%
- Metro
- Pittsburgh, PA
- State GDP YoY
- ▲ 1.68%
- F500 in state
- 34
Industry mix (Fortune 500 HQ in PA)
| Industry | F500 HQs | Revenue |
|---|---|---|
| Healthcare | 2 | $309B |
|
||
| Insurance | 2 | $27B |
|
||
| Telecommunications / Media | 1 | $124B |
|
||
| Industrial Distribution | 1 | $22B |
|
||
| Financial Services | 1 | $20B |
|
||
| Chemicals / Materials | 1 | $18B |
|
||
Price history
+54.9% since first listed4 events — show timeline
- 2026-05-05 Listed $55,000 West Penn MLS
- 2002-10-28 Sold (MLS) $35,500 West Penn MLS
- 2002-10-17 Sold (Public Records) $35,500 Public Records
- 2002-07-15 Listed $35,500 West Penn MLS
Property tax history
-3.1%/yrLatest (2026): $726 · +3.0% YoY. Source: county tax records.
Cash-flow waterfall
monthlySold comps — $/sqft
last 12 mo · ≤1 miLoading sold comps…