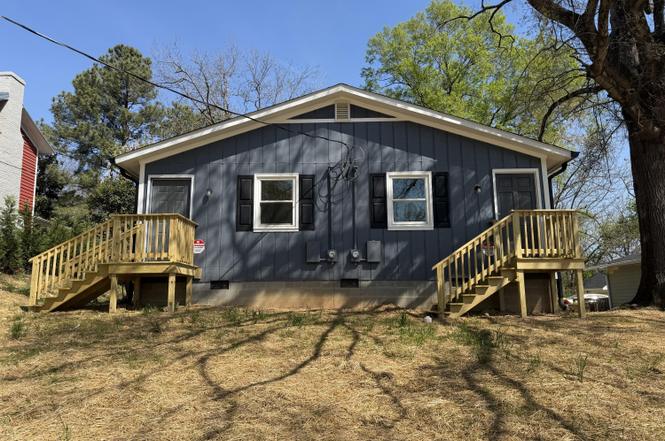
719 Holloway St · Durham, NC
Flood risk 1/10 · Minimal
- FEMA flood zone
- X (unshaded)
- Chance of flooding over 30 yrs
- 0.0%
- Est. flood insurance / yr
- $507 – $1,088
Fire risk 1/10 · Minimal
- Est. fire insurance / yr
- $906 – $1,684
Heat risk 6/10 · Moderate
- Hot days now (above 106°F)
- 7 days/yr
- Hot days in 30 yrs
- 16 days/yr
Wind risk 6/10 · Moderate
- Chance of severe wind over 30 yrs
- 27.0%
Air-quality risk 2/10 · Minimal
- Unhealthy air days now
- 1 days/yr
- Unhealthy air days in 30 yrs
- 1 days/yr
Risk factors via First Street. Map © Google.
Why this score? — see what drove the B- grade
The composite is a weighted blend of 9 inputs, each scored 0–100. Each bar is that input's sub-score; the figure is the points it added to the 100-point composite (weight × sub-score).
- Cash flow +28.5/30.0
- DSCR +10.0/10.0
- ARV discount +7.5/15.0
- 1% rule +7.0/10.0
- Livability +4.0/5.0
- Rent growth +3.3/5.0
- Schools +3.0/10.0
- Condition / age +2.5/5.0
- Appreciation +0.0/10.0
$260,000
🖨 Deal sheet 📄 Offer letter ✓ Due diligence
Listing remarks
719 Holloway Street presents a value-add duplex opportunity in a rapidly growing Durham corridor. The property consists of two identical 2-bedroom, 1-bathroom units and will be delivered fully vacant, allowing an investor to lease both units at market rents. Estimated rents are approximately $1,200 per month per unit. The duplex was recently relocated to the site (permit available in documents) and placed on a new foundation, with additional improvements including new decks and a freshly painted exterior. With major exterior work already completed, ownership can focus on minor interior improvements and lease-up to create value. Located in the path of progress, the property offers attractive
Key facts
- New foundation
- New decks
- Two identical units
Tags
Property features AI
Finance
- Other: Lot size approximately 0.43 acres
- Financial info: Two total units; Tenants pay electricity and water; Owner pays: see remarks
- HOA & community: No association
Exterior
- Parking: 2 open parking spaces; Shared driveway
- Utilities: Public water; Public sewer
- Home design: Duplex; One level
- Construction: Wood siding construction
- Exterior features: Shingle roof; Wood siding
Interior
- Bedrooms: 4 bedrooms
- Flooring: Carpet; Vinyl
- Bathrooms: 1 full bathroom
- Heating & cooling: Baseboard heating; Wall unit cooling
- Interior features: Carpet and vinyl flooring
Neighborhood map
What this means for you Summary
Snapshot
- This is a 4-bed/2.0-bath other listed at $260k.
Deal economics
- At list price, monthly cash flow is $849 ($10k/yr) — positive.
- The deal already cash-flows at list — no discount required.
- Meets the 1% rule at list price ($3k rent vs $260k).
- Cap rate 10.2% vs local median 3.0% in Durham — top-decile yield for the area; either an underpriced asset or a hidden risk that comps aren't pricing in. Stress-test before assuming the spread holds.
Location & tenants
- Location reads 81/100 on livability (#15 in NC, #1,411 nationally) — a professional / high-income tenant draw. Strengths: amenities A+, commute A+, housing A+; Watch: schools D+, crime F.
- Durham Public Schools (urban): math 29% / reading 39% proficiency, ranked #132 of 178 in NC (top 74%) — families likely to look elsewhere, expect single-tenant / working-renter base with shorter leases.
- Market conditions: Rents rising (+3.2%/yr); 197 active listings in the ZIP; 21 comparable units currently listed for rent nearby; rentals at typical pace (median 24d on market — plan ~3-4 weeks tenant-placement turnaround); 2,905 units permitted in Durham County in 2024 (955 in 5+ unit buildings).
- At $3,125/mo this rent would consume 54% of the median local household income ($70k/yr) (locally 1402% of renters already pay >50% of income on rent) — very limited rent-growth headroom before tenants either downsize or default.
Forward outlook
- Local home prices are declining (-3.0%/yr); year-one equity from $2k of loan paydown is wiped out by about $8k of value loss. Plan a longer hold.
- Durham County population projected at +44% by 2050 — long-run rental-demand tailwind backs the buy-and-hold thesis.
- At projected returns (-3.0% appreciation + 3.2% rent growth), your $73k cash investment doubles in ~9 years — after that, you're playing with house money.
Negotiation context
- Only 1 days on market — expect competitive offers; lowballing is unlikely to land.
Risks & watch-outs
- Climate carrying-cost: major wind risk, 27% chance of damaging wind over 30y; extreme-heat days projected 7→16/yr by 2055 (HVAC capex compounding) — expect insurance premiums to compound above CPI over the hold.
Questions for the listing agent
- Is there a deadline driving the sale (1031 exchange, divorce, estate, relocation)? That informs how much negotiation room exists.
- Schools are D-rated, which usually means shorter tenancies and higher turnover. Who's the typical renter profile here, and what's been the actual vacancy rate?
- Crime grade is F in this area — have there been break-ins, vandalism, or insurance claims at this property in the last 3 years? What carrier currently insures it and at what premium?
- What's the average days-on-market for RENTAL listings here right now (not sales)? A rising rental-DOM trend means longer vacancies and softer asking-rent achievability than the comps imply.
- What's the recent tenant-quality profile in this submarket — average credit score on applications, eviction rate, late-payment / NSF rate, and stable-employment percentage? A property-management company in the area should have these aggregated.
- How much new for-sale + rental construction is in the pipeline within 1–3 miles? Heavy new supply typically softens prices + rents 12–24 months out; constrained supply supports both.
Investment metrics
- 1% rule
- 1.20% ✓
- Cap rate
- 10.21%
- Cash-on-cash
- 14.00%
- DSCR
- 1.62
- GRM
- 6.9
CMA / ARV
No comps found within radius.
Projected returns pro-forma
-3.0% appreciation · 3.25% rent growth · sell at horizon
- IRR
- 4.5%
- Equity multiple
- 1.17×
- Total profit
- $12,689
- Equity at exit
- $38,767
- IRR
- 14.2%
- Equity multiple
- 2.15×
- Total profit
- $83,703
- Equity at exit
- $22,480
Cash invested: $72,800 (down + closing). Projections, not guarantees.
Landlord ↔ Tenant lean methodology
- Overall (STATE)
- 85 Strongly Landlord-Friendly
- State North Carolina
- 85 Strongly Landlord-Friendly · R+3
- County
- — inherits STATE
- City
- — inherits STATE
ZIP-level market 27701
- Rents YoY
- 3.2%
- Active inventory
- 197
- Price-to-rent
- 6.9×
Monthly cashflow live
- Estimated rent
- $3,125 high interval (Pro) →
- Mortgage (P&I)
- −$1,363
- Tax from tax record
- −$148 /mo · $1,772/yr
- Insurance
- −$108
- HOA
- −$0
- Vacancy / Maint / Mgmt
- −$656
- Net cashflow
- $849
Break-even live
UW: 25.0% down · 7.5% · 30yr · 1.5% tax · 5.0% vac · 8.0% maint · 8.0% mgmt
Financing live
Cash to close
- Down payment
- $65,000
- Closing costs
- $7,800
- Reserves months
- —
- Total cash needed
- —
Loan-product check · same deal, 3 products live
Conventional
25% down · 7.5% · 30yr
- Down + closing
- —
- Monthly P&I
- —
- Monthly cashflow
- —
- DSCR
- —
- Eligible?
- —
Personal DTI + credit; lowest rate.
DSCR
20% down · 8.5% · 30yr
- Down + closing
- —
- Monthly P&I
- —
- Monthly cashflow
- —
- DSCR
- —
- Eligible?
- —
No personal income docs; deal must DSCR.
Hard money
10% down · 12.0% · 12mo
- Down + closing
- —
- Monthly P&I
- —
- Monthly cashflow
- —
- DSCR
- —
- Eligible?
- —
Short-term bridge; refi at stabilization.
Rent comps 21 comps
| Address | Beds | Baths | Sqft | Rent | $/sqft | DOM | Units | Dist |
|---|---|---|---|---|---|---|---|---|
| 1312 N Alston Ave Durham, NC | 4.0 | 2.5 | 1660 | $2,350 | $1.42 | 23d | 1 | 0.36mi |
| 809 Drew St Durham, NC | 3.0 | 2.0 | 2192 | $3,000 | $1.37 | 23d | 1 | 0.44mi |
| 500 E Main St Durham, NC | 3.0 | 1.0–2.0 | 1002 | $3,556 | $3.55 | 13d | 40 | 0.46mi |
| 510 E Pettigrew St Durham, NC | 3.0 | 1.0–2.0 | 996 | $3,130 | $3.14 | 13d | 29 | 0.67mi |
| 504 E Pettigrew St Durham, NC | 3.0 | 1.0–2.0 | 1092 | $2,528 | $2.32 | 21d | 30 | 0.69mi |
| 441 S Dillard St Durham, NC | 1.0–3.0 | 1.0–2.5 | 1153 | $3,389 | $2.94 | 13d | 21 | 0.70mi |
| 104 N Hyde Park Ave Durham, NC | 3.0 | 2.5 | 1980 | $3,900 | $1.97 | 23d | 1 | 0.73mi |
| 211 Hargrove St Unit 1300731P Durham, NC | 3.0 | 3.0 | 2131 | $5,298 | $2.49 | 13d | 1 | 0.81mi |
| 511 S Mangum St Durham, NC | 3.0 | 1.0–2.0 | 1159 | $4,115 | $3.55 | 13d | 29 | 0.83mi |
| 214 N Guthrie Ave Unit A Durham, NC | 3.0 | 2.5 | 1586 | $1,700 | $1.07 | 13d | 1 | 0.84mi |
| 1602 Juniper St Unit B Durham, NC | 4.0 | 3.0 | 1754 | $2,800 | $1.60 | 23d | 1 | 0.85mi |
| 1602 Juniper St Unit A Durham, NC | 3.0 | 2.5 | 1688 | $2,400 | $1.42 | 23d | 1 | 0.85mi |
| 114 N Guthrie Ave Durham, NC | 4.0 | 3.0 | 1877 | $2,450 | $1.31 | 23d | 1 | 0.87mi |
| 207 Dacian Ave Durham, NC | 4.0 | 3.5 | 2647 | $6,250 | $2.36 | 23d | 1 | 0.98mi |
| 701 Washington St Durham, NC | 1.0–3.0 | 1.0–2.0 | 996 | $5,241 | $5.26 | 13d | 214 | 1.05mi |
| 605 W Main St Durham, NC | 3.0 | 1.0–2.0 | 977 | $3,628 | $3.71 | 13d | 48 | 1.10mi |
| 1006 Grant St Durham, NC | 4.0 | 4.0 | 2201 | $3,120 | $1.42 | 23d | 1 | 1.12mi |
| 1008 Grant St Durham, NC | 4.0 | 4.0 | 2201 | $3,120 | $1.42 | 23d | 1 | 1.13mi |
| 910 Scout Dr Durham, NC | 3.0 | 2.5 | 1508 | $4,000 | $2.65 | 23d | 1 | 1.18mi |
| 900 Dacian Ave Unit B Durham, NC | 3.0 | 2.0 | 1550 | $2,595 | $1.67 | 23d | 1 | 1.34mi |
| 1114 South St Durham, NC | 3.0 | 2.5 | 1418 | $3,000 | $2.12 | 23d | 1 | 1.34mi |
Listing history 2 events
-
2026-06-18remarks 699-char remark
-
2026-06-18$260,000 Active 1 DOM
ⓘ Source: listings_history table (triggers on properties + properties_extension) + one-shot
backfill from property_details.listing_events for pre-trigger history.
Tax reassessment forecast NC · Resets to sale price
- Current annual tax
- $1,772 · $148/mo
- Projected year-2 tax
- $2,132 · $178/mo
- Expected delta
- +$360/yr (+$30/mo · 20.3%)
ⓘ Screening estimate from a state-policy table — verify with the county assessor before closing.
Climate risk First Street
- Flood 1/10 Low FEMA zone X (unshaded) · 0% chance over 30 yrs
- Wildfire 1/10 Low
- Heat 6/10 Major 7 d/yr ≥106°F today · 16 d/yr by 30 yrs out
- Wind 6/10 Major 27% chance of damaging wind over 30 yrs
- Air quality 2/10 Low 1 unhealthy d/yr today · 1 by 30 yrs out
Nearby sold comps map
Loading sold comps map…
Walkable amenities ~0.75 mi
Loading nearby amenities…
Taxation est. · year 1
- Rental income
- $37,501
- − Mortgage interest
- −$14,564
- − Property taxes
- −$1,772
- − Insurance
- −$1,300
- − Repairs & maintenance
- −$3,000
- − Management
- −$3,000
- − Depreciation
- −$7,564
- Taxable income
- $6,301
- Est. tax owed @ 24.0%
- −$1,512
- After-tax cash flow
- $8,680/yr
For passive investors: Depreciation is non-cash, so a rental often shows a tax loss while cash-flowing — sheltering income. Rental losses are passive: they offset passive income freely, and up to $25,000/yr can offset ordinary (W-2) income if you actively participate and your MAGI is under $100k (phasing out to $0 by $150k); unused losses carry forward. On sale, claimed depreciation is recaptured at up to 25%, and gains may owe capital-gains tax (a 1031 exchange can defer both). Figures are a year-1 estimate at your 24.0% rate — not tax advice; consult a CPA.
Schools (NCES district)
- District
- Durham Public Schools
- NCES district ID
- 3701260
- Math proficiency
- 29% ▼ -3.00%
- Reading proficiency
- 39% ▲ 2.00%
- Median HH income
- $52,143
- Composite
- 29.69/100
- National rank
- #6457
- State rank
- #132 of 178 in NC
Livability — Durham
- Score
- 81/100
- State rank
- #15
- US rank
- #1411
Category grades
Schools grade is shown separately in the Schools card above.
Census & demographics
- Census place
- Durham, NC
- County
- Durham County · 288,747 people
- City population
- 288,747
- Metro
- Durham-Chapel Hill, NC
- Population (ZIP)
- 24,793
- Household income
- $69,740
- Rent vs Own
- Severe rent burden
- 1402.0
Population outlook (Durham County) Hauer SSP2
- Today (2025)
- 368,962 people
- By 2030
- 402,686 · +9.1%
- By 2040
- 468,677 · +27.0%
- By 2050
- 531,727 · +44.1%
- By 2075
- 660,446 · +79.0%
- By 2100
- 739,971 · +100.6%
Race, ethnicity, and origin ACS 2023
- Neighborhood character
- Diverse neighborhood (Simpson 0.69)
- Race & ethnicity
- White 40% Black 32% Hispanic / Latino 19% Two or more races 9% Asian 3%
- Hispanic origin (detail)
- Mexican 9%
- Common ancestry
- Romanian 2% Italian 2% Slovak 2%
- Foreign-born
- 18% · Canada, Vietnam
- Languages at home
- 76% English-only · Spanish 18% Other Indo-European 2% German/W. Germanic 1%
Political lean MEDSL · Durham
- 2024 margin
- Solid D (+61.9) · D 80.2% · R 18.2% · Other 1.6%
- 2008→2024 swing
- +10.0pp toward D · 2008: 51.9pp · 2024: 61.9pp
- All cycles
- 2024: D+61.9 2020: D+62.4 2016: D+60.4 2012: D+52.7 2008: D+51.9
Not yet ingested
- Civics
- —
Market trends
- HPI YoY
- ▼ -272.19%
- Current HPI
- 347.5371
- Rent YoY
- ▲ 3.25%
- Metro
- Durham-Chapel Hill, NC
- State GDP YoY
- ▲ 3.28%
- F500 in state
- 26
Industry mix (Fortune 500 HQ in NC)
| Industry | F500 HQs | Revenue |
|---|---|---|
| Financial Services | 2 | $213B |
|
||
| Retail | 2 | $95B |
|
||
| Industrial Conglomerate | 1 | $38B |
|
||
| Metals / Steel | 1 | $35B |
|
||
| Utilities | 1 | $30B |
|
||
| Industrial Machinery | 1 | $19B |
|
||
Price history
1 event — show timeline
- 2026-06-18 Listed $260,000 TMLS
Property tax history
+8.8%/yrLatest (2025): $1,772 · -12.2% YoY. Source: county tax records.
Cash-flow waterfall
monthlySold comps — $/sqft
last 12 mo · ≤1 miLoading sold comps…