6780 Woods Acres Dr · Slaughterville, OK
Flood risk 1/10 · Minimal
- FEMA flood zone
- X (unshaded)
- Chance of flooding over 30 yrs
- 0.0%
- Est. flood insurance / yr
- $507 – $1,088
Fire risk 6/10 · Moderate
- Est. fire insurance / yr
- $2,463 – $4,575
Heat risk 6/10 · Moderate
- Hot days now (above 109°F)
- 7 days/yr
- Hot days in 30 yrs
- 18 days/yr
Wind risk 3/10 · Minor
- Chance of severe wind over 30 yrs
- 6.0%
Air-quality risk 2/10 · Minimal
- Unhealthy air days now
- 1 days/yr
- Unhealthy air days in 30 yrs
- 1 days/yr
Risk factors via First Street. Map © Google.
Why this score? — see what drove the D- grade
The composite is a weighted blend of 9 inputs, each scored 0–100. Each bar is that input's sub-score; the figure is the points it added to the 100-point composite (weight × sub-score).
- Cash flow +12.5/30.0
- ARV discount +7.5/15.0
- DSCR +3.7/10.0
- Livability +3.2/5.0
- 1% rule +2.5/10.0
- Rent growth +2.5/5.0
- Condition / age +2.5/5.0
- Schools +2.1/10.0
- Appreciation +0.0/10.0
$119,000
🖨 Deal sheet 📄 Offer letter ✓ Due diligence
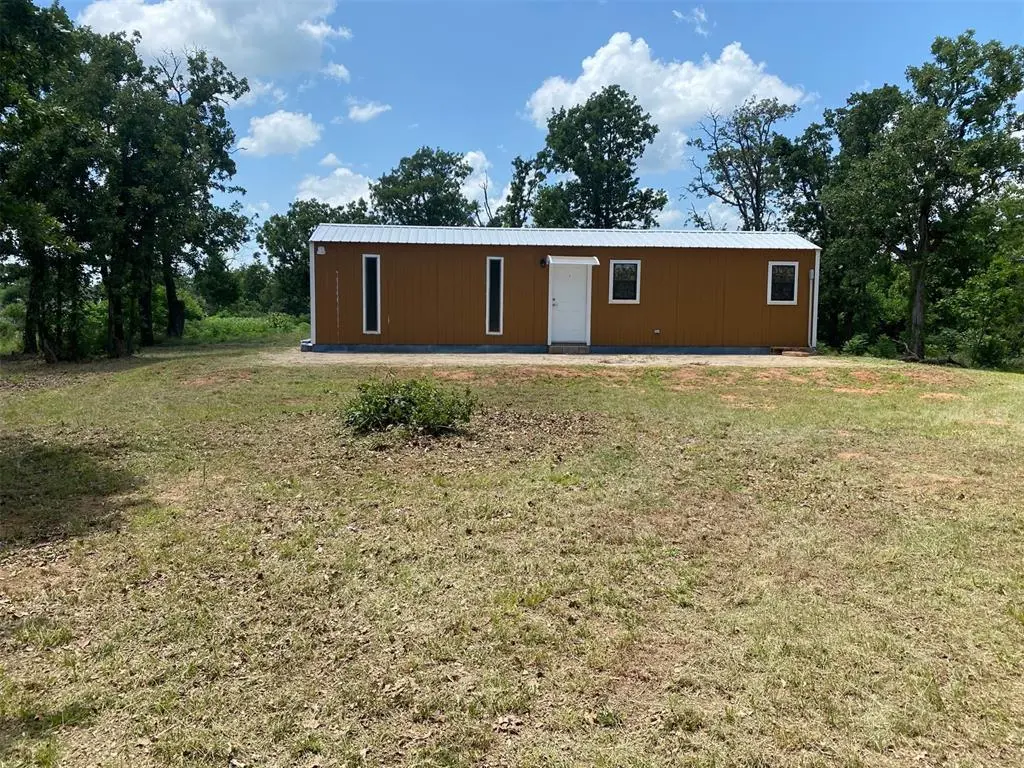
Listing remarks
A little over 2 beautiful acres with mature trees, this charming tiny home offers the perfect blend of privacy and convenience. Tucked away on a private road, the property provides a peaceful, secluded setting while still being easily accessible. Located close to Lake Thunderbird State Park, you’ll enjoy quick access to boating, fishing, hiking, and outdoor recreation. Whether you're looking for a cozy full-time residence, weekend retreat, or investment opportunity, you'll love the natural beauty and quiet surroundings this unique property has to offer. Tiny home, new electric service and well were put in, in 2022.
Key facts
- Private road
- New electric service
- Well
Tags
Property features AI
Finance
- Other: Existing property; Homestead not claimed
- Financial info: Not assumable; Loan qualification unknown
- HOA & community: No mandatory association dues
Exterior
- Home design: Single-family residence; One-level entry
- Construction: Metal roof; Other construction materials; Slab foundation
- Exterior features: Open patio; Wooded lot
Interior
- Bedrooms: 1 bedroom
- Bathrooms: 1 full bathroom
- Interior features: One living area; No fireplace; Zoned heating; Zoned cooling
Neighborhood map
What this means for you Summary
Snapshot
- This is a 1-bed/1.0-bath single-family listed at $119k.
Deal economics
- At list price, monthly cash flow is $-18 ($-214/yr) — negative.
- To cash-flow at today's rent, offer at most $116k (2.7% below list).
- To meet the 1% rule (rent ≥ 1% of price), the offer needs to be $89k (25.1% below list).
- Recommended offer: $89k (25.1% below list) — sets the bar for 1% rule.
- Cap rate 6.1% vs local median 4.4% in Slaughterville — top-decile yield for the area; either an underpriced asset or a hidden risk that comps aren't pricing in. Stress-test before assuming the spread holds.
Location & tenants
- Location reads 63/100 on livability (#228 in OK) — a middle-class / working-renter tenant base. Strengths: cost of living A+, housing A+, employment A; Watch: amenities F, commute F, health & safety F.
- Noble (suburban): math 23% / reading 25% proficiency, ranked #108 of 270 in OK (top 40%) — low school quality limits family demand, transient renter base, plan for 1-2y turnover.
- Zoned schools: John K Hubbard Es (math 27% / reading 27%, grade F, #311 of 845 statewide, top 40%, 646 students, 0% FRL); Noble Hs (math 17% / reading 27%, grade F, #222 of 447 statewide, top 52%, 883 students, 0% FRL) — zoned schools average 0% FRL vs 53% district-wide (53 pts lower); this property's tenant base skews higher-income than the district average.
- Market conditions: 214 active listings in the ZIP; 592 units permitted in Cleveland County in 2024 (12 in 5+ unit buildings).
- This rent is only 14% of the median local income ($74k/yr) — well below the 30% rent-burden line; pricing power to push rent on renewal without tenant pushback.
Forward outlook
- Local home prices are declining (-3.0%/yr); year-one equity from $823 of loan paydown is wiped out by about $4k of value loss. Plan a longer hold.
- Cleveland County population projected at +40% by 2050 — long-run rental-demand tailwind backs the buy-and-hold thesis.
Negotiation context
- It's been on market 39 days — a 3% lower offer ($115k) is reasonable based on typical stale-listing flexibility.
- 2 sale attempts since 16y ago with the ask held roughly flat each time — persistent listings suggest the price (not the market) is what's stuck; bring a comps-based counter.
Risks & watch-outs
- Climate carrying-cost: major wildfire risk; extreme-heat days projected 7→18/yr by 2055 (HVAC capex compounding) — expect insurance premiums to compound above CPI over the hold.
Questions for the listing agent
- What do current leases actually rent for vs. the listed asking? Can we see a recent rent roll and the last 12 months of T-12 income?
- It's been on market 39 days. Have you received any prior offers? Is the seller open to a 25% concession, seller financing, or rate buy-down credit?
- Is there a deadline driving the sale (1031 exchange, divorce, estate, relocation)? That informs how much negotiation room exists.
- Schools are F-rated, which usually means shorter tenancies and higher turnover. Who's the typical renter profile here, and what's been the actual vacancy rate?
- The area grade is low — what's the realistic commute time and amenity access for the typical tenant pool here? Any planned neighborhood developments (good or bad) we should know about?
- What's the average days-on-market for RENTAL listings here right now (not sales)? A rising rental-DOM trend means longer vacancies and softer asking-rent achievability than the comps imply.
- What's the recent tenant-quality profile in this submarket — average credit score on applications, eviction rate, late-payment / NSF rate, and stable-employment percentage? A property-management company in the area should have these aggregated.
- How much new for-sale + rental construction is in the pipeline within 1–3 miles? Heavy new supply typically softens prices + rents 12–24 months out; constrained supply supports both.
Investment metrics
- 1% rule
- 0.75% ✗
- Cap rate
- 6.11%
- Cash-on-cash
- -0.64%
- DSCR
- 0.97
- GRM
- 11.1
CMA / ARV
No comps found within radius.
Projected returns pro-forma
-3.0% appreciation · 3.0% rent growth · sell at horizon
- IRR
- -17.4%
- Equity multiple
- 0.39×
- Total profit
- $-20,469
- Equity at exit
- $17,743
- IRR
- -9.5%
- Equity multiple
- 0.42×
- Total profit
- $-19,485
- Equity at exit
- $10,289
Cash invested: $33,320 (down + closing). Projections, not guarantees.
Landlord ↔ Tenant lean methodology
- Overall (STATE)
- 83 Strongly Landlord-Friendly
- State Oklahoma
- 83 Strongly Landlord-Friendly · R+20
- County
- — inherits STATE
- City
- — inherits STATE
ZIP-level market 73068
- Home prices YoY
- -4.8%
- Active inventory
- 214
- Price-to-rent
- 11.1×
Monthly cashflow live
- Estimated rent
- $891 medium interval (Pro) →
- Mortgage (P&I)
- −$624
- Tax from tax record
- −$48 /mo · $576/yr
- Insurance
- −$50
- HOA
- −$0
- Vacancy / Maint / Mgmt
- −$187
- Net cashflow
- $-18
Break-even live
UW: 25.0% down · 7.5% · 30yr · 1.5% tax · 5.0% vac · 8.0% maint · 8.0% mgmt
Financing live
Cash to close
- Down payment
- $29,750
- Closing costs
- $3,570
- Reserves months
- —
- Total cash needed
- —
Loan-product check · same deal, 3 products live
Conventional
25% down · 7.5% · 30yr
- Down + closing
- —
- Monthly P&I
- —
- Monthly cashflow
- —
- DSCR
- —
- Eligible?
- —
Personal DTI + credit; lowest rate.
DSCR
20% down · 8.5% · 30yr
- Down + closing
- —
- Monthly P&I
- —
- Monthly cashflow
- —
- DSCR
- —
- Eligible?
- —
No personal income docs; deal must DSCR.
Hard money
10% down · 12.0% · 12mo
- Down + closing
- —
- Monthly P&I
- —
- Monthly cashflow
- —
- DSCR
- —
- Eligible?
- —
Short-term bridge; refi at stabilization.
Listing history 16 events
-
2026-06-18days on market $119,000 Active 39 DOM
-
2026-06-17days on market $119,000 Active 38 DOM
-
2026-06-16days on market $119,000 Active 37 DOM
-
2026-06-15days on market $119,000 Active 36 DOM
-
2026-06-13days on market $119,000 Active 34 DOM
-
2026-06-13days on market $119,000 Active 33 DOM
-
2026-06-09days on market $119,000 Active 30 DOM
-
2026-06-08days on market $119,000 Active 29 DOM
-
2026-06-07days on market $119,000 Active 28 DOM
-
2026-06-03days on market $119,000 Active 24 DOM
-
2026-06-02days on market $119,000 Active 23 DOM
-
2026-06-01days on market $119,000 Active 22 DOM
-
2026-05-31days on market $119,000 Active 21 DOM
-
2026-05-09$119,000 Active
-
2010-11-16historical
-
2010-10-27$55,000
ⓘ Source: listings_history table (triggers on properties + properties_extension) + one-shot
backfill from property_details.listing_events for pre-trigger history.
Tax reassessment forecast OK · Resets to sale price
- Current annual tax
- $576 · $48/mo
- Projected year-2 tax
- $1,071 · $89/mo
- Expected delta
- +$495/yr (+$41/mo · 85.9%)
ⓘ Screening estimate from a state-policy table — verify with the county assessor before closing.
Climate risk First Street
- Flood 1/10 Low FEMA zone X (unshaded) · 0% chance over 30 yrs
- Wildfire 6/10 Major
- Heat 6/10 Major 7 d/yr ≥109°F today · 18 d/yr by 30 yrs out
- Wind 3/10 Moderate 6% chance of damaging wind over 30 yrs
- Air quality 2/10 Low 1 unhealthy d/yr today · 1 by 30 yrs out
Nearby sold comps map
Loading sold comps map…
Walkable amenities ~0.75 mi
Loading nearby amenities…
Taxation est. · year 1
- Rental income
- $10,690
- − Mortgage interest
- −$6,666
- − Property taxes
- −$576
- − Insurance
- −$595
- − Repairs & maintenance
- −$855
- − Management
- −$855
- − Depreciation
- −$3,462
- Taxable loss
- −$2,319
- Est. tax savings @ 24.0%
- +$557
- After-tax cash flow
- $342/yr
For passive investors: Depreciation is non-cash, so a rental often shows a tax loss while cash-flowing — sheltering income. Rental losses are passive: they offset passive income freely, and up to $25,000/yr can offset ordinary (W-2) income if you actively participate and your MAGI is under $100k (phasing out to $0 by $150k); unused losses carry forward. On sale, claimed depreciation is recaptured at up to 25%, and gains may owe capital-gains tax (a 1031 exchange can defer both). Figures are a year-1 estimate at your 24.0% rate — not tax advice; consult a CPA.
Schools (NCES district)
- District
- Noble
- NCES district ID
- 4021630
- Math proficiency
- 23% ▼ -8.00%
- Reading proficiency
- 25% ▼ -7.00%
- Median HH income
- $50,812
- Composite
- 21.31/100
- National rank
- #8384
- State rank
- #108 of 270 in OK
Livability — Slaughterville
- Score
- 63/100
- State rank
- #228
- US rank
- #15883
Category grades
Schools grade is shown separately in the Schools card above.
Census & demographics
- Census place
- Slaughterville, OK
- County
- Cleveland County · 239,547 people
- City population
- 12,003
- Metro
- Oklahoma City, OK
- Population (ZIP)
- 12,258
- Household income
- $73,821
- Rent vs Own
- Severe rent burden
- 301.0
Population outlook (Cleveland County) Hauer SSP2
- Today (2025)
- 323,621 people
- By 2030
- 349,070 · +7.9%
- By 2040
- 400,168 · +23.7%
- By 2050
- 454,101 · +40.3%
- By 2075
- 602,926 · +86.3%
- By 2100
- 734,485 · +127.0%
Race, ethnicity, and origin ACS 2023
- Neighborhood character
- Predominantly White (82%)
- Race & ethnicity
- White 82% Two or more races 8% Hispanic / Latino 5% Native American 5% Black 1%
- Hispanic origin (detail)
- Mexican 4% Puerto Rican 1%
- Common ancestry
- Slovak 3% Lithuanian 2% Italian 2%
- Foreign-born
- 1% · Canada
- Languages at home
- 98% English-only · Spanish 1%
Political lean MEDSL · Cleveland
- 2024 margin
- R (+14.9) · D 41.4% · R 56.4% · Other 2.2%
- 2008→2024 swing
- +9.1pp toward D · 2008: -24.0pp · 2024: -14.9pp
- All cycles
- 2024: R+14.9 2020: R+14.1 2016: R+21.7 2012: R+25.9 2008: R+24.0
Not yet ingested
- Civics
- —
Market trends
- HPI YoY
- ▼ -13.99%
- Current HPI
- 278.428
- Rent YoY
- —
- Metro
- Oklahoma City, OK
- State GDP YoY
- ▲ 1.55%
- F500 in state
- 6
Industry mix (Fortune 500 HQ in OK)
| Industry | F500 HQs | Revenue |
|---|---|---|
| Energy | 3 | $48B |
|
||
Price history
+116.4% since first listed3 events — show timeline
- 2026-05-09 Listed $119,000 MLSOK
- 2010-11-16 Listing Removed — MLSOK
- 2010-10-27 Listed $55,000 MLSOK
Property tax history
+15.4%/yrLatest (2024): $576 · +4.7% YoY. Source: county tax records.
Cash-flow waterfall
monthlySold comps — $/sqft
last 12 mo · ≤1 miLoading sold comps…