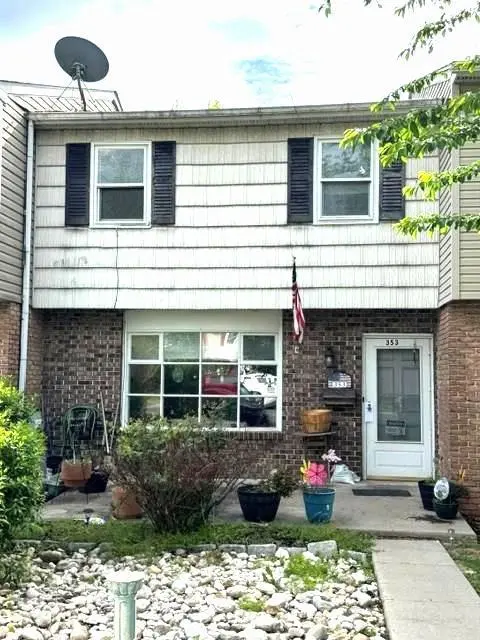
353 Washington St · Pennsburg, PA
Flood risk 1/10 · Minimal
- FEMA flood zone
- X (unshaded)
- Chance of flooding over 30 yrs
- 0.0%
- Est. flood insurance / yr
- $473 – $860
Fire risk 3/10 · Minor
- Est. fire insurance / yr
- $511 – $949
Heat risk 5/10 · Moderate
- Hot days now (above 103°F)
- 7 days/yr
- Hot days in 30 yrs
- 15 days/yr
Wind risk 4/10 · Minor
- Chance of severe wind over 30 yrs
- 21.0%
Air-quality risk 2/10 · Minimal
- Unhealthy air days now
- 1 days/yr
- Unhealthy air days in 30 yrs
- 2 days/yr
Risk factors via First Street. Map © Google.
Why this score? — see what drove the C- grade
The composite is a weighted blend of 9 inputs, each scored 0–100. Each bar is that input's sub-score; the figure is the points it added to the 100-point composite (weight × sub-score).
- Cash flow +20.8/30.0
- ARV discount +7.9/15.0
- DSCR +6.6/10.0
- 1% rule +5.4/10.0
- Schools +4.2/10.0
- Livability +4.2/5.0
- Rent growth +2.5/5.0
- Condition / age +2.5/5.0
- Appreciation +0.0/10.0
$260,000
🖨 Deal sheet 📄 Offer letter ✓ Due diligence
Listing remarks
353 Washington Street is an in-town, middle row home. This home is a great 3 bedroom, 1.5 bath starter home. Conveniently located close to downtown Pennsburg. This home contains a pull down attic and rear covered deck. Being sold "as-is" and requires cosmetic updates.
Key facts
- 2 parking spots
- Built 1972
- Listed 7 days
Property features AI
Exterior
- Parking: Driveway parking (2 spaces); Total of 2 garage/parking spaces
- Utilities: Public water; Public sewer; Electric power
- Home design: Interior townhouse/rowhouse; Fee simple ownership; Estimated year built; Average condition
- Construction: Vinyl siding; Block foundation; Asphalt roof
- Exterior features: Not in a federal flood zone; No tidal water
Interior
- Bedrooms: Three bedrooms on the upper level
- Flooring: Carpet; Vinyl
- Bathrooms: One full bathroom on the upper level; One half bathroom on the main level
- Heating & cooling: Central heating; Electric heating; Electric hot water
- Interior features: Fireplace (1); Full basement; Assessor-listed living area
Neighborhood map
What this means for you Summary
Snapshot
- This is a 3-bed/1.5-bath townhouse listed at $260k.
Deal economics
- At list price, monthly cash flow is $357 ($4k/yr) — positive.
- The deal already cash-flows at list — no discount required.
- Meets the 1% rule at list price ($3k rent vs $260k).
- Cap rate 7.9% vs local median 3.5% in Pennsburg — top-decile yield for the area; either an underpriced asset or a hidden risk that comps aren't pricing in. Stress-test before assuming the spread holds.
Location & tenants
- Location reads 85/100 on livability (#78 in PA, #565 nationally) — a professional / high-income tenant draw. Strengths: crime A+, employment A+, housing A+; Watch: amenities D+, commute F.
- Upper Perkiomen SD (suburban): math 39% / reading 55% proficiency, ranked #189 of 539 in PA (top 35%) — families likely to look elsewhere, expect single-tenant / working-renter base with shorter leases.
- Market conditions: 102 active listings in the ZIP; 1 comparable units currently listed for rent nearby; 1,936 units permitted in Montgomery County in 2024 (530 in 5+ unit buildings).
Forward outlook
- Local home prices are declining (-3.0%/yr); year-one equity from $2k of loan paydown is wiped out by about $8k of value loss. Plan a longer hold.
- Montgomery County population projected at +5% by 2050 — modest demand growth; plan on rents tracking national, not racing it.
Negotiation context
- Only 7 days on market — expect competitive offers; lowballing is unlikely to land.
- Current owner paid $45k; list at $260k implies a 478% gain — meaningful room to come down on a strong offer.
Risks & watch-outs
- Climate carrying-cost: extreme-heat days projected 7→15/yr by 2055 (HVAC capex compounding) — expect insurance premiums to compound above CPI over the hold.
Questions for the listing agent
- Built in 1972 — when were the roof, HVAC, electrical panel, plumbing, and water heater last replaced?
- Is there a deadline driving the sale (1031 exchange, divorce, estate, relocation)? That informs how much negotiation room exists.
- Schools are A-rated — typically a magnet for longer-tenancy family renters. What's the average tenant stay here, and is there a school-zone premium baked into asking?
- What's the average days-on-market for RENTAL listings here right now (not sales)? A rising rental-DOM trend means longer vacancies and softer asking-rent achievability than the comps imply.
- What's the recent tenant-quality profile in this submarket — average credit score on applications, eviction rate, late-payment / NSF rate, and stable-employment percentage? A property-management company in the area should have these aggregated.
- How much new for-sale + rental construction is in the pipeline within 1–3 miles? Heavy new supply typically softens prices + rents 12–24 months out; constrained supply supports both.
Investment metrics
- 1% rule
- 1.04% ✓
- Cap rate
- 7.94%
- Cash-on-cash
- 5.89%
- DSCR
- 1.26
- GRM
- 8.0
CMA / ARV
- ARV (median comp)
- $262,108
- List price
- $260,000
- Delta
- -0.80%
- Verdict
- FAIR
- Comps
- 20 within 1.0 mi
Show comp detail 12 sales within ~0.75 mi
| Address | Dist | Beds/Ba | Sqft | Sold | Price | $/sf | Match |
|---|---|---|---|---|---|---|---|
| 431 Seminary St | 0.12mi | 3/1.5 | 1,280 (0%) | 4mo | $316,000 | $247 | 91 |
| 603 Honeysuckle Way | 0.36mi | 3/1.5 | 1,296 (+1%) | 1mo | $340,000 | $262 | 80 |
| 545 W 6th St | 0.40mi | 3/1.5 | 1,240 (-3%) | 2mo | $341,000 | $275 | 75 |
| 149 Main St | 0.43mi | 3/1.5 | 1,250 (-2%) | 2mo | $297,500 | $238 | 74 |
| 121 Jefferson St | 0.48mi | 3/1.0 | 1,271 (-1%) | 1mo | $250,000 | $197 | 74 |
| 155 Main St | 0.42mi | 2/1.5 (-1) | 1,352 (+6%) | 4mo | $260,000 | $192 | 62 |
| 427 Blaker Dr | 0.71mi | 3/1.5 | 1,160 (-9%) | 3mo | $269,000 | $232 | 48 |
| 327 Jefferson St | 0.68mi | 3/2.0 | 1,394 (+9%) | 4mo | $298,000 | $214 | 48 |
| 421 Blaker Dr | 0.70mi | 3/1.5 | 1,160 (-9%) | 4mo | $255,000 | $220 | 48 |
| 854 Peaceful Ln | 0.68mi | 3/2.5 | 1,433 (+12%) | 1mo | $364,900 | $255 | 43 |
| 876 Still Waters Ln | 0.71mi | 3/2.5 | 1,433 (+12%) | 2mo | $370,000 | $258 | 41 |
| 975 Still Waters Ln | 0.73mi | 3/3.5 | 1,433 (+12%) | 3mo | $367,500 | $256 | 36 |
Match score weights: distance 35% · size 25% · config 20% · recency 20%. Top-matched comps best support the ARV.
Projected returns pro-forma
-3.0% appreciation · 3.0% rent growth · sell at horizon
- IRR
- -7.2%
- Equity multiple
- 0.73×
- Total profit
- $-19,361
- Equity at exit
- $38,767
- IRR
- 2.4%
- Equity multiple
- 1.17×
- Total profit
- $12,539
- Equity at exit
- $22,480
Cash invested: $72,800 (down + closing). Projections, not guarantees.
Landlord ↔ Tenant lean methodology
- Overall (STATE)
- 62 Landlord-Friendly
- State Pennsylvania
- 62 Landlord-Friendly · EVEN
- County
- — inherits STATE
- City
- — inherits STATE
ZIP-level market 18073
- Home prices YoY
- -24.4%
- Active inventory
- 102
- Price-to-rent
- 8.0×
Monthly cashflow live
- Estimated rent
- $2,700 medium interval (Pro) →
- Mortgage (P&I)
- −$1,363
- Tax from tax record
- −$304 /mo · $3,649/yr
- Insurance
- −$108
- HOA
- −$0
- Vacancy / Maint / Mgmt
- −$567
- Net cashflow
- $357
Break-even live
UW: 25.0% down · 7.5% · 30yr · 1.5% tax · 5.0% vac · 8.0% maint · 8.0% mgmt
Financing live
Cash to close
- Down payment
- $65,000
- Closing costs
- $7,800
- Reserves months
- —
- Total cash needed
- —
Loan-product check · same deal, 3 products live
Conventional
25% down · 7.5% · 30yr
- Down + closing
- —
- Monthly P&I
- —
- Monthly cashflow
- —
- DSCR
- —
- Eligible?
- —
Personal DTI + credit; lowest rate.
DSCR
20% down · 8.5% · 30yr
- Down + closing
- —
- Monthly P&I
- —
- Monthly cashflow
- —
- DSCR
- —
- Eligible?
- —
No personal income docs; deal must DSCR.
Hard money
10% down · 12.0% · 12mo
- Down + closing
- —
- Monthly P&I
- —
- Monthly cashflow
- —
- DSCR
- —
- Eligible?
- —
Short-term bridge; refi at stabilization.
Rent comps 1 comps
| Address | Beds | Baths | Sqft | Rent | $/sqft | DOM | Units | Dist |
|---|---|---|---|---|---|---|---|---|
| 3103 Goshen Dr Unit M48 Pennsburg, PA | 3.0 | 2.5 | 1736 | $2,700 | $1.56 | 21d | 1 | 1.25mi |
Listing history 2 events
-
2026-05-14historical $260,000 226-char remark
-
1982-03-18soldstatus $45,000
ⓘ Source: listings_history table (triggers on properties + properties_extension) + one-shot
backfill from property_details.listing_events for pre-trigger history.
Tax reassessment forecast PA · Partial reset (capped growth)
- Current annual tax
- $3,649 · $304/mo
- Projected year-2 tax
- $3,879 · $323/mo
- Expected delta
- +$229/yr (+$19/mo · 6.3%)
ⓘ Screening estimate from a state-policy table — verify with the county assessor before closing.
Climate risk First Street
- Flood 1/10 Low FEMA zone X (unshaded) · 0% chance over 30 yrs
- Wildfire 3/10 Moderate
- Heat 5/10 Major 7 d/yr ≥103°F today · 15 d/yr by 30 yrs out
- Wind 4/10 Moderate 21% chance of damaging wind over 30 yrs
- Air quality 2/10 Low 1 unhealthy d/yr today · 2 by 30 yrs out
Nearby sold comps map
Loading sold comps map…
Walkable amenities ~0.75 mi
Loading nearby amenities…
Taxation est. · year 1
- Rental income
- $32,400
- − Mortgage interest
- −$14,564
- − Property taxes
- −$3,649
- − Insurance
- −$1,300
- − Repairs & maintenance
- −$2,592
- − Management
- −$2,592
- − Depreciation
- −$7,564
- Taxable income
- $139
- Est. tax owed @ 24.0%
- −$33
- After-tax cash flow
- $4,252/yr
For passive investors: Depreciation is non-cash, so a rental often shows a tax loss while cash-flowing — sheltering income. Rental losses are passive: they offset passive income freely, and up to $25,000/yr can offset ordinary (W-2) income if you actively participate and your MAGI is under $100k (phasing out to $0 by $150k); unused losses carry forward. On sale, claimed depreciation is recaptured at up to 25%, and gains may owe capital-gains tax (a 1031 exchange can defer both). Figures are a year-1 estimate at your 24.0% rate — not tax advice; consult a CPA.
Schools (NCES district)
- District
- Upper Perkiomen SD
- NCES district ID
- 4224540
- Math proficiency
- 39% ▼ -13.00%
- Reading proficiency
- 55% ▼ -12.00%
- Median HH income
- $68,322
- Composite
- 41.99/100
- National rank
- #3337
- State rank
- #189 of 539 in PA
Livability — Pennsburg
- Score
- 85/100
- State rank
- #78
- US rank
- #565
Category grades
Schools grade is shown separately in the Schools card above.
Census & demographics
- Census place
- Pennsburg, PA
- Population (ZIP)
- 11,534
Population outlook (Montgomery County) Hauer SSP2
- Today (2025)
- 856,074 people
- By 2030
- 870,887 · +1.7%
- By 2040
- 891,195 · +4.1%
- By 2050
- 896,417 · +4.7%
- By 2075
- 903,212 · +5.5%
- By 2100
- 843,240 · -1.5%
Race, ethnicity, and origin ACS 2023
- Neighborhood character
- Predominantly White (90%)
- Race & ethnicity
- White 90% Hispanic / Latino 5% Two or more races 2% Asian 2% Black 2%
- Common ancestry
- Romanian 7% Polish 3% Slovak 2%
- Foreign-born
- 5% · Canada, Dominican Republic, China
- Languages at home
- 94% English-only · Spanish 4% German/W. Germanic 1% Arabic 1%
Political lean MEDSL · Montgomery
- 2024 margin
- Strong D (+22.8) · D 60.9% · R 38.1% · Other 1.1%
- 2008→2024 swing
- +2.0pp toward D · 2008: 20.8pp · 2024: 22.8pp
- All cycles
- 2024: D+22.8 2020: D+26.3 2016: D+21.1 2012: D+14.3 2008: D+20.8
Not yet ingested
- Civics
- —
Market trends
- HPI YoY
- ▼ -90.64%
- Current HPI
- 280.4219
- Rent YoY
- —
- Metro
- —
- State GDP YoY
- ▲ 1.68%
- F500 in state
- 34
Industry mix (Fortune 500 HQ in PA)
| Industry | F500 HQs | Revenue |
|---|---|---|
| Healthcare | 2 | $309B |
|
||
| Insurance | 2 | $27B |
|
||
| Telecommunications / Media | 1 | $124B |
|
||
| Industrial Distribution | 1 | $22B |
|
||
| Financial Services | 1 | $20B |
|
||
| Chemicals / Materials | 1 | $18B |
|
||
Price history
+477.8% since first listed4 events — show timeline
- 2026-05-27 Pending — BRIGHT MLS
- 2026-05-21 Listed $260,000 BRIGHT MLS
- 2026-05-14 Coming Soon $260,000 BRIGHT MLS
- 1982-03-18 Sold (Public Records) $45,000 Public Records
Property tax history
+2.4%/yrLatest (2026): $3,649 · +1.6% YoY. Source: county tax records.
Cash-flow waterfall
monthlySold comps — $/sqft
last 12 mo · ≤1 miLoading sold comps…