 10-Plex
1432 45th Ave · Oakland, CA
Flood risk 4/10 · Minor
- FEMA flood zone
- X (shaded)
- Chance of flooding over 30 yrs
- 0.22%
- Est. flood insurance / yr
- $507 – $1,088
Fire risk 1/10 · Minimal
- Est. fire insurance / yr
- $659 – $1,223
Heat risk 4/10 · Minor
- Hot days now (above 83°F)
- 7 days/yr
- Hot days in 30 yrs
- 15 days/yr
Wind risk 1/10 · Minimal
- Chance of severe wind over 30 yrs
- —
Air-quality risk 8/10 · Major
- Unhealthy air days now
- 14 days/yr
- Unhealthy air days in 30 yrs
- 14 days/yr
Risk factors via First Street. Map © Google.
Why this score? — see what drove the B+ grade
The composite is a weighted blend of 9 inputs, each scored 0–100. Each bar is that input's sub-score; the figure is the points it added to the 100-point composite (weight × sub-score).
- Cash flow +30.0/30.0
- ARV discount +15.0/15.0
- DSCR +10.0/10.0
- 1% rule +8.5/10.0
- Livability +3.6/5.0
- Rent growth +3.5/5.0
- Schools +3.0/10.0
- Condition / age +2.5/5.0
- Appreciation +0.0/10.0
$1,210,000
🖨 Deal sheet (PDF) 📄 Offer letter ✓ Due diligence
Multi-family units
County records classify this as Multi-Family (5+ Unit). Listing-text estimate: 10 units. confirmed
5+ unit building — per-unit beds/baths from public records are typically unavailable; the breakdown below (if shown) is an estimate from the listing text.
Listing remarks MLS
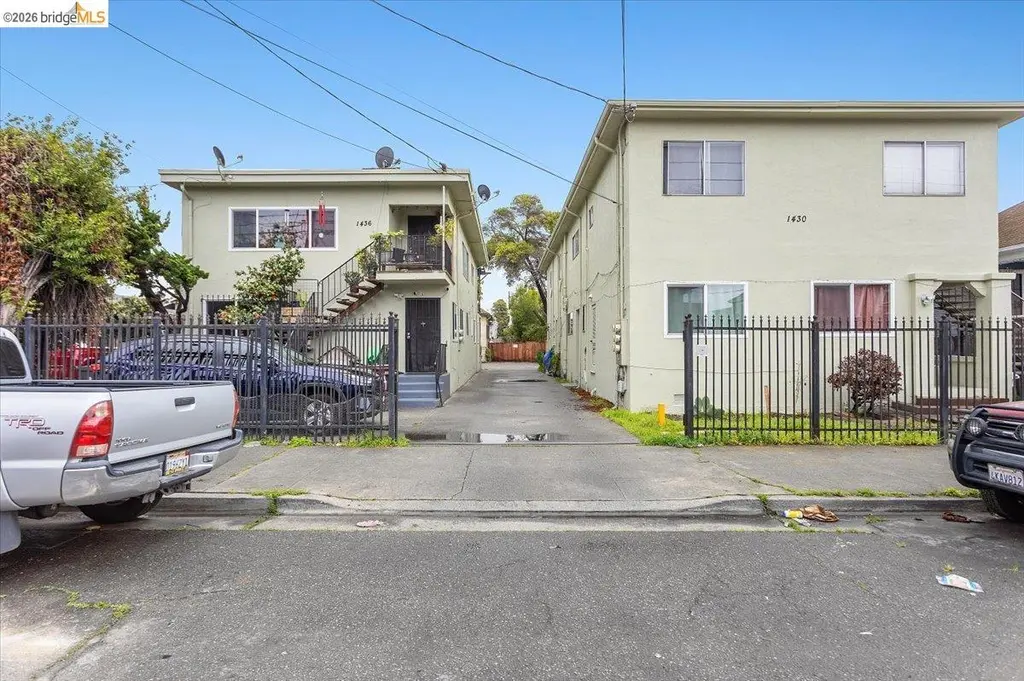
The property is a 10-unit multifamily offering consisting of two separately parceled, adjacent buildings in Oakland’s Fruitvale district. The property includes a 6-unit building and a 4-unit building, presenting a rare opportunity to acquire scale with flexibility for future disposition or financing strategies. The unit mix consists of two 2-bedroom/1-bath units, seven 1-bedroom/1-bath units, and one studio unit, catering to strong local rental demand. The property also features eight off-street parking spaces, providing added convenience for tenants. This is a compelling opportunity to acquire a well-located asset with solid in-place income and long-term upside in one of Oakland’s most transit-connected neighborhoods.
Key facts
- Multifamily offering
- 0.33 acre lot
- Built 1941
Tags
Neighborhood map
What this means for you Summary
Snapshot
- This is a 2×2bd/1ba + 7×1bd/1ba + 1×?bd/1ba units multifamily listed at $1.21M.
Deal economics
- At list price, monthly cash flow is $5k ($60k/yr) — positive. Per door: $501/mo.
- The deal already cash-flows at list — no discount required.
- Meets the 1% rule at list price ($16k rent vs $1.21M).
- Recommended offer: $1.10M (9.0% below list) — sets the bar for market timing.
- Cap rate 11.3% vs local median 2.5% in Oakland — top-decile yield for the area; either an underpriced asset or a hidden risk that comps aren't pricing in. Stress-test before assuming the spread holds.
Location & tenants
- Location reads 71/100 on livability (#224 in CA) — a middle-class / working-renter tenant base. Strengths: amenities A+, commute A+, employment A+; Watch: crime F, cost of living F.
- Oakland Unified (urban): math 27% / reading 33% proficiency, ranked #1,007 of 1,400 in CA (top 72%) — families likely to look elsewhere, expect single-tenant / working-renter base with shorter leases; 68% free/reduced lunch — lower-income household profile, screen leases tightly.
- Zoned schools: Bridges @ Melrose Academy Elementary (414 students, 99% FRL); Fremont High (1,146 students, 97% FRL) — zoned schools average 98% FRL vs 68% district-wide (29 pts higher); higher-poverty schools than district average — tighter screening recommended.
- Market conditions: Rents rising (+3.9%/yr); 119 active listings in the ZIP; 1,742 units permitted in Alameda County in 2024 (856 in 5+ unit buildings).
- At $16,383/mo this rent would consume 272% of the median local household income ($72k/yr) (locally 3603% of renters already pay >50% of income on rent) — very limited rent-growth headroom before tenants either downsize or default.
Forward outlook
- Local home prices are declining (-3.0%/yr); year-one equity from $8k of loan paydown is wiped out by about $36k of value loss. Plan a longer hold.
- Alameda County population projected at +34% by 2050 — long-run rental-demand tailwind backs the buy-and-hold thesis.
- At projected returns (-3.0% appreciation + 3.9% rent growth), your $339k cash investment doubles in ~7 years — after that, you're playing with house money.
Negotiation context
- It's been on market 107 days — a 9% lower offer ($1.10M) is reasonable based on typical stale-listing flexibility.
- 4 sale attempts since 12y ago; this cycle's ask has dropped $85k (7%) from the opening price — seller is motivated, your offer sets the floor, not the list.
- Current owner paid $810k; 49% above their basis — modest negotiation headroom, anchor on the comps not their cost.
Risks & watch-outs
- Watch-outs: built in 1941 — expect roof / HVAC / electrical / plumbing capex.
Questions for the listing agent
- It's been on market 107 days. Have you received any prior offers? Is the seller open to a 9% concession, seller financing, or rate buy-down credit?
- Can we see the unit-by-unit rent roll, current vacancy, and any below-market leases? What's the average tenancy length?
- What capital expenditures (roof, boiler, parking lot, exteriors) have been made in the last 5 years, and what's planned in the next 2?
- Built in 1941 — when were the roof, HVAC, electrical panel, plumbing, and water heater last replaced?
- Why hasn't it sold? Are there any deal-killer items the seller is aware of (foundation, flood, title, zoning, code violations)?
- Is there a deadline driving the sale (1031 exchange, divorce, estate, relocation)? That informs how much negotiation room exists.
- Crime grade is F in this area — have there been break-ins, vandalism, or insurance claims at this property in the last 3 years? What carrier currently insures it and at what premium?
- What's the average days-on-market for RENTAL listings here right now (not sales)? A rising rental-DOM trend means longer vacancies and softer asking-rent achievability than the comps imply.
- What's the recent tenant-quality profile in this submarket — average credit score on applications, eviction rate, late-payment / NSF rate, and stable-employment percentage? A property-management company in the area should have these aggregated.
- How much new apartment / multifamily construction is in the pipeline within 1–3 miles? Heavy new supply (>2% of stock underway) typically softens rents 12–24 months out; light construction supports rent growth.
Investment metrics
- 1% rule
- 1.35% ✓
- Cap rate
- 11.26%
- Cash-on-cash
- 17.73%
- DSCR
- 1.79
- GRM
- 6.2
CMA / ARV
- ARV (median comp)
- $1,630,195
- List price
- $1,210,000
- Delta
- -25.78%
- Verdict
- UNDERPRICED
- Comps
- 2 within 1.0 mi
Projected returns pro-forma
-3.0% appreciation · 3.89% rent growth · sell at horizon
- IRR
- 10.2%
- Equity multiple
- 1.41×
- Total profit
- $137,501
- Equity at exit
- $180,415
- IRR
- 20.0%
- Equity multiple
- 2.75×
- Total profit
- $592,008
- Equity at exit
- $104,619
Cash invested: $338,800 (down + closing). Projections, not guarantees.
Landlord ↔ Tenant lean methodology
- Overall (CITY)
- 0 Strongly Tenant-Friendly
- State California
- 18 Strongly Tenant-Friendly · D+13
- County
- — inherits STATE
- City Oakland
- 0 Strongly Tenant-Friendly · D+62
ZIP-level market 94601
- Rents YoY
- 3.9%
- Active inventory
- 119
- Price-to-rent
- 54.1×
Monthly cashflow live
- Estimated rent
- $16,383 medium interval (Pro) →
- Mortgage (P&I)
- −$6,345
- Tax from tax record
- −$1,088 /mo · $13,054/yr
- Insurance
- −$504
- HOA
- −$0
- Vacancy / Maint / Mgmt
- −$3,440
- Net cashflow
- $5,005
Break-even live
Sensitivity live
| Price | -10% $5,690 | -5% $5,348 | +0% $5,005 | +5% $4,663 | +10% $4,320 |
|---|---|---|---|---|---|
| Rent | -10% $3,711 | -5% $4,358 | +0% $5,005 | +5% $5,652 | +10% $6,299 |
| Rate | -1.0pp $5,615 | -0.5pp $5,313 | base $5,005 | +0.5pp $4,692 | +1.0pp $4,373 |
10-unit breakdown (identical units grouped — click to expand)
| Units | Beds | Baths | Est. rent |
|---|---|---|---|
| 2× units | 2 | 1 | $3,728 |
| #1 | 2 | 1 | $1,864 |
| #2 | 2 | 1 | $1,864 |
| 7× units | 1 | 1 | $11,102 |
| #3 | 1 | 1 | $1,586 |
| #4 | 1 | 1 | $1,586 |
| #5 | 1 | 1 | $1,586 |
| #6 | 1 | 1 | $1,586 |
| #7 | 1 | 1 | $1,586 |
| #8 | 1 | 1 | $1,586 |
| #9 | 1 | 1 | $1,586 |
| 1× unit | 0 | 1 | $1,554 |
| Total (10 units) | $16,383 | ||
UW: 25.0% down · 7.5% · 30yr · 1.5% tax · 5.0% vac · 8.0% maint · 8.0% mgmt
Financing live
Cash to close
- Down payment
- $302,500
- Closing costs
- $36,300
- Reserves months
- —
- Total cash needed
- —
Loan-product check · same deal, 3 products live
Conventional
25% down · 7.5% · 30yr
- Down + closing
- —
- Monthly P&I
- —
- Monthly cashflow
- —
- DSCR
- —
- Eligible?
- —
Personal DTI + credit; lowest rate.
DSCR
20% down · 8.5% · 30yr
- Down + closing
- —
- Monthly P&I
- —
- Monthly cashflow
- —
- DSCR
- —
- Eligible?
- —
No personal income docs; deal must DSCR.
Hard money
10% down · 12.0% · 12mo
- Down + closing
- —
- Monthly P&I
- —
- Monthly cashflow
- —
- DSCR
- —
- Eligible?
- —
Short-term bridge; refi at stabilization.
Listing history 22 events
-
2026-06-21days on market $1,210,000 Active 107 DOM
-
2026-06-18days on market $1,210,000 Active 104 DOM
-
2026-06-17days on market $1,210,000 Active 103 DOM
-
2026-06-16days on market $1,210,000 Active 102 DOM
-
2026-06-15days on market $1,210,000 Active 101 DOM
-
2026-06-13days on market $1,210,000 Active 99 DOM
-
2026-06-13days on market $1,210,000 Active 98 DOM
-
2026-06-09days on market $1,210,000 Active 95 DOM
-
2026-06-08days on market $1,210,000 Active 94 DOM
-
2026-06-07days on market $1,210,000 Active 93 DOM
-
2026-06-04days on market $1,210,000 Active 90 DOM
-
2026-06-03days on market $1,210,000 Active 89 DOM
-
2026-06-02days on market $1,210,000 Active 88 DOM
-
2026-06-01days on market $1,210,000 Active 87 DOM
-
2026-05-31days on market $1,210,000 Active 86 DOM
-
2026-03-06$1,295,000 Active 740-char remark
Show marketing remark (740 chars)
The property is a 10-unit multifamily offering consisting of two separately parceled, adjacent buildings in Oakland’s Fruitvale district. The property includes a 6-unit building and a 4-unit building, presenting a rare opportunity to acquire scale with flexibility for future disposition or financing strategies. The unit mix consists of two 2-bedroom/1-bath units, seven 1-bedroom/1-bath units, and one studio unit, catering to strong local rental demand. The property also features eight off-street parking spaces, providing added convenience for tenants. This is a compelling opportunity to acquire a well-located asset with solid in-place income and long-term upside in one of Oakland’s most transit-connected neighborhoods.
-
2024-10-08$1,495,000 Active
-
2014-06-27soldstatus $810,000
-
2014-06-27soldstatus $810,000
-
2014-06-27soldstatus $810,000
-
2014-04-01$819,000
-
2014-04-01$819,000
ⓘ Source: listings_history table (triggers on properties + properties_extension) + one-shot
backfill from property_details.listing_events for pre-trigger history.
Tax reassessment forecast CA · Resets to sale price
- Current annual tax
- $13,054 · $1,088/mo
- Projected year-2 tax
- $13,054 · $1,088/mo
- Expected delta
- $0/yr ($0/mo · 0.0%)
ⓘ Screening estimate from a state-policy table — verify with the county assessor before closing.
Climate risk First Street
- Flood 4/10 Moderate FEMA zone X (shaded) · 22% chance over 30 yrs
- Wildfire 1/10 Low
- Heat 4/10 Moderate 7 d/yr ≥83°F today · 15 d/yr by 30 yrs out
- Wind 1/10 Low
- Air quality 8/10 Severe 14 unhealthy d/yr today · 14 by 30 yrs out
Nearby sold comps map
Loading sold comps map…
Walkable amenities ~0.75 mi
Loading nearby amenities…
Taxation est. · year 1
- Rental income
- $196,596
- − Mortgage interest
- −$67,779
- − Property taxes
- −$13,054
- − Insurance
- −$6,050
- − Repairs & maintenance
- −$15,728
- − Management
- −$15,728
- − Depreciation
- −$35,200
- Taxable income
- $43,058
- Est. tax owed @ 24.0%
- −$10,334
- After-tax cash flow
- $49,729/yr
For passive investors: Depreciation is non-cash, so a rental often shows a tax loss while cash-flowing — sheltering income. Rental losses are passive: they offset passive income freely, and up to $25,000/yr can offset ordinary (W-2) income if you actively participate and your MAGI is under $100k (phasing out to $0 by $150k); unused losses carry forward. On sale, claimed depreciation is recaptured at up to 25%, and gains may owe capital-gains tax (a 1031 exchange can defer both). Figures are a year-1 estimate at your 24.0% rate — not tax advice; consult a CPA.
Schools (NCES district)
- District
- Oakland Unified
- NCES district ID
- 0628050
- Math proficiency
- 27% ▬ 0.00%
- Reading proficiency
- 33% ▬ 0.00%
- Median HH income
- $55,194
- Composite
- 29.52/100
- National rank
- #11769
- State rank
- #1007 of 1400 in CA
Livability — Oakland
- Score
- 71/100
- State rank
- #224
- US rank
- #7245
Category grades
Schools grade is shown separately in the Schools card above.
Census & demographics
- Census place
- Oakland, CA
- County
- Alameda County · 1,614,355 people
- City population
- 385,993
- Metro
- San Francisco-Oakland-Berkeley, CA
- Population (ZIP)
- 53,259
- Household income
- $72,359
- Rent vs Own
- Severe rent burden
- 3603.0
Population outlook (Alameda County) Hauer SSP2
- Today (2025)
- 1,928,884 people
- By 2030
- 2,069,146 · +7.3%
- By 2040
- 2,338,405 · +21.2%
- By 2050
- 2,586,608 · +34.1%
- By 2075
- 3,061,911 · +58.7%
- By 2100
- 3,234,133 · +67.7%
Race, ethnicity, and origin ACS 2023
- Neighborhood character
- Diverse neighborhood (Simpson 0.66)
- Race & ethnicity
- Hispanic / Latino 53% Asian 18% Black 13% White 11% Two or more races 10% Native American 3%
- Hispanic origin (detail)
- Mexican 35%
- Common ancestry
- Italian 1% Scotch-Irish 1%
- Foreign-born
- 40% · Canada, Vietnam, China
- Languages at home
- 35% English-only · Spanish 46% Chinese 5% Vietnamese 4%
Political lean MEDSL · Alameda
- 2024 margin
- Solid D (+53.6) · D 74.6% · R 21.0% · Other 4.4%
- 2008→2024 swing
- -5.9pp toward R · 2008: 59.5pp · 2024: 53.6pp
- All cycles
- 2024: D+53.6 2020: D+62.5 2016: D+64.4 2012: D+59.8 2008: D+59.5
Not yet ingested
- Civics
- —
Market trends
- HPI YoY
- ▼ -1045.52%
- Current HPI
- 347.3256
- Rent YoY
- ▲ 3.89%
- Metro
- San Francisco-Oakland-Berkeley, CA
- State GDP YoY
- ▲ 3.21%
- F500 in state
- 116
Industry mix (Fortune 500 HQ in CA)
| Industry | F500 HQs | Revenue |
|---|---|---|
| Technology | 27 | $1,492B |
|
||
| Financial Services | 3 | $174B |
|
||
| Retail | 3 | $44B |
|
||
| Insurance | 3 | $26B |
|
||
| Media / Entertainment | 2 | $115B |
|
||
| Pharmaceuticals / Biotech | 2 | $62B |
|
||
Price history
+58.1% since first listed7 events — show timeline
- 2026-03-06 Listed $1,295,000 bridgeMLS, Bay East AOR, or Contra Costa AOR
- 2024-10-08 Listed $1,495,000 San Francisco MLS
- 2014-06-27 Sold (Public Records) $810,000 Public Records
- 2014-06-27 Sold (MLS) $810,000 SDMLS
- 2014-06-27 Sold (MLS) $810,000 bridgeMLS, Bay East AOR, or Contra Costa AOR
- 2014-04-01 Listed $819,000 SDMLS
- 2014-04-01 Listed $819,000 bridgeMLS, Bay East AOR, or Contra Costa AOR
Property tax history
+4.9%/yrLatest (2025): $13,054 · +5.0% YoY. Source: county tax records.
Cash-flow waterfall
monthlySold comps — $/sqft
last 12 mo · ≤1 miLoading sold comps…