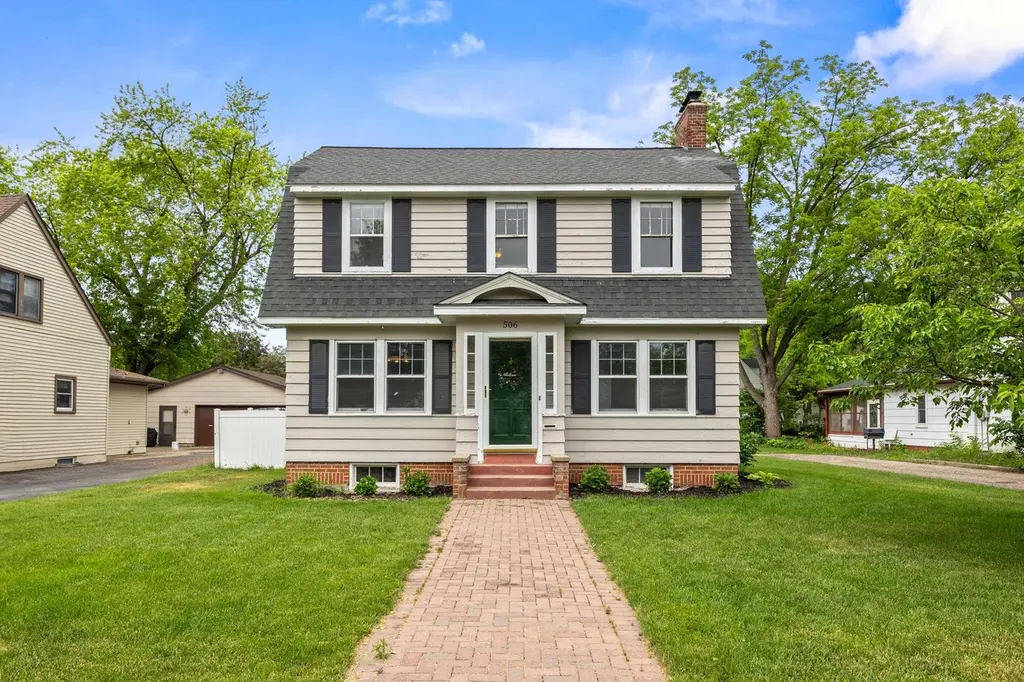
506 Lynn Rd SW · Hutchinson, MN
Flood risk 1/10 · Minimal
- FEMA flood zone
- X (unshaded)
- Chance of flooding over 30 yrs
- 0.0%
- Est. flood insurance / yr
- $473 – $860
Fire risk 1/10 · Minimal
- Est. fire insurance / yr
- $888 – $1,650
Heat risk 2/10 · Minimal
- Hot days now (above 99°F)
- 7 days/yr
- Hot days in 30 yrs
- 14 days/yr
Wind risk 2/10 · Minimal
- Chance of severe wind over 30 yrs
- —
Air-quality risk 2/10 · Minimal
- Unhealthy air days now
- 2 days/yr
- Unhealthy air days in 30 yrs
- 2 days/yr
Risk factors via First Street. Map © Google.
Why this score? — see what drove the F grade
The composite is a weighted blend of 9 inputs, each scored 0–100. Each bar is that input's sub-score; the figure is the points it added to the 100-point composite (weight × sub-score).
- Cash flow +8.2/30.0
- ARV discount +7.5/15.0
- Schools +4.8/10.0
- Livability +4.0/5.0
- Rent growth +2.5/5.0
- Condition / age +2.5/5.0
- DSCR +2.2/10.0
- 1% rule +2.1/10.0
- Appreciation +0.0/10.0
$230,000
🖨 Deal sheet (PDF) 📄 Offer letter ✓ Due diligence
Listing remarks MLS
SW Hutchinson 2 story home features granite counters, front porch, hardwood floors and 3 bedrooms on one level. Deck overlooks back yard. Oversized one stall garage.
Key facts
- 9,504 sq ft lot
- Garage
- Built 1940
Property features AI
Exterior
- Parking: Asphalt driveway; 1-car garage (17x20)
- Utilities: City water (in street); City sewer (in street); 200+ amp electrical service with circuit breakers; Natural gas
- Home design: Residential property; Two levels
- Construction: Concrete construction; Block foundation
- Exterior features: Deck; Wood exterior; Vinyl and wood fencing; Light tree coverage; City street frontage, public maintained road
Interior
- Kitchen: Kitchen with window; Range; Microwave; Dishwasher; Refrigerator
- Bedrooms: Three bedrooms (upper level); Office on lower level
- Flooring: Hardwood floors
- Bathrooms: One full bath (upper level); One half bath
- Heating & cooling: Forced air heating; Central air conditioning
- Interior features: Finished basement with daylight/lookout windows and sump pump; Informal dining area; Sun room; Hardwood floors; Two decorative wood-burning fireplaces; 3 bedrooms on one level
- Laundry & utility: Laundry room in basement; Washer and dryer included; Electric dryer hookup; Gas water heater
Neighborhood map
What this means for you Summary
Snapshot
- This is a 3-bed/3.0-bath single-family listed at $230k.
Deal economics
- At list price, monthly cash flow is $-219 ($-3k/yr) — negative.
- To cash-flow at today's rent, offer at most $191k (16.8% below list).
- To meet the 1% rule (rent ≥ 1% of price), the offer needs to be $163k (29.2% below list).
- Recommended offer: $163k (29.2% below list) — sets the bar for 1% rule.
- Cap rate 5.1% vs local median 3.1% in Hutchinson — top-decile yield for the area; either an underpriced asset or a hidden risk that comps aren't pricing in. Stress-test before assuming the spread holds.
Location & tenants
- Location reads 80/100 on livability (#72 in MN, #1,744 nationally) — a professional / high-income tenant draw. Strengths: cost of living A+, housing A+, health & safety A+; Watch: commute F.
- Hutchinson Public School District (town): math 56% / reading 56% proficiency, ranked #62 of 301 in MN (top 21%) — acceptable for families but not a draw, mixed tenant base, ~2y average lease.
- Zoned schools: Hutchinson West Elementary (426 students, 42% FRL); Hutchinson Middle (math 53% / reading 59%, grade B-, #41 of 258 statewide, top 16%, 565 students, 37% FRL); Hutchinson Senior High (math 52% / reading 62%, grade C, #64 of 471 statewide, top 16%, 908 students, 31% FRL).
- Market conditions: 115 active listings in the ZIP; 4 comparable units currently listed for rent nearby; rentals lingering (median 46d on market — plan ~5-8 weeks vacancy on turnover, expect pricing pressure); 100% of comp listings sitting > 30 days — soft ceiling on asking rent; 57 units permitted in McLeod County in 2024 (0 in 5+ unit buildings).
Forward outlook
- Local home prices are declining (-3.0%/yr); year-one equity from $2k of loan paydown is wiped out by about $7k of value loss. Plan a longer hold.
- McLeod County population projected at -20% by 2050 — secular population decline; favor cash flow + early exit over multi-decade hold.
Negotiation context
- Only 2 days on market — expect competitive offers; lowballing is unlikely to land.
- 4 sale attempts since 29y ago; this cycle's ask is 21% above the opening price — seller raised mid-cycle; expect resistance to lowballs.
- Current owner paid $190k; 21% above their basis — modest negotiation headroom, anchor on the comps not their cost.
Risks & watch-outs
- Watch-outs: built in 1940 — expect roof / HVAC / electrical / plumbing capex.
Questions for the listing agent
- What do current leases actually rent for vs. the listed asking? Can we see a recent rent roll and the last 12 months of T-12 income?
- Built in 1940 — when were the roof, HVAC, electrical panel, plumbing, and water heater last replaced?
- Is there a deadline driving the sale (1031 exchange, divorce, estate, relocation)? That informs how much negotiation room exists.
- Schools are B-rated — typically a magnet for longer-tenancy family renters. What's the average tenant stay here, and is there a school-zone premium baked into asking?
- The area grade is low — what's the realistic commute time and amenity access for the typical tenant pool here? Any planned neighborhood developments (good or bad) we should know about?
- What's the average days-on-market for RENTAL listings here right now (not sales)? A rising rental-DOM trend means longer vacancies and softer asking-rent achievability than the comps imply.
- What's the recent tenant-quality profile in this submarket — average credit score on applications, eviction rate, late-payment / NSF rate, and stable-employment percentage? A property-management company in the area should have these aggregated.
- How much new for-sale + rental construction is in the pipeline within 1–3 miles? Heavy new supply typically softens prices + rents 12–24 months out; constrained supply supports both.
Investment metrics
- 1% rule
- 0.71% ✗
- Cap rate
- 5.15%
- Cash-on-cash
- -4.09%
- DSCR
- 0.82
- GRM
- 11.8
CMA / ARV
No comps found within radius.
Projected returns pro-forma
-3.0% appreciation · 3.0% rent growth · sell at horizon
- IRR
- -23.2%
- Equity multiple
- 0.20×
- Total profit
- $-51,260
- Equity at exit
- $34,294
- IRR
- -17.9%
- Equity multiple
- 0.03×
- Total profit
- $-62,724
- Equity at exit
- $19,886
Cash invested: $64,400 (down + closing). Projections, not guarantees.
Landlord ↔ Tenant lean methodology
- Overall (STATE)
- 46 Balanced
- State Minnesota
- 46 Balanced · D+2
- County
- — inherits STATE
- City
- — inherits STATE
ZIP-level market 55350
- Home prices YoY
- -30.6%
- Active inventory
- 115
- Price-to-rent
- 11.8×
Monthly cashflow live
- Estimated rent
- $1,629 medium interval (Pro) →
- Mortgage (P&I)
- −$1,206
- Tax from tax record
- −$204 /mo · $2,450/yr
- Insurance
- −$96
- HOA
- −$0
- Vacancy / Maint / Mgmt
- −$342
- Net cashflow
- $-219
Break-even live
Sensitivity live
| Price | -10% $-89 | -5% $-154 | +0% $-219 | +5% $-284 | +10% $-349 |
|---|---|---|---|---|---|
| Rent | -10% $-348 | -5% $-284 | +0% $-219 | +5% $-155 | +10% $-91 |
| Rate | -1.0pp $-103 | -0.5pp $-161 | base $-219 | +0.5pp $-279 | +1.0pp $-339 |
UW: 25.0% down · 7.5% · 30yr · 1.5% tax · 5.0% vac · 8.0% maint · 8.0% mgmt
Financing live
Cash to close
- Down payment
- $57,500
- Closing costs
- $6,900
- Reserves months
- —
- Total cash needed
- —
Loan-product check · same deal, 3 products live
Conventional
25% down · 7.5% · 30yr
- Down + closing
- —
- Monthly P&I
- —
- Monthly cashflow
- —
- DSCR
- —
- Eligible?
- —
Personal DTI + credit; lowest rate.
DSCR
20% down · 8.5% · 30yr
- Down + closing
- —
- Monthly P&I
- —
- Monthly cashflow
- —
- DSCR
- —
- Eligible?
- —
No personal income docs; deal must DSCR.
Hard money
10% down · 12.0% · 12mo
- Down + closing
- —
- Monthly P&I
- —
- Monthly cashflow
- —
- DSCR
- —
- Eligible?
- —
Short-term bridge; refi at stabilization.
Rent comps 4 comps
| Address | Beds | Baths | Sqft | Rent | $/sqft | DOM | Units | Dist |
|---|---|---|---|---|---|---|---|---|
| 550 Lincoln Ave SW Hutchinson, MN | 2.0 | 2.0 | 1800 | $1,875 | $1.04 | 45d | 1 | 0.40mi |
| 235 Echo Cir SE Unit 211 Hutchinson, MN | 2.0 | 1.0 | 1000 | $1,250 | $1.25 | 45d | 1 | 0.63mi |
| 1220 Sunset St SW Hutchinson, MN | 2.0 | 2.0 | 1230 | $1,675 | $1.36 | 45d | 1 | 0.78mi |
| 1035 Texas Ave NW Hutchinson, MN | 1.0–3.0 | 1.0–1.5 | 1010 | $1,545 | $1.53 | 45d | 1 | 1.00mi |
Listing history 5 events
-
2026-06-09statusdays on market $230,000 Pending 2 DOM
-
2026-06-08statusdays on market $230,000 Active 1 DOM
-
2026-06-07days on market $230,000 Coming Soon 2 DOM
-
2026-06-07remarks 699-char remark
-
2026-06-07$230,000 Coming Soon 1 DOM
ⓘ Source: listings_history table (triggers on properties + properties_extension) + one-shot
backfill from property_details.listing_events for pre-trigger history.
Tax reassessment forecast MN · Partial reset (capped growth)
- Current annual tax
- $2,450 · $204/mo
- Projected year-2 tax
- $2,513 · $209/mo
- Expected delta
- +$63/yr (+$5/mo · 2.6%)
ⓘ Screening estimate from a state-policy table — verify with the county assessor before closing.
Climate risk First Street
- Flood 1/10 Low FEMA zone X (unshaded) · 0% chance over 30 yrs
- Wildfire 1/10 Low
- Heat 2/10 Low 7 d/yr ≥99°F today · 14 d/yr by 30 yrs out
- Wind 2/10 Low
- Air quality 2/10 Low 2 unhealthy d/yr today · 2 by 30 yrs out
Nearby sold comps map
Loading sold comps map…
Walkable amenities ~0.75 mi
Loading nearby amenities…
Taxation est. · year 1
- Rental income
- $19,548
- − Mortgage interest
- −$12,884
- − Property taxes
- −$2,450
- − Insurance
- −$1,150
- − Repairs & maintenance
- −$1,564
- − Management
- −$1,564
- − Depreciation
- −$6,691
- Taxable loss
- −$6,754
- Est. tax savings @ 24.0%
- +$1,621
- After-tax cash flow
- $-1,010/yr
For passive investors: Depreciation is non-cash, so a rental often shows a tax loss while cash-flowing — sheltering income. Rental losses are passive: they offset passive income freely, and up to $25,000/yr can offset ordinary (W-2) income if you actively participate and your MAGI is under $100k (phasing out to $0 by $150k); unused losses carry forward. On sale, claimed depreciation is recaptured at up to 25%, and gains may owe capital-gains tax (a 1031 exchange can defer both). Figures are a year-1 estimate at your 24.0% rate — not tax advice; consult a CPA.
Schools (NCES district)
- District
- Hutchinson Public School District
- NCES district ID
- 2714970
- Math proficiency
- 56% ▼ -9.00%
- Reading proficiency
- 56% ▼ -10.00%
- Median HH income
- $56,261
- Composite
- 48.36/100
- National rank
- #2143
- State rank
- #62 of 301 in MN
Livability — Hutchinson
- Score
- 80/100
- State rank
- #72
- US rank
- #1744
Category grades
Schools grade is shown separately in the Schools card above.
Census & demographics
- Census place
- Hutchinson, MN
- City population
- 18,567
- Population (ZIP)
- 18,567
Population outlook (McLeod County) Hauer SSP2
- Today (2025)
- 34,517 people
- By 2030
- 33,442 · -3.1%
- By 2040
- 30,815 · -10.7%
- By 2050
- 27,695 · -19.8%
- By 2075
- 21,923 · -36.5%
- By 2100
- 17,237 · -50.1%
Race, ethnicity, and origin ACS 2023
- Neighborhood character
- Predominantly White (91%)
- Race & ethnicity
- White 91% Hispanic / Latino 4% Two or more races 3%
- Common ancestry
- Portuguese 13% Romanian 4% Lithuanian 2%
- Foreign-born
- 3% · Canada, China
- Languages at home
- 96% English-only · Spanish 2% Chinese 1%
Political lean MEDSL · McLeod
- 2024 margin
- Solid R (+38.0) · D 30.2% · R 68.1% · Other 1.7%
- 2008→2024 swing
- -19.6pp toward R · 2008: -18.3pp · 2024: -38.0pp
- All cycles
- 2024: R+38.0 2020: R+36.2 2016: R+38.4 2012: R+22.2 2008: R+18.3
Not yet ingested
- Civics
- —
Market trends
- HPI YoY
- ▼ -89.48%
- Current HPI
- 203.0298
- Rent YoY
- —
- Metro
- —
- State GDP YoY
- ▲ 2.41%
- F500 in state
- 34
Industry mix (Fortune 500 HQ in MN)
| Industry | F500 HQs | Revenue |
|---|---|---|
| Healthcare | 2 | $407B |
|
||
| Retail | 2 | $150B |
|
||
| Consumer Goods | 2 | $32B |
|
||
| Industrial Machinery | 2 | $6B |
|
||
| Agriculture | 1 | $40B |
|
||
| Healthcare / Medical Devices | 1 | $32B |
|
||
Price history
+130.2% since first listed15 events — show timeline
- 2026-06-05 Coming Soon $230,000 NORTHSTARMLS as Distributed by MLS Grid
- 2021-10-05 Sold (Public Records) $189,900 Public Records
- 2021-10-05 Sold (MLS) $189,900 NORTHSTARMLS as Distributed by MLS Grid
- 2021-09-03 Pending — NORTHSTARMLS as Distributed by MLS Grid
- 2021-08-26 Contingent — NORTHSTARMLS as Distributed by MLS Grid
- 2021-08-23 Listed $189,900 NORTHSTARMLS as Distributed by MLS Grid
- 2012-04-10 Sold (MLS) $34,900 NORTHSTARMLS as Distributed by MLS Grid
- 2012-01-13 Listing Removed — NORTHSTARMLS as Distributed by MLS Grid
- 2011-10-24 Listed $34,900 NORTHSTARMLS as Distributed by MLS Grid
- 1999-05-25 Sold (MLS) $112,000 NORTHSTARMLS as Distributed by MLS Grid
- 1999-04-20 Listing Removed — NORTHSTARMLS as Distributed by MLS Grid
- 1999-02-02 Listed $112,500 NORTHSTARMLS as Distributed by MLS Grid
- 1997-12-02 Sold (MLS) $99,900 NORTHSTARMLS as Distributed by MLS Grid
- 1997-10-06 Listing Removed — NORTHSTARMLS as Distributed by MLS Grid
- 1997-09-21 Listed $99,900 NORTHSTARMLS as Distributed by MLS Grid
Property tax history
+2.8%/yrLatest (2026): $2,450 · -0.6% YoY. Source: county tax records.
Cash-flow waterfall
monthlySold comps — $/sqft
last 12 mo · ≤1 miLoading sold comps…