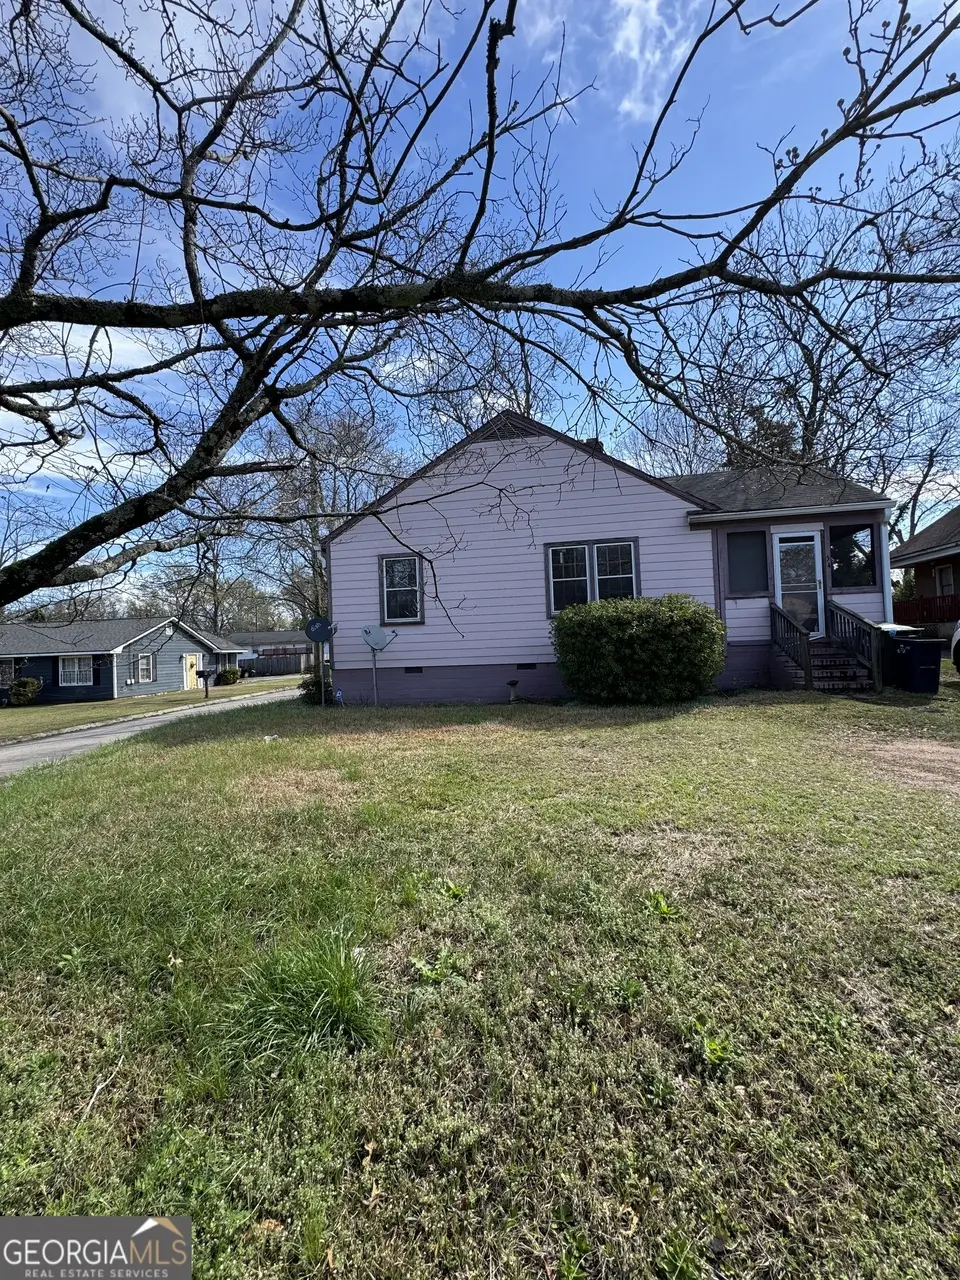
548 N Hill St · Griffin, GA
Flood risk 1/10 · Minimal
- FEMA flood zone
- X (unshaded)
- Chance of flooding over 30 yrs
- 0.0%
- Est. flood insurance / yr
- $507 – $1,088
Fire risk 3/10 · Minor
- Est. fire insurance / yr
- $963 – $1,789
Heat risk 6/10 · Moderate
- Hot days now (above 105°F)
- 7 days/yr
- Hot days in 30 yrs
- 18 days/yr
Wind risk 6/10 · Moderate
- Chance of severe wind over 30 yrs
- 43.0%
Air-quality risk 4/10 · Minor
- Unhealthy air days now
- 4 days/yr
- Unhealthy air days in 30 yrs
- 5 days/yr
Risk factors via First Street. Map © Google.
Why this score? — see what drove the B grade
The composite is a weighted blend of 9 inputs, each scored 0–100. Each bar is that input's sub-score; the figure is the points it added to the 100-point composite (weight × sub-score).
- Cash flow +29.9/30.0
- ARV discount +15.0/15.0
- DSCR +10.0/10.0
- 1% rule +7.9/10.0
- Rent growth +3.3/5.0
- Livability +2.7/5.0
- Condition / age +2.5/5.0
- Schools +1.4/10.0
- Appreciation +0.0/10.0
$99,900
🖨 Deal sheet 📄 Offer letter ✓ Due diligence
Listing remarks
Investor special!! 3BR/2BA ranch on fenced corner lot with great potential. Spacious one level floor plan and large fenced back yard. Located in an area experiencing continued growth and development, including nearby new construction apartments and new construction rental homes, making this an excellent opportunity for investors, rental income or renovations. Property sold As-Is. Owner is a licensed real estate broker.
Key facts
- Fenced corner lot
- 7,405 sq ft lot
- Built 1949
Tags
Property features AI
Finance
- Other: Lot approximately 0.17 acre (city lot); Listing broker: P.B.S. Realty Company
- Financial info: Listed As Is; agent owned / agent/seller relationship; investor owned
- HOA & community: No association
Exterior
- Parking: Parking pad with open parking available
- Utilities: Public water; Public sewer; Electricity available; Natural gas available; Cable available; Sewer connected; Water available
- Home design: Single-family residential house; Built in 1949; Corner city lot
- Construction: Press board construction; Block foundation
- Exterior features: Back yard; Chain-link fencing; Composition roof
Interior
- Kitchen: No appliances listed
- Bedrooms: Three bedrooms on the main level
- Flooring: Laminate flooring
- Bathrooms: Two full bathrooms on the main level
- Heating & cooling: Heating present (type listed as Other); Ceiling fan(s); Window unit(s)
- Interior features: One-level living; Family room; Separate dining room; Crawl space foundation; Has fireplace (1) with unspecified type
- Laundry & utility: Laundry closet
Neighborhood map
What this means for you Summary
Snapshot
- This is a 3-bed/2.0-bath single-family listed at $100k.
Deal economics
- At list price, monthly cash flow is $369 ($4k/yr) — positive.
- The deal already cash-flows at list — no discount required.
- Meets the 1% rule at list price ($1k rent vs $100k).
- Recommended offer: $98k (1.5% below list) — sets the bar for market timing.
- Cap rate 10.7% vs local median 4.3% in Griffin — top-decile yield for the area; either an underpriced asset or a hidden risk that comps aren't pricing in. Stress-test before assuming the spread holds.
Location & tenants
- Location reads 54/100 on livability (#529 in GA) — a working-class tenant base; expect higher turnover. Strengths: cost of living A+, housing A+; Watch: crime F, amenities F, commute F.
- Griffin-Spalding County (suburban): math 13% / reading 19% proficiency, ranked #151 of 174 in GA (top 87%) — low school quality limits family demand, transient renter base, plan for 1-2y turnover; 68% free/reduced lunch — lower-income household profile, screen leases tightly.
- Zoned schools: Moore Elementary School (math 2% / reading 2%, grade F, #1,204 of 1,228 statewide, top 100%, 386 students, 98% FRL); Kennedy Road Middle School (math 11% / reading 20%, grade F, #392 of 470 statewide, top 84%, 477 students, 98% FRL); Griffin High School (math 7% / reading 19%, grade F, #331 of 424 statewide, top 78%, 1,498 students, 98% FRL) — zoned schools average 98% FRL vs 68% district-wide (30 pts higher); higher-poverty schools than district average — tighter screening recommended.
- Market conditions: Rents rising (+3.3%/yr); 427 active listings in the ZIP; 40 comparable units currently listed for rent nearby; rentals at typical pace (median 24d on market — plan ~3-4 weeks tenant-placement turnaround); 40% of comp listings sitting > 30 days — soft ceiling on asking rent; 342 units permitted in Spalding County in 2024 (0 in 5+ unit buildings).
Forward outlook
- Local home prices are declining (-3.0%/yr); year-one equity from $691 of loan paydown is wiped out by about $3k of value loss. Plan a longer hold.
- Spalding County population projected at -15% by 2050 — secular population decline; favor cash flow + early exit over multi-decade hold.
- At projected returns (-3.0% appreciation + 3.3% rent growth), your $28k cash investment doubles in ~8 years — after that, you're playing with house money.
Negotiation context
- It's been on market 21 days — a 2% lower offer ($98k) is reasonable based on typical stale-listing flexibility.
- Current owner paid $65k; list at $100k implies a 54% gain — meaningful room to come down on a strong offer.
Risks & watch-outs
- Watch-outs: built in 1949 — expect roof / HVAC / electrical / plumbing capex.
- Climate carrying-cost: major wind risk, 43% chance of damaging wind over 30y; extreme-heat days projected 7→18/yr by 2055 (HVAC capex compounding) — expect insurance premiums to compound above CPI over the hold.
Questions for the listing agent
- Built in 1949 — when were the roof, HVAC, electrical panel, plumbing, and water heater last replaced?
- Is there a deadline driving the sale (1031 exchange, divorce, estate, relocation)? That informs how much negotiation room exists.
- Schools are F-rated, which usually means shorter tenancies and higher turnover. Who's the typical renter profile here, and what's been the actual vacancy rate?
- Crime grade is F in this area — have there been break-ins, vandalism, or insurance claims at this property in the last 3 years? What carrier currently insures it and at what premium?
- What's the average days-on-market for RENTAL listings here right now (not sales)? A rising rental-DOM trend means longer vacancies and softer asking-rent achievability than the comps imply.
- What's the recent tenant-quality profile in this submarket — average credit score on applications, eviction rate, late-payment / NSF rate, and stable-employment percentage? A property-management company in the area should have these aggregated.
- How much new for-sale + rental construction is in the pipeline within 1–3 miles? Heavy new supply typically softens prices + rents 12–24 months out; constrained supply supports both.
Investment metrics
- 1% rule
- 1.29% ✓
- Cap rate
- 10.73%
- Cash-on-cash
- 15.84%
- DSCR
- 1.70
- GRM
- 6.4
CMA / ARV
- ARV (on-the-fly)
- $143,028
- Comps found
- 12
Show comp detail 12 sales within ~0.75 mi
| Address | Dist | Beds/Ba | Sqft | Sold | Price | $/sf | Match |
|---|---|---|---|---|---|---|---|
| 607 N Hill St | 0.04mi | 3/1.0 | 1,104 (-10%) | 2mo | $75,000 | $68 | 75 |
| 572 Elles Way | 0.55mi | 3/2.0 | 1,260 (+2%) | 3mo | $145,750 | $116 | 69 |
| 219 Lexington Ave | 0.42mi | 3/2.0 | 1,204 (-2%) | 11mo | $195,000 | $162 | 67 |
| 209 W Tinsley St | 0.34mi | 2/2.0 (-1) | 1,320 (+7%) | 1mo | $127,000 | $96 | 67 |
| 818 Haskell Ward Dr | 0.28mi | 3/2.0 | 1,120 (-9%) | 6mo | $76,098 | $68 | 66 |
| 820 Haskell Ward Dr | 0.29mi | 3/2.0 | 1,120 (-9%) | 9mo | $104,000 | $93 | 64 |
| 411 Palace St | 0.47mi | 2/2.0 (-1) | 1,178 (-4%) | 5mo | $196,000 | $166 | 62 |
| 233 E Tinsley St | 0.34mi | 3/3.0 | 1,417 (+15%) | 1mo | $240,000 | $169 | 55 |
| 715 E Chappell St | 0.68mi | 3/1.0 | 1,280 (+4%) | 5mo | $75,000 | $59 | 54 |
| 714 Ellis St | 0.60mi | 2/2.0 (-1) | 1,224 (-1%) | 16mo | $22,000 | $18 | 52 |
| 317 N 10th St | 0.53mi | 3/2.0 | 1,101 (-11%) | 17mo | $159,900 | $145 | 44 |
| 213 W Central Ave | 0.49mi | 3/1.0 | 1,064 (-14%) | 17mo | $162,000 | $152 | 36 |
Match score weights: distance 35% · size 25% · config 20% · recency 20%. Top-matched comps best support the ARV.
Projected returns pro-forma
-3.0% appreciation · 3.34% rent growth · sell at horizon
- IRR
- 7.1%
- Equity multiple
- 1.28×
- Total profit
- $7,769
- Equity at exit
- $14,895
- IRR
- 16.7%
- Equity multiple
- 2.39×
- Total profit
- $38,865
- Equity at exit
- $8,638
Cash invested: $27,972 (down + closing). Projections, not guarantees.
Landlord ↔ Tenant lean methodology
- Overall (STATE)
- 90 Strongly Landlord-Friendly
- State Georgia
- 90 Strongly Landlord-Friendly · R+3
- County
- — inherits STATE
- City
- — inherits STATE
ZIP-level market 30223
- Rents YoY
- 3.3%
- Active inventory
- 427
- Price-to-rent
- 6.4×
Monthly cashflow live
- Estimated rent
- $1,293 high interval (Pro) →
- Mortgage (P&I)
- −$524
- Tax from tax record
- −$87 /mo · $1,042/yr
- Insurance
- −$42
- HOA
- −$0
- Vacancy / Maint / Mgmt
- −$272
- Net cashflow
- $369
Break-even live
UW: 25.0% down · 7.5% · 30yr · 1.5% tax · 5.0% vac · 8.0% maint · 8.0% mgmt
Financing live
Cash to close
- Down payment
- $24,975
- Closing costs
- $2,997
- Reserves months
- —
- Total cash needed
- —
Loan-product check · same deal, 3 products live
Conventional
25% down · 7.5% · 30yr
- Down + closing
- —
- Monthly P&I
- —
- Monthly cashflow
- —
- DSCR
- —
- Eligible?
- —
Personal DTI + credit; lowest rate.
DSCR
20% down · 8.5% · 30yr
- Down + closing
- —
- Monthly P&I
- —
- Monthly cashflow
- —
- DSCR
- —
- Eligible?
- —
No personal income docs; deal must DSCR.
Hard money
10% down · 12.0% · 12mo
- Down + closing
- —
- Monthly P&I
- —
- Monthly cashflow
- —
- DSCR
- —
- Eligible?
- —
Short-term bridge; refi at stabilization.
Rent comps 40 comps
| Address | Beds | Baths | Sqft | Rent | $/sqft | DOM | Units | Dist |
|---|---|---|---|---|---|---|---|---|
| 212 Alabama St Griffin, GA | 2.0 | 1.0 | 728 | $995 | $1.37 | 43d | 1 | 0.16mi |
| 114 Blanton Ave Griffin, GA | 3.0 | 2.0 | 1274 | $1,523 | $1.20 | 20d | 1 | 0.20mi |
| 205 W Cherry St Griffin, GA | 2.0 | 1.0 | 972 | $950 | $0.98 | 2d | 1 | 0.21mi |
| 117 Blanton Ave Unit A Griffin, GA | 2.0 | 1.0 | 718 | $975 | $1.36 | 24d | 1 | 0.22mi |
| 413 N Hill St Unit B Griffin, GA | 2.0 | 1.0 | 792 | $875 | $1.10 | 3d | 1 | 0.27mi |
| 816 Lane St Griffin, GA | 3.0 | 2.0 | 1120 | $1,300 | $1.16 | 43d | 1 | 0.28mi |
| 324 Adams St Griffin, GA | 3.0 | 2.0 | 1363 | $1,595 | $1.17 | 24d | 1 | 0.30mi |
| 352 Adams St Griffin, GA | 3.0 | 1.5 | 1296 | $1,350 | $1.04 | 43d | 1 | 0.31mi |
| 214 Kentucky Ave Unit D Griffin, GA | 2.0 | 1.0 | 700 | $1,050 | $1.50 | 5d | 1 | 0.34mi |
| 308 N 8th St Griffin, GA | 3.0 | 2.0 | 1150 | $1,350 | $1.17 | 11d | 1 | 0.39mi |
| 503 Wheeler St Griffin, GA | 2.0 | 1.0 | 1028 | $1,250 | $1.22 | 43d | 1 | 0.40mi |
| 317 N 4th St Griffin, GA | 2.0 | 1.0 | 760 | $1,000 | $1.32 | 24d | 1 | 0.44mi |
| 315 W Chappell St Unit 317 Griffin, GA | 2.0 | 1.0 | 980 | $900 | $0.92 | 24d | 1 | 0.47mi |
| 217 W Central Ave Unit B Griffin, GA | 2.0 | 1.0 | 750 | $995 | $1.33 | 5d | 1 | 0.48mi |
| 502 W Broadway St Griffin, GA | 1.0–2.0 | 1.0–2.0 | 1133 | $1,745 | $1.54 | 1d | 17 | 0.54mi |
| 592 Elles Way Griffin, GA | 3.0 | 2.0 | 1260 | $1,350 | $1.07 | 43d | 1 | 0.55mi |
| 708 Ellis St Griffin, GA | 2.0 | 1.0 | 768 | $1,000 | $1.30 | 2d | 1 | 0.59mi |
| 732 Williams St Griffin, GA | 2.0 | 1.0 | 1287 | $1,200 | $0.93 | 5d | 1 | 0.65mi |
| 813 W Quilly St Griffin, GA | 2.0 | 1.0 | 838 | $1,200 | $1.43 | 4d | 1 | 0.69mi |
| 353 N 13th St Unit 353 Griffin, GA | 2.0 | 1.0 | 1059 | $950 | $0.90 | 24d | 1 | 0.71mi |
| 716 Ray St Griffin, GA | 2.0 | 1.0 | 788 | $1,300 | $1.65 | 43d | 1 | 0.71mi |
| 133 S Hill St Unit 201 Griffin, GA | 2.0 | 1.0 | 1350 | $1,299 | $0.96 | 43d | 1 | 0.73mi |
| 812 E Tinsley St Unit 814 Griffin, GA | 2.0 | 1.0 | 800 | $975 | $1.22 | 43d | 1 | 0.84mi |
| 625 E Wall St Griffin, GA | 3.0 | 2.0 | 1128 | $1,200 | $1.06 | 20d | 1 | 0.86mi |
| 311 S 5th St Unit A Griffin, GA | 2.0 | 1.0 | 975 | $1,350 | $1.38 | 43d | 1 | 0.89mi |
| 928 Ray St Griffin, GA | 4.0 | 1.0 | 1133 | $1,300 | $1.15 | 43d | 1 | 0.90mi |
| 1313 Ridgeview Dr Griffin, GA | 3.0 | 1.0 | 840 | $1,050 | $1.25 | 24d | 1 | 0.92mi |
| 416 W Poplar St Griffin, GA | 1.0–2.0 | 1.0 | 925 | $1,436 | $1.55 | 1d | 4 | 0.93mi |
| 363 N 16th St Griffin, GA | 3.0 | 2.0 | 1300 | $1,550 | $1.19 | 44d | 1 | 0.94mi |
| 422 Meriwether St Unit 2 Griffin, GA | 3.0 | 2.0 | 1100 | $1,250 | $1.14 | 12d | 1 | 0.96mi |
| 614 W Poplar St Griffin, GA | 3.0 | 1.0 | 1100 | $1,100 | $1.00 | 22d | 1 | 1.00mi |
| 521 Meriwether St Unit A Triplex Griffin, GA | 2.0 | 1.0 | 850 | $1,250 | $1.47 | 43d | 1 | 1.01mi |
| 521 Meriwether St Apt C Griffin, GA | 2.0 | 1.0 | 800 | $1,150 | $1.44 | 43d | 1 | 1.01mi |
| 521 Meriwether St Unit C Triplex Griffin, GA | 2.0 | 1.0 | 800 | $1,200 | $1.50 | 43d | 1 | 1.01mi |
| 416 Terracedale Ct Griffin, GA | 2.0 | 2.0 | 1225 | $1,595 | $1.30 | 43d | 1 | 1.04mi |
| 617 Meriwether St Griffin, GA | 1.0–2.0 | 1.0 | 745 | $1,481 | $1.99 | 1d | 4 | 1.08mi |
| 415 N 18th St Unit 417 D Griffin, GA | 2.0 | 1.0 | 865 | $1,050 | $1.21 | 43d | 1 | 1.09mi |
| 419 N 18th St Unit F Griffin, GA | 2.0 | 1.0 | 865 | $1,050 | $1.21 | 24d | 1 | 1.10mi |
| 419 N 18th St Griffin, GA | 2.0 | 1.0 | 865 | $1,050 | $1.21 | 18d | 1 | 1.10mi |
| 358 N 19th St Griffin, GA | 2.0 | 1.0 | 936 | $1,025 | $1.10 | 1d | 1 | 1.12mi |
Listing history 15 events
-
2026-06-18days on market $99,900 Active 21 DOM
-
2026-06-17days on market $99,900 Active 20 DOM
-
2026-06-16days on market $99,900 Active 19 DOM
-
2026-06-15days on market $99,900 Active 18 DOM
-
2026-06-13statusdays on market $99,900 Active 16 DOM
-
2026-06-09days on market $99,900 New 12 DOM
-
2026-06-08days on market $99,900 New 11 DOM
-
2026-06-07days on market $99,900 New 10 DOM
-
2026-06-04days on market $99,900 New 7 DOM
-
2026-06-03days on market $99,900 New 6 DOM
-
2026-06-02days on market $99,900 New 5 DOM
-
2026-06-01days on market $99,900 New 4 DOM
-
2026-05-31days on market $99,900 New 3 DOM
-
2026-05-28$99,900 New
-
2026-01-30soldstatus $65,000
ⓘ Source: listings_history table (triggers on properties + properties_extension) + one-shot
backfill from property_details.listing_events for pre-trigger history.
Tax reassessment forecast GA · Resets to sale price
- Current annual tax
- $1,042 · $87/mo
- Projected year-2 tax
- $1,042 · $87/mo
- Expected delta
- $0/yr ($0/mo · 0.0%)
ⓘ Screening estimate from a state-policy table — verify with the county assessor before closing.
Climate risk First Street
- Flood 1/10 Low FEMA zone X (unshaded) · 0% chance over 30 yrs
- Wildfire 3/10 Moderate
- Heat 6/10 Major 7 d/yr ≥105°F today · 18 d/yr by 30 yrs out
- Wind 6/10 Major 43% chance of damaging wind over 30 yrs
- Air quality 4/10 Moderate 4 unhealthy d/yr today · 5 by 30 yrs out
Nearby sold comps map
Loading sold comps map…
Walkable amenities ~0.75 mi
Loading nearby amenities…
Taxation est. · year 1
- Rental income
- $15,517
- − Mortgage interest
- −$5,596
- − Property taxes
- −$1,042
- − Insurance
- −$500
- − Repairs & maintenance
- −$1,241
- − Management
- −$1,241
- − Depreciation
- −$2,906
- Taxable income
- $2,991
- Est. tax owed @ 24.0%
- −$718
- After-tax cash flow
- $3,713/yr
For passive investors: Depreciation is non-cash, so a rental often shows a tax loss while cash-flowing — sheltering income. Rental losses are passive: they offset passive income freely, and up to $25,000/yr can offset ordinary (W-2) income if you actively participate and your MAGI is under $100k (phasing out to $0 by $150k); unused losses carry forward. On sale, claimed depreciation is recaptured at up to 25%, and gains may owe capital-gains tax (a 1031 exchange can defer both). Figures are a year-1 estimate at your 24.0% rate — not tax advice; consult a CPA.
Schools (NCES district)
- District
- Griffin-Spalding County
- NCES district ID
- 1302520
- Math proficiency
- 13% ▼ -13.00%
- Reading proficiency
- 19% ▼ -12.00%
- Median HH income
- $40,895
- Composite
- 13.71/100
- National rank
- #9496
- State rank
- #151 of 174 in GA
Livability — Griffin
- Score
- 54/100
- State rank
- #529
- US rank
- #23746
Category grades
Schools grade is shown separately in the Schools card above.
Census & demographics
- Census place
- Griffin, GA
- County
- Spalding County · 66,676 people
- City population
- 28,414
- Metro
- Atlanta-Sandy Springs-Alpharetta, GA
- Population (ZIP)
- 38,262
- Household income
- $59,054
- Rent vs Own
- Severe rent burden
- 1297.0
Population outlook (Spalding County) Hauer SSP2
- Today (2025)
- 63,015 people
- By 2030
- 61,689 · -2.1%
- By 2040
- 57,932 · -8.1%
- By 2050
- 53,474 · -15.1%
- By 2075
- 43,228 · -31.4%
- By 2100
- 32,290 · -48.8%
Race, ethnicity, and origin ACS 2023
- Neighborhood character
- Diverse neighborhood (Simpson 0.59)
- Race & ethnicity
- White 50% Black 38% Hispanic / Latino 7% Two or more races 5% Asian 1%
- Hispanic origin (detail)
- Mexican 5%
- Common ancestry
- Slovak 1% Serbian 1%
- Foreign-born
- 4% · Canada, South Korea
- Languages at home
- 92% English-only · Spanish 6% Korean 1%
Political lean MEDSL · Spalding
- 2024 margin
- R (+16.7) · D 41.4% · R 58.1%
- 2008→2024 swing
- +2.1pp toward D · 2008: -18.8pp · 2024: -16.7pp
- All cycles
- 2024: R+16.7 2020: R+20.8 2016: R+24.2 2012: R+20.0 2008: R+18.8
Not yet ingested
- Civics
- —
Market trends
- HPI YoY
- ▼ -142.92%
- Current HPI
- 225.7933
- Rent YoY
- ▲ 3.34%
- Metro
- Atlanta-Sandy Springs-Alpharetta, GA
- State GDP YoY
- ▲ 2.66%
- F500 in state
- 28
Industry mix (Fortune 500 HQ in GA)
| Industry | F500 HQs | Revenue |
|---|---|---|
| Paper / Packaging | 2 | $29B |
|
||
| Retail | 1 | $160B |
|
||
| Transportation / Logistics | 1 | $91B |
|
||
| Airlines | 1 | $62B |
|
||
| Consumer Goods | 1 | $47B |
|
||
| Utilities | 1 | $25B |
|
||
Price history
+53.7% since first listed2 events — show timeline
- 2026-05-28 Listed $99,900 GAMLS
- 2026-01-30 Sold (Public Records) $65,000 Public Records
Property tax history
+12.9%/yrLatest (2025): $1,042 · +639.9% YoY. Source: county tax records.
Cash-flow waterfall
monthlySold comps — $/sqft
last 12 mo · ≤1 miLoading sold comps…