 🏗️ New Construction
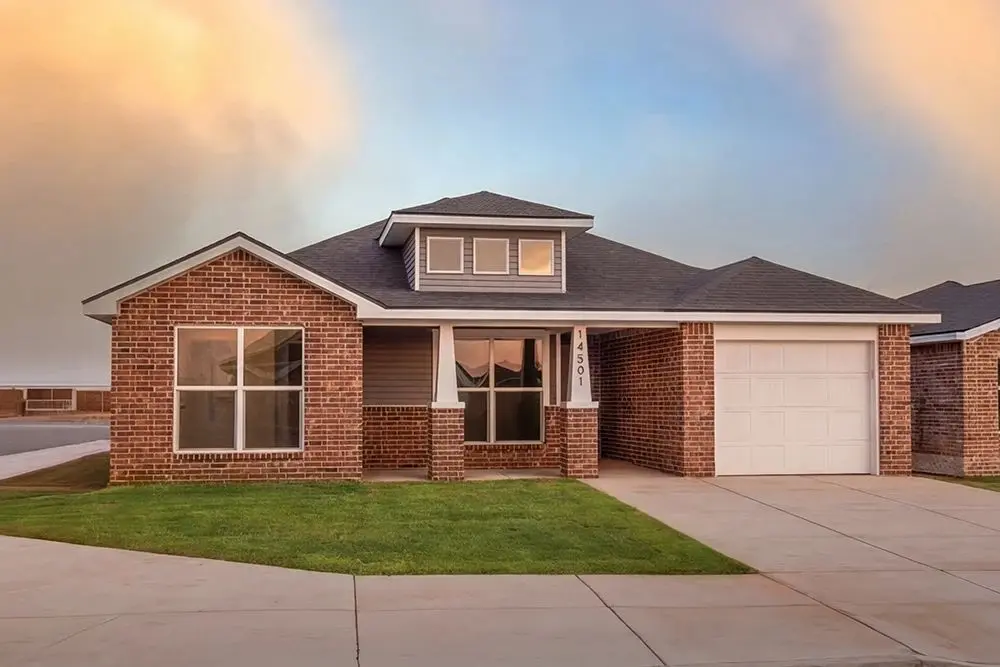
Gracie Plan · Midland, TX
Flood risk 1/10 · Minimal
- FEMA flood zone
- X
- Chance of flooding over 30 yrs
- 0.0%
- Est. flood insurance / yr
- $507 – $1,088
Fire risk 8/10 · Major
- Est. fire insurance / yr
- $1,222 – $2,270
Heat risk 6/10 · Moderate
- Hot days now (above 102°F)
- 5 days/yr
- Hot days in 30 yrs
- 14 days/yr
Wind risk 2/10 · Minimal
- Chance of severe wind over 30 yrs
- 4.0%
Air-quality risk 1/10 · Minimal
- Unhealthy air days now
- 0 days/yr
- Unhealthy air days in 30 yrs
- 0 days/yr
Risk factors via First Street. Map © Google.
Why this score? — see what drove the D grade
The composite is a weighted blend of 9 inputs, each scored 0–100. Each bar is that input's sub-score; the figure is the points it added to the 100-point composite (weight × sub-score).
- Cash flow +12.8/30.0
- ARV discount +7.5/15.0
- Livability +4.0/5.0
- Condition / age +4.0/5.0
- DSCR +3.8/10.0
- 1% rule +3.6/10.0
- Schools +3.2/10.0
- Rent growth +3.1/5.0
- Appreciation +0.0/10.0
$225,950
🖨 Deal sheet 📄 Offer letter ✓ Due diligence
Listing remarks MLS
The 1,300 square-foot Gracie floor plan is a spacious, well-connected layout with the flexibility to fit your day-to-day. Brick and vinyl exterior with covered entryLuxury vinyl plank flooring in main areasOpen-concept kitchen, living, and dining areaGranite or quartz countertopsSpacious kitchen island with bar seatingStainless steel appliancesEnclosed pantryPrivate primary suite with walk-in closet
Key facts
- Open-concept kitchen
- living
- dining area
Tags
Neighborhood map
What this means for you Summary
Snapshot
- This is a 3-bed/2.0-bath single-family listed at $226k. Condition is rated good.
Deal economics
- At list price, monthly cash flow is $-25 ($-299/yr) — negative.
- The deal already cash-flows at list — no discount required.
- Meets the 1% rule at list price ($3k rent vs $226k).
- Recommended offer: $199k (12.0% below list) — sets the bar for market timing.
- Cap rate 6.2% vs local median 4.7% in Midland — top-decile yield for the area; either an underpriced asset or a hidden risk that comps aren't pricing in. Stress-test before assuming the spread holds.
Location & tenants
- Location reads 79/100 on livability (#57 in TX, #2,192 nationally) — a middle-class / working-renter tenant base. Strengths: employment A+, housing A+, health & safety A+; Watch: schools C-, crime C-, commute D+.
- Midland ISD (urban): math 34% / reading 36% proficiency, ranked #477 of 826 in TX (top 58%) — families likely to look elsewhere, expect single-tenant / working-renter base with shorter leases.
- Market conditions: Rents rising (+2.6%/yr); 452 active listings in the ZIP; 30 comparable units currently listed for rent nearby; rentals at typical pace (median 21d on market — plan ~3-4 weeks tenant-placement turnaround); 40% of comp listings sitting > 30 days — soft ceiling on asking rent; solid renter incomes; 1,504 units permitted in Midland County in 2024 (0 in 5+ unit buildings).
Forward outlook
- Local home prices are declining (-3.0%/yr); year-one equity from $2k of loan paydown is wiped out by about $9k of value loss. Plan a longer hold.
- Midland County population projected at +83% by 2050 — long-run rental-demand tailwind backs the buy-and-hold thesis.
Negotiation context
- It's been on market 668 days — a 12% lower offer ($199k) is reasonable based on typical stale-listing flexibility.
Risks & watch-outs
- Climate carrying-cost: severe wildfire risk; extreme-heat days projected 5→14/yr by 2055 (HVAC capex compounding) — expect insurance premiums to compound above CPI over the hold.
Questions for the listing agent
- What do current leases actually rent for vs. the listed asking? Can we see a recent rent roll and the last 12 months of T-12 income?
- It's been on market 668 days. Have you received any prior offers? Is the seller open to a 12% concession, seller financing, or rate buy-down credit?
- Why hasn't it sold? Are there any deal-killer items the seller is aware of (foundation, flood, title, zoning, code violations)?
- Is there a deadline driving the sale (1031 exchange, divorce, estate, relocation)? That informs how much negotiation room exists.
- The area grade is low — what's the realistic commute time and amenity access for the typical tenant pool here? Any planned neighborhood developments (good or bad) we should know about?
- What's the average days-on-market for RENTAL listings here right now (not sales)? A rising rental-DOM trend means longer vacancies and softer asking-rent achievability than the comps imply.
- What's the recent tenant-quality profile in this submarket — average credit score on applications, eviction rate, late-payment / NSF rate, and stable-employment percentage? A property-management company in the area should have these aggregated.
- How much new for-sale + rental construction is in the pipeline within 1–3 miles? Heavy new supply typically softens prices + rents 12–24 months out; constrained supply supports both.
Investment metrics
- 1% rule
- 0.86% ✗
- Cap rate
- 6.19%
- Cash-on-cash
- -0.37%
- DSCR
- 0.98
- GRM
- 9.6
CMA / ARV
- ARV (median comp)
- $292,084
- List price
- $225,950
- Delta
- -22.64%
- Verdict
- UNDERPRICED
- Comps
- 4 within 1.0 mi
Show comp detail 1 sale within ~0.75 mi
| Address | Dist | Beds/Ba | Sqft | Sold | Price | $/sf | Match |
|---|---|---|---|---|---|---|---|
| 7112 Anticline Ct | 0.45mi | 3/2.0 | 1,368 (+4%) | 14mo | $285,000 | $208 | 61 |
Match score weights: distance 35% · size 25% · config 20% · recency 20%. Top-matched comps best support the ARV.
Projected returns pro-forma
-3.0% appreciation · 2.56% rent growth · sell at horizon
- IRR
- -17.4%
- Equity multiple
- 0.39×
- Total profit
- $-49,991
- Equity at exit
- $43,551
- IRR
- -10.2%
- Equity multiple
- 0.39×
- Total profit
- $-49,944
- Equity at exit
- $25,254
Cash invested: $81,784 (down + closing). Projections, not guarantees.
Landlord ↔ Tenant lean methodology
- Overall (STATE)
- 87 Strongly Landlord-Friendly
- State Texas
- 87 Strongly Landlord-Friendly · R+5
- County
- — inherits STATE
- City
- — inherits STATE
ZIP-level market 79705
- Rents YoY
- 2.6%
- Active inventory
- 452
- Price-to-rent
- 7.5×
Monthly cashflow live
- Estimated rent
- $2,524 high interval (Pro) →
- Mortgage (P&I)
- −$1,532
- Tax est. 1.5%
- −$365 /mo · $4,381/yr
- Insurance
- −$122
- HOA
- −$0
- Vacancy / Maint / Mgmt
- −$530
- Net cashflow
- $-25
Break-even live
UW: 25.0% down · 7.5% · 30yr · 1.5% tax · 5.0% vac · 8.0% maint · 8.0% mgmt
Financing live
Cash to close
- Down payment
- $73,021
- Closing costs
- $8,763
- Reserves months
- —
- Total cash needed
- —
Loan-product check · same deal, 3 products live
Conventional
25% down · 7.5% · 30yr
- Down + closing
- —
- Monthly P&I
- —
- Monthly cashflow
- —
- DSCR
- —
- Eligible?
- —
Personal DTI + credit; lowest rate.
DSCR
20% down · 8.5% · 30yr
- Down + closing
- —
- Monthly P&I
- —
- Monthly cashflow
- —
- DSCR
- —
- Eligible?
- —
No personal income docs; deal must DSCR.
Hard money
10% down · 12.0% · 12mo
- Down + closing
- —
- Monthly P&I
- —
- Monthly cashflow
- —
- DSCR
- —
- Eligible?
- —
Short-term bridge; refi at stabilization.
Rent comps 30 comps
| Address | Beds | Baths | Sqft | Rent | $/sqft | DOM | Units | Dist |
|---|---|---|---|---|---|---|---|---|
| 6717 Brand Ln Midland, TX | 3.0 | 2.0 | 1500 | $2,400 | $1.60 | 21d | 1 | 0.37mi |
| 1315 Yellow Rose Ct Midland, TX | 3.0 | 2.0 | 1600 | $2,600 | $1.62 | 13d | 1 | 0.45mi |
| 6706 Yellow Rose Ct Midland, TX | 3.0 | 2.0 | 1819 | $2,800 | $1.54 | 43d | 1 | 0.46mi |
| 1310 Wrangler Ln Midland, TX | 3.0 | 2.0 | 1387 | $2,400 | $1.73 | 21d | 1 | 0.49mi |
| 1341 Loess St Midland, TX | 3.0 | 2.0 | 1623 | $2,795 | $1.72 | 43d | 1 | 0.54mi |
| 1508 Rattler Ln Midland, TX | 3.0 | 2.0 | 1578 | $2,250 | $1.43 | 13d | 1 | 0.59mi |
| 1300 Hogback Way Midland, TX | 3.0 | 2.0 | 1485 | $2,350 | $1.58 | 43d | 1 | 0.61mi |
| 6309 Ojibwa Midland, TX | 3.0 | 2.0 | 1300 | $2,150 | $1.65 | 21d | 1 | 0.62mi |
| 1316 Hogback Way Midland, TX | 3.0 | 2.0 | 1633 | $2,599 | $1.59 | 43d | 1 | 0.62mi |
| 1305 Hogback Way Midland, TX | 3.0 | 2.0 | 1633 | $2,850 | $1.75 | 13d | 1 | 0.64mi |
| 1336 Hogback Way Midland, TX | 3.0 | 2.0 | 1633 | $2,950 | $1.81 | 43d | 1 | 0.64mi |
| 1321 Hogback Way Midland, TX | 3.0 | 2.0 | 1633 | $2,850 | $1.75 | 43d | 1 | 0.65mi |
| 1312 Bajada St Midland, TX | 3.0 | 2.0 | 1633 | $2,950 | $1.81 | 21d | 1 | 0.67mi |
| 1301 Bajada St Midland, TX | 3.0 | 2.0 | 1633 | $2,950 | $1.81 | 21d | 1 | 0.67mi |
| 1341 Hogback Way Midland, TX | 3.0 | 2.0 | 1633 | $2,850 | $1.75 | 43d | 1 | 0.67mi |
| 1621 Revolution Dr Midland, TX | 3.0 | 2.0 | 1504 | $2,500 | $1.66 | 43d | 1 | 0.70mi |
| 1337 Bajada St Midland, TX | 3.0 | 2.0 | 1633 | $2,900 | $1.78 | 43d | 1 | 0.71mi |
| 1337 Bajada St Midland, TX | 3.0 | 2.0 | 1633 | $2,950 | $1.81 | 21d | 1 | 0.71mi |
| 1408 Bajada St Midland, TX | 3.0 | 2.0 | 1633 | $2,599 | $1.59 | 43d | 1 | 0.72mi |
| 1405 Bajada St Midland, TX | 3.0 | 2.0 | 1633 | $2,950 | $1.81 | 13d | 1 | 0.73mi |
| 1704 Rattler Ln Midland, TX | 3.0 | 2.0 | 1498 | $2,500 | $1.67 | 21d | 1 | 0.73mi |
| 1708 Rattler Ln Midland, TX | 3.0 | 2.0 | 1694 | $2,550 | $1.51 | 43d | 1 | 0.75mi |
| 1115 Overshine Ln Midland, TX | 3.0 | 2.0 | 1867 | $2,600 | $1.39 | 13d | 1 | 0.84mi |
| 6809 Brush Dr Midland, TX | 3.0 | 2.0 | 1466 | $2,500 | $1.71 | 13d | 1 | 0.90mi |
| 6812 Brush Dr Midland, TX | 3.0 | 2.0 | 1450 | $2,500 | $1.72 | 13d | 1 | 0.93mi |
| 1513 San Miguel Ct Midland, TX | 3.0 | 2.0 | 1853 | $2,400 | $1.30 | 13d | 1 | 1.18mi |
| 6333 Poppy Dr Midland, TX | 3.0 | 2.0 | 1350 | $2,500 | $1.85 | 21d | 1 | 1.24mi |
| 6105 Poppy Dr Midland, TX | 3.0 | 2.0 | 1421 | $2,700 | $1.90 | 43d | 1 | 1.37mi |
| 2409 Husk St Unit 1 Midland, TX | 3.0 | 2.0 | 1800 | $3,000 | $1.67 | 13d | 1 | 1.45mi |
| 1412 Mockingbird Ln Midland, TX | 1.0–3.0 | 1.0–2.0 | 959 | $2,635 | $2.75 | 13d | 22 | 1.49mi |
Listing history 21 events
-
2026-06-19days on market $225,950 Active 668 DOM
-
2026-06-18days on market $225,950 Active 667 DOM
-
2026-06-17days on market $225,950 Active 666 DOM
-
2026-06-16days on market $225,950 Active 665 DOM
-
2026-06-15days on market $225,950 Active 664 DOM
-
2026-06-14days on market $225,950 Active 662 DOM
-
2026-06-13days on market $225,950 Active 661 DOM
-
2026-06-10days on market $225,950 Active 659 DOM
-
2026-06-09days on market $225,950 Active 658 DOM
-
2026-06-08days on market $225,950 Active 657 DOM
-
2026-06-07days on market $225,950 Active 656 DOM
-
2026-06-03days on market $225,950 Active 652 DOM
-
2026-06-02days on market $225,950 Active 651 DOM
-
2026-06-01days on market $225,950 Active 650 DOM
-
2026-05-31days on market $225,950 Active 649 DOM
-
2026-05-30days on market $225,950 Active 648 DOM
-
2026-02-09price $225,950 402-char remark
Show marketing remark (402 chars)
The 1,300 square-foot Gracie floor plan is a spacious, well-connected layout with the flexibility to fit your day-to-day. Brick and vinyl exterior with covered entryLuxury vinyl plank flooring in main areasOpen-concept kitchen, living, and dining areaGranite or quartz countertopsSpacious kitchen island with bar seatingStainless steel appliancesEnclosed pantryPrivate primary suite with walk-in closet
-
2025-03-26price $228,950 402-char remark
Show marketing remark (402 chars)
The 1,300 square-foot Gracie floor plan is a spacious, well-connected layout with the flexibility to fit your day-to-day. Brick and vinyl exterior with covered entryLuxury vinyl plank flooring in main areasOpen-concept kitchen, living, and dining areaGranite or quartz countertopsSpacious kitchen island with bar seatingStainless steel appliancesEnclosed pantryPrivate primary suite with walk-in closet
-
2024-10-16price $233,950 402-char remark
Show marketing remark (402 chars)
The 1,300 square-foot Gracie floor plan is a spacious, well-connected layout with the flexibility to fit your day-to-day. Brick and vinyl exterior with covered entryLuxury vinyl plank flooring in main areasOpen-concept kitchen, living, and dining areaGranite or quartz countertopsSpacious kitchen island with bar seatingStainless steel appliancesEnclosed pantryPrivate primary suite with walk-in closet
-
2024-09-18price $230,950 402-char remark
Show marketing remark (402 chars)
The 1,300 square-foot Gracie floor plan is a spacious, well-connected layout with the flexibility to fit your day-to-day. Brick and vinyl exterior with covered entryLuxury vinyl plank flooring in main areasOpen-concept kitchen, living, and dining areaGranite or quartz countertopsSpacious kitchen island with bar seatingStainless steel appliancesEnclosed pantryPrivate primary suite with walk-in closet
-
2024-08-21$231,950 Active 402-char remark
Show marketing remark (402 chars)
The 1,300 square-foot Gracie floor plan is a spacious, well-connected layout with the flexibility to fit your day-to-day. Brick and vinyl exterior with covered entryLuxury vinyl plank flooring in main areasOpen-concept kitchen, living, and dining areaGranite or quartz countertopsSpacious kitchen island with bar seatingStainless steel appliancesEnclosed pantryPrivate primary suite with walk-in closet
ⓘ Source: listings_history table (triggers on properties + properties_extension) + one-shot
backfill from property_details.listing_events for pre-trigger history.
Climate risk First Street
- Flood 1/10 Low FEMA zone X · 0% chance over 30 yrs
- Wildfire 8/10 Severe
- Heat 6/10 Major 5 d/yr ≥102°F today · 14 d/yr by 30 yrs out
- Wind 2/10 Low 4% chance of damaging wind over 30 yrs
- Air quality 1/10 Low 0 unhealthy d/yr today · 0 by 30 yrs out
Nearby sold comps map
Loading sold comps map…
Walkable amenities ~0.75 mi
Loading nearby amenities…
Taxation est. · year 1
- Rental income
- $30,283
- − Mortgage interest
- −$16,361
- − Property taxes
- −$4,381
- − Insurance
- −$1,460
- − Repairs & maintenance
- −$2,423
- − Management
- −$2,423
- − Depreciation
- −$8,497
- Taxable loss
- −$5,262
- Est. tax savings @ 24.0%
- +$1,263
- After-tax cash flow
- $964/yr
For passive investors: Depreciation is non-cash, so a rental often shows a tax loss while cash-flowing — sheltering income. Rental losses are passive: they offset passive income freely, and up to $25,000/yr can offset ordinary (W-2) income if you actively participate and your MAGI is under $100k (phasing out to $0 by $150k); unused losses carry forward. On sale, claimed depreciation is recaptured at up to 25%, and gains may owe capital-gains tax (a 1031 exchange can defer both). Figures are a year-1 estimate at your 24.0% rate — not tax advice; consult a CPA.
Condition & rehab AI · 12 photos
This well-maintained single-family home with a spacious layout and modern finishes is ready for immediate occupancy and can be further enhanced with minor updates to increase its value.
Value-add opportunities
- Both Painting the exterior brick and vinyl siding — Enhances curb appeal and can increase both resale and rental value.
- Both Updating the flooring in the bathrooms — Modernizes the bathrooms and can increase both resale and rental value.
- Both Upgrading the kitchen appliances — Modernizes the kitchen and can increase both resale and rental value.
- Both Adding smart home features — Enhances convenience and can increase both resale and rental value.
Renovation cost estimate screening
Value-add ROI direction
- Both Painting the exterior brick and vinyl siding — Enhances curb appeal and can increase both resale and rental value. ↑
- Both Updating the flooring in the bathrooms — Modernizes the bathrooms and can increase both resale and rental value. ↑
- Both Upgrading the kitchen appliances — Modernizes the kitchen and can increase both resale and rental value. ↑
- Both Adding smart home features — Enhances convenience and can increase both resale and rental value. ↑
ⓘ Cost ranges are severity-bucket heuristics (US national rule-of-thumb). Get contractor quotes + a written scope before underwriting a rehab budget.
Schools (NCES district)
- District
- Midland ISD
- NCES district ID
- 4830570
- Math proficiency
- 34% ▼ -7.00%
- Reading proficiency
- 36% ▬ 0.00%
- Median HH income
- $63,457
- Composite
- 31.63/100
- National rank
- #5938
- State rank
- #477 of 826 in TX
Livability — Midland
- Score
- 79/100
- State rank
- #57
- US rank
- #2192
Category grades
Schools grade is shown separately in the Schools card above.
Census & demographics
- Census place
- Midland, TX
- County
- Midland County · 168,494 people
- City population
- 168,494
- Metro
- Midland, TX
- Population (ZIP)
- 46,653
- Household income
- $105,310
- Rent vs Own
- Severe rent burden
- 1557.0
Population outlook (Midland County) Hauer SSP2
- Today (2025)
- 220,895 people
- By 2030
- 253,667 · +14.8%
- By 2040
- 325,498 · +47.4%
- By 2050
- 404,168 · +83.0%
- By 2075
- 609,802 · +176.1%
- By 2100
- 760,172 · +244.1%
Race, ethnicity, and origin ACS 2023
- Neighborhood character
- Diverse neighborhood (Simpson 0.60)
- Race & ethnicity
- White 46% Hispanic / Latino 43% Two or more races 20% Black 8%
- Hispanic origin (detail)
- Mexican 35%
- Common ancestry
- Slovak 1% Lithuanian 1% Serbian 1%
- Foreign-born
- 10% · Canada, Jamaica
- Languages at home
- 72% English-only · Spanish 24% Arabic 1%
Political lean MEDSL · Midland
- 2024 margin
- Solid R (+60.5) · D 19.3% · R 79.8%
- 2008→2024 swing
- -3.3pp toward R · 2008: -57.3pp · 2024: -60.5pp
- All cycles
- 2024: R+60.5 2020: R+56.6 2016: R+55.2 2012: R+61.5 2008: R+57.3
Not yet ingested
- Civics
- —
Market trends
- HPI YoY
- ▼ -300.44%
- Current HPI
- 207.2904
- Rent YoY
- ▲ 2.56%
- Metro
- Midland, TX
- State GDP YoY
- ▲ 3.95%
- F500 in state
- 110
Industry mix (Fortune 500 HQ in TX)
| Industry | F500 HQs | Revenue |
|---|---|---|
| Energy | 16 | $1,198B |
|
||
| Technology | 5 | $198B |
|
||
| Engineering / Construction | 4 | $72B |
|
||
| Energy Services | 3 | $60B |
|
||
| Utilities | 3 | $41B |
|
||
| Healthcare | 2 | $330B |
|
||
Price history
-2.6% since first listed5 events — show timeline
- 2026-02-09 Price Changed $225,950 Zillow
- 2025-03-26 Price Changed $228,950 Zillow
- 2024-10-16 Price Changed $233,950 Zillow
- 2024-09-18 Price Changed $230,950 Zillow
- 2024-08-21 Listed $231,950 Zillow
Cash-flow waterfall
monthlySold comps — $/sqft
last 12 mo · ≤1 miLoading sold comps…