104 English Crossing Rd · Hodge, LA
Flood risk 1/10 · Minimal
- FEMA flood zone
- D
- Chance of flooding over 30 yrs
- 0.0%
- Est. flood insurance / yr
- $544 – $1,084
Fire risk 4/10 · Minor
- Est. fire insurance / yr
- $1,269 – $2,357
Heat risk 7/10 · Major
- Hot days now (above 111°F)
- 7 days/yr
- Hot days in 30 yrs
- 20 days/yr
Wind risk 6/10 · Moderate
- Chance of severe wind over 30 yrs
- 73.0%
Air-quality risk 1/10 · Minimal
- Unhealthy air days now
- 0 days/yr
- Unhealthy air days in 30 yrs
- 0 days/yr
Risk factors via First Street. Map © Google.
Why this score? — see what drove the D grade
The composite is a weighted blend of 9 inputs, each scored 0–100. Each bar is that input's sub-score; the figure is the points it added to the 100-point composite (weight × sub-score).
- Appreciation +10.0/10.0
- Cash flow +9.0/30.0
- ARV discount +7.5/15.0
- Livability +2.8/5.0
- 1% rule +2.7/10.0
- Schools +2.6/10.0
- DSCR +2.5/10.0
- Rent growth +2.5/5.0
- Condition / age +2.2/5.0
$125,000
🖨 Deal sheet (PDF) 📄 Offer letter ✓ Due diligence
Listing remarks
11.77 AV, Subdivision 29-15-04 Rural Metes and Bounds Parcel 0700007800 Nestled in rural Jonesboro, this rare property offers the perfect blend of country living and extra space to spread out. There is a brick home that features 3 bedroom, 1 and half bath, 1200 sq feet located on an acre of land and provides a peaceful setting with room to enjoy the outdoors. What truly makes this property unique is the additional 10 acres located directly across the street.
Key facts
- 11.7 acre lot
- 2 parking spots
- Built 1960
Property features AI
Finance
- Other: Property is part of multiple parcels; Will not subdivide
- Financial info: Second mortgage: none; Loan type listed as Treat As Clear
- HOA & community: No association
Exterior
- Parking: Attached carport; 2 covered spaces; 2 carport spaces
- Security: No accessibility features reported
- Utilities: City water; City sewer; Electricity available; Not in a municipal utility district
- Home design: Single-family residence; One level; Residential property
- Construction: Brick construction; Built in 1960; Slab foundation
- Exterior features: Many trees; Acreage setting (11.7 acres); Rural subdivision/setting
Interior
- Kitchen: Electric range
- Bedrooms: 3 bedrooms (primary bedroom on level 1)
- Flooring: Carpet; Linoleum
- Bathrooms: 1 full bathroom; 1 half bathroom
- Heating & cooling: Wood-burning fireplace; Space heater; Window unit(s) for cooling
- Interior features: Cable TV available; One living area; One dining area; Two total rooms (listed)
- Laundry & utility: No specific laundry details listed
Neighborhood map
What this means for you Summary
Snapshot
- This is a 3-bed/1.5-bath single-family listed at $125k. Condition is rated fair.
Deal economics
- At list price, monthly cash flow is $-99 ($-1k/yr) — negative.
- To cash-flow at today's rent, offer at most $111k (11.5% below list).
- To meet the 1% rule (rent ≥ 1% of price), the offer needs to be $97k (22.6% below list).
- Recommended offer: $97k (22.6% below list) — sets the bar for 1% rule.
Location & tenants
- Location reads 56/100 on livability (#352 in LA) — a working-class tenant base; expect higher turnover. Strengths: cost of living A+; Watch: housing D+, health & safety D, schools F.
- Bienville Parish (rural): math 27% / reading 37% proficiency, ranked #42 of 98 in LA (top 43%) — families likely to look elsewhere, expect single-tenant / working-renter base with shorter leases; 66% free/reduced lunch — lower-income household profile, screen leases tightly.
- Market conditions: 42 active listings in the ZIP; 18 units permitted in Bienville Parish in 2024 (0 in 5+ unit buildings).
Forward outlook
- In year one you build about $13k of equity ($864 loan paydown + $12k appreciation (10.0% local appreciation)).
- Bienville County population projected at -19% by 2050 — secular population decline; favor cash flow + early exit over multi-decade hold.
- By year 3, paydown + projected appreciation supports a ~$34k cash-out refi (75% LTV) — recoverable capital for the next deal without selling this one.
Negotiation context
- It's been on market 39 days — a 3% lower offer ($121k) is reasonable based on typical stale-listing flexibility.
Risks & watch-outs
- Climate carrying-cost: major wind risk, 73% chance of damaging wind over 30y; extreme-heat days projected 7→20/yr by 2055 (HVAC capex compounding) — expect insurance premiums to compound above CPI over the hold.
Questions for the listing agent
- What do current leases actually rent for vs. the listed asking? Can we see a recent rent roll and the last 12 months of T-12 income?
- It's been on market 39 days. Have you received any prior offers? Is the seller open to a 23% concession, seller financing, or rate buy-down credit?
- Have any recent inspections been done? Can we get a copy of the seller's disclosures and any deferred-maintenance estimates?
- Built in 1960 — when were the roof, HVAC, electrical panel, plumbing, and water heater last replaced?
- Is there a deadline driving the sale (1031 exchange, divorce, estate, relocation)? That informs how much negotiation room exists.
- Schools are F-rated, which usually means shorter tenancies and higher turnover. Who's the typical renter profile here, and what's been the actual vacancy rate?
- Crime grade is F in this area — have there been break-ins, vandalism, or insurance claims at this property in the last 3 years? What carrier currently insures it and at what premium?
- The area grade is low — what's the realistic commute time and amenity access for the typical tenant pool here? Any planned neighborhood developments (good or bad) we should know about?
- What's the average days-on-market for RENTAL listings here right now (not sales)? A rising rental-DOM trend means longer vacancies and softer asking-rent achievability than the comps imply.
- What's the recent tenant-quality profile in this submarket — average credit score on applications, eviction rate, late-payment / NSF rate, and stable-employment percentage? A property-management company in the area should have these aggregated.
- How much new for-sale + rental construction is in the pipeline within 1–3 miles? Heavy new supply typically softens prices + rents 12–24 months out; constrained supply supports both.
Investment metrics
- 1% rule
- 0.77% ✗
- Cap rate
- 5.34%
- Cash-on-cash
- -3.40%
- DSCR
- 0.85
- GRM
- 10.8
CMA / ARV
No comps found within radius.
Projected returns pro-forma
10.0% appreciation · 3.0% rent growth · sell at horizon
- IRR
- 21.9%
- Equity multiple
- 2.77×
- Total profit
- $61,782
- Equity at exit
- $112,610
- IRR
- 19.7%
- Equity multiple
- 6.34×
- Total profit
- $186,931
- Equity at exit
- $242,848
Cash invested: $35,000 (down + closing). Projections, not guarantees.
Landlord ↔ Tenant lean methodology
- Overall (STATE)
- 90 Strongly Landlord-Friendly
- State Louisiana
- 90 Strongly Landlord-Friendly · R+12
- County
- — inherits STATE
- City
- — inherits STATE
ZIP-level market 71251
- Home prices YoY
- 6.9%
- Active inventory
- 42
- Price-to-rent
- 10.8×
Monthly cashflow live
- Estimated rent
- $968 medium interval (Pro) →
- Mortgage (P&I)
- −$656
- Tax est. 1.5%
- −$156 /mo · $1,875/yr
- Insurance
- −$52
- HOA
- −$0
- Vacancy / Maint / Mgmt
- −$203
- Net cashflow
- $-99
Break-even live
Sensitivity live
| Price | -10% $-13 | -5% $-56 | +0% $-99 | +5% $-142 | +10% $-185 |
|---|---|---|---|---|---|
| Rent | -10% $-176 | -5% $-137 | +0% $-99 | +5% $-61 | +10% $-23 |
| Rate | -1.0pp $-36 | -0.5pp $-67 | base $-99 | +0.5pp $-131 | +1.0pp $-164 |
UW: 25.0% down · 7.5% · 30yr · 1.5% tax · 5.0% vac · 8.0% maint · 8.0% mgmt
Financing live
Cash to close
- Down payment
- $31,250
- Closing costs
- $3,750
- Reserves months
- —
- Total cash needed
- —
Loan-product check · same deal, 3 products live
Conventional
25% down · 7.5% · 30yr
- Down + closing
- —
- Monthly P&I
- —
- Monthly cashflow
- —
- DSCR
- —
- Eligible?
- —
Personal DTI + credit; lowest rate.
DSCR
20% down · 8.5% · 30yr
- Down + closing
- —
- Monthly P&I
- —
- Monthly cashflow
- —
- DSCR
- —
- Eligible?
- —
No personal income docs; deal must DSCR.
Hard money
10% down · 12.0% · 12mo
- Down + closing
- —
- Monthly P&I
- —
- Monthly cashflow
- —
- DSCR
- —
- Eligible?
- —
Short-term bridge; refi at stabilization.
Listing history 19 events
-
2026-06-22days on market $125,000 Active 39 DOM
-
2026-06-21days on market $125,000 Active 38 DOM
-
2026-06-19days on market $125,000 Active 36 DOM
-
2026-06-18days on market $125,000 Active 35 DOM
-
2026-06-17days on market $125,000 Active 34 DOM
-
2026-06-16days on market $125,000 Active 33 DOM
-
2026-06-15days on market $125,000 Active 32 DOM
-
2026-06-14days on market $125,000 Active 30 DOM
-
2026-06-12days on market $125,000 Active 29 DOM
-
2026-06-09days on market $125,000 Active 26 DOM
-
2026-06-08days on market $125,000 Active 25 DOM
-
2026-06-07days on market $125,000 Active 24 DOM
-
2026-06-05days on market $125,000 Active 21 DOM
-
2026-06-03days on market $125,000 Active 20 DOM
-
2026-06-02days on market $125,000 Active 19 DOM
-
2026-06-01days on market $125,000 Active 18 DOM
-
2026-05-31days on market $125,000 Active 17 DOM
-
2026-05-30days on market $125,000 Active 16 DOM
-
2026-05-12$125,000 Active 467-char remark
ⓘ Source: listings_history table (triggers on properties + properties_extension) + one-shot
backfill from property_details.listing_events for pre-trigger history.
Climate risk First Street
- Flood 1/10 Low FEMA zone D · 0% chance over 30 yrs
- Wildfire 4/10 Moderate
- Heat 7/10 Severe 7 d/yr ≥111°F today · 20 d/yr by 30 yrs out
- Wind 6/10 Major 73% chance of damaging wind over 30 yrs
- Air quality 1/10 Low 0 unhealthy d/yr today · 0 by 30 yrs out
Nearby sold comps map
Loading sold comps map…
Walkable amenities ~0.75 mi
Loading nearby amenities…
Taxation est. · year 1
- Rental income
- $11,617
- − Mortgage interest
- −$7,002
- − Property taxes
- −$1,875
- − Insurance
- −$625
- − Repairs & maintenance
- −$929
- − Management
- −$929
- − Depreciation
- −$3,636
- Taxable loss
- −$3,380
- Est. tax savings @ 24.0%
- +$811
- After-tax cash flow
- $-378/yr
For passive investors: Depreciation is non-cash, so a rental often shows a tax loss while cash-flowing — sheltering income. Rental losses are passive: they offset passive income freely, and up to $25,000/yr can offset ordinary (W-2) income if you actively participate and your MAGI is under $100k (phasing out to $0 by $150k); unused losses carry forward. On sale, claimed depreciation is recaptured at up to 25%, and gains may owe capital-gains tax (a 1031 exchange can defer both). Figures are a year-1 estimate at your 24.0% rate — not tax advice; consult a CPA.
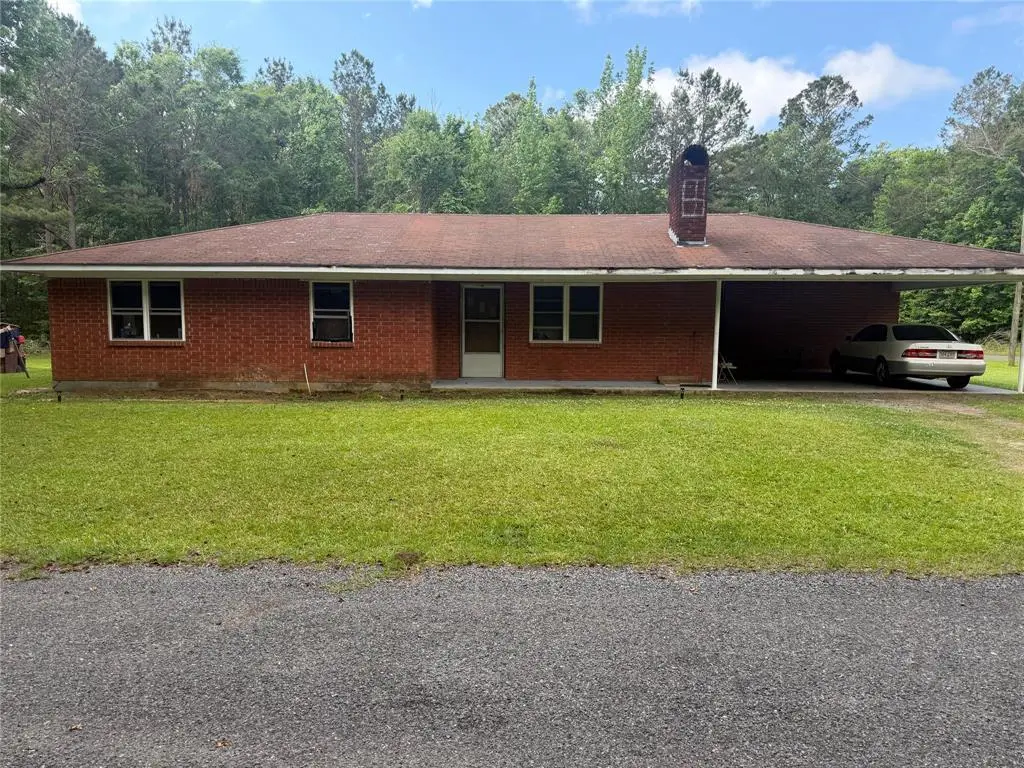
Condition & rehab AI · 4 photos
The home requires extensive repairs and maintenance, including a new roof and exterior siding, to improve its condition and value.
Repairs flagged
- Major roof — The roof appears to be in poor condition, with visible wear and tear.
- Major exterior siding — The siding appears to be in poor condition with visible wear and tear.
Value-add opportunities
- Both repair and replace roof — A new roof will significantly improve the home's appearance and functionality, making it more attractive to buyers and renters.
- Both repair and replace exterior siding — A new exterior siding will improve the home's appearance and functionality, making it more attractive to buyers and renters.
- Both paint interior and exterior — Painting will improve the home's appearance and functionality, making it more attractive to buyers and renters.
- Both landscaping and curb appeal — Landscaping and curb appeal will improve the home's appearance and functionality, making it more attractive to buyers and renters.
Renovation cost estimate screening
| Repair item | Severity | Est. cost |
|---|---|---|
| roof · The roof appears to be in poor condition, with visible wear and tear. | Major | $15,000–50,000 |
| exterior siding · The siding appears to be in poor condition with visible wear and tear. | Major | $15,000–50,000 |
| Total estimated repair cost · 2 items | $30,000–100,000 |
Value-add ROI direction
- Both repair and replace roof — A new roof will significantly improve the home's appearance and functionality, making it more attractive to buyers and renters. ↑
- Both repair and replace exterior siding — A new exterior siding will improve the home's appearance and functionality, making it more attractive to buyers and renters. ↑
- Both paint interior and exterior — Painting will improve the home's appearance and functionality, making it more attractive to buyers and renters. ↑
- Both landscaping and curb appeal — Landscaping and curb appeal will improve the home's appearance and functionality, making it more attractive to buyers and renters. ↑
ⓘ Cost ranges are severity-bucket heuristics (US national rule-of-thumb). Get contractor quotes + a written scope before underwriting a rehab budget.
Schools (NCES district)
- District
- Bienville Parish
- NCES district ID
- 2200210
- Math proficiency
- 27% ▼ -35.00%
- Reading proficiency
- 37% ▼ -29.00%
- Median HH income
- $31,737
- Composite
- 26.08/100
- National rank
- #7296
- State rank
- #42 of 98 in LA
Livability — Hodge
- Score
- 56/100
- State rank
- #352
- US rank
- #23021
Category grades
Schools grade is shown separately in the Schools card above.
Census & demographics
- City population
- 1,225
- Population (ZIP)
- 7,724
Population outlook (Bienville County) Hauer SSP2
- Today (2025)
- 13,109 people
- By 2030
- 12,626 · -3.7%
- By 2040
- 11,620 · -11.4%
- By 2050
- 10,647 · -18.8%
- By 2075
- 8,555 · -34.7%
- By 2100
- 6,717 · -48.8%
Race, ethnicity, and origin ACS 2023
- Neighborhood character
- Majority White (60%)
- Race & ethnicity
- White 60% Black 32% Hispanic / Latino 5% Two or more races 4%
- Common ancestry
- Lithuanian 3% Iranian 2% Portuguese 1%
- Foreign-born
- 4% · Canada
- Languages at home
- 96% English-only · Spanish 2% Arabic 1%
Political lean MEDSL · Bienville
- 2024 margin
- R (+18.0) · D 40.5% · R 58.5% · Other 1.0%
- 2008→2024 swing
- -15.5pp toward R · 2008: -2.5pp · 2024: -18.0pp
- All cycles
- 2024: R+18.0 2020: R+11.7 2016: R+8.9 2012: R+2.1 2008: R+2.5
Not yet ingested
- Civics
- —
Market trends
- HPI YoY
- ▲ 15.94%
- Current HPI
- 247.04
- Rent YoY
- —
- Metro
- —
- State GDP YoY
- ▲ 3.29%
- F500 in state
- 10
Industry mix (Fortune 500 HQ in LA)
| Industry | F500 HQs | Revenue |
|---|---|---|
| Telecommunications | 2 | $23B |
|
||
| Utilities | 1 | $12B |
|
||
| Wholesale / Distribution | 1 | $5B |
|
||
| Advertising | 1 | $2B |
|
||
Price history
1 event — show timeline
- 2026-05-12 Listed $125,000 NTREIS
Cash-flow waterfall
monthlySold comps — $/sqft
last 12 mo · ≤1 miLoading sold comps…