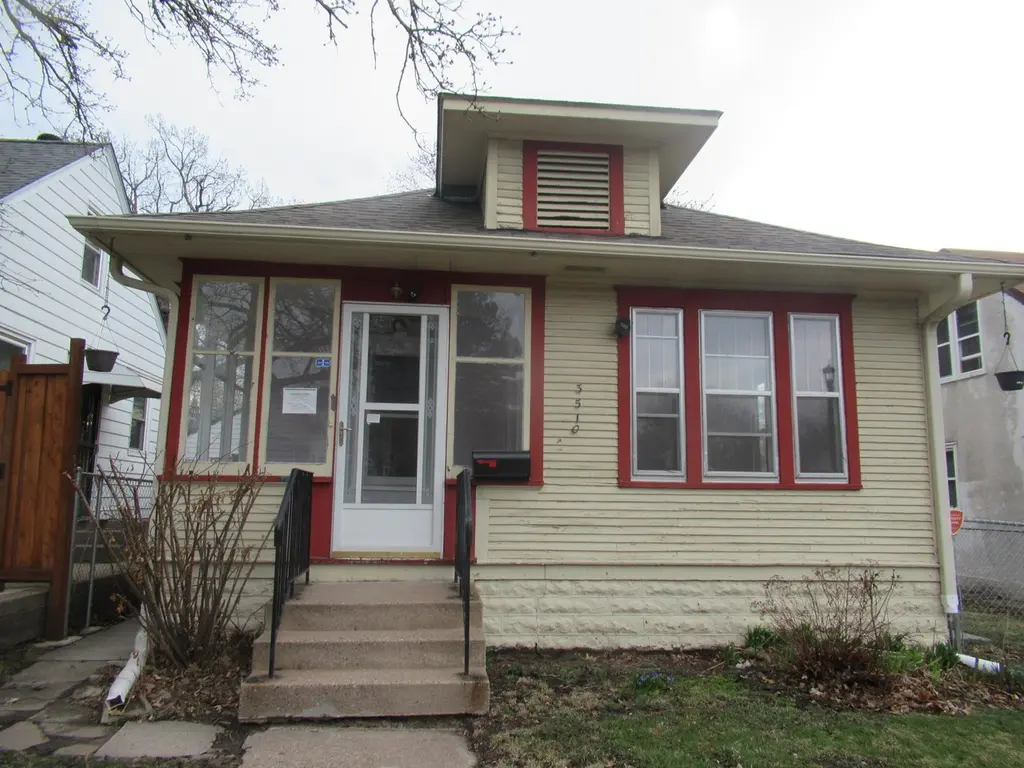
3510 Lyndale Ave N · Minneapolis, MN
Flood risk 1/10 · Minimal
- FEMA flood zone
- X (unshaded)
- Chance of flooding over 30 yrs
- 0.0%
- Est. flood insurance / yr
- $473 – $860
Fire risk 1/10 · Minimal
- Est. fire insurance / yr
- $888 – $1,650
Heat risk 2/10 · Minimal
- Hot days now (above 99°F)
- 7 days/yr
- Hot days in 30 yrs
- 14 days/yr
Wind risk 2/10 · Minimal
- Chance of severe wind over 30 yrs
- —
Air-quality risk 2/10 · Minimal
- Unhealthy air days now
- 1 days/yr
- Unhealthy air days in 30 yrs
- 1 days/yr
Risk factors via First Street. Map © Google.
Why this score? — see what drove the B- grade
The composite is a weighted blend of 9 inputs, each scored 0–100. Each bar is that input's sub-score; the figure is the points it added to the 100-point composite (weight × sub-score).
- Cash flow +29.4/30.0
- DSCR +10.0/10.0
- 1% rule +8.4/10.0
- ARV discount +7.5/15.0
- Rent growth +4.1/5.0
- Livability +3.9/5.0
- Schools +3.5/10.0
- Condition / age +2.5/5.0
- Appreciation +0.0/10.0
$109,900
🖨 Deal sheet (PDF) 📄 Offer letter ✓ Due diligence
Listing remarks
Great Opportunity! Two bedroom, one bath bungalow, hardwoods, porch, patio, unfinished basement with egress window for future expansion. Detached two car garage and more!
Key facts
- Porch
- Hardwoods
- Unfinished basement
Tags
Property features AI
Exterior
- Parking: Detached 2-car garage
- Utilities: City water connected; City sewer connected; Natural gas; Electric with circuit breakers
- Home design: Residential property; One story; Entry level: Main; Above- and below-grade finished living areas (main level finished)
- Construction: Frame construction; Block foundation; Roof older than 8 years; Built area with foundation area noted
- Exterior features: Patio; Porch; Wood exterior; Light tree coverage; Public transit within 6 blocks; City street with paved roads and public maintenance
Interior
- Kitchen: Kitchen on main level
- Bedrooms: Two bedrooms (both on the main level); Main floor bedroom
- Flooring: Hardwood floors
- Bathrooms: One full bath; Main floor 3/4 bath
- Heating & cooling: Forced air heating; No central cooling
- Interior features: Living/dining room; Hardwood floors; Full unfinished basement
- Laundry & utility: Laundry in basement; Gas water heater
Neighborhood map
What this means for you Summary
Snapshot
- This is a 2-bed/1.5-bath single-family listed at $110k.
Deal economics
- At list price, monthly cash flow is $391 ($5k/yr) — positive.
- The deal already cash-flows at list — no discount required.
- Meets the 1% rule at list price ($1k rent vs $110k).
- Recommended offer: $108k (1.5% below list) — sets the bar for market timing.
- Cap rate 10.6% vs local median 3.1% in Minneapolis — top-decile yield for the area; either an underpriced asset or a hidden risk that comps aren't pricing in. Stress-test before assuming the spread holds.
Location & tenants
- Location reads 78/100 on livability (#110 in MN, #2,525 nationally) — a middle-class / working-renter tenant base. Strengths: amenities A+, commute A+, housing A+; Watch: cost of living C-, crime F.
- Minneapolis Public School District (urban): math 35% / reading 46% proficiency, ranked #217 of 301 in MN (top 72%) — families likely to look elsewhere, expect single-tenant / working-renter base with shorter leases.
- Zoned schools: Nellie Stone Johnson Elementary (math 2% / reading 17%, grade F, #829 of 857 statewide, top 98%, 201 students, 96% FRL); Franklin Middle (math 2% / reading 8%, grade F, #255 of 258 statewide, top 100%, 287 students, 89% FRL); Henry High (reading 70%, 858 students, 80% FRL) — zoned schools average 88% FRL vs 58% district-wide (30 pts higher); higher-poverty schools than district average — tighter screening recommended.
- Zoned-school proficiency averages 7% at this address vs 40% district-wide (-33 pts) — the specific schools serving this property underperform the Minneapolis Public School District average; the district grade overstates school quality for this exact location.
- Market conditions: Rents rising fast (+6.3%/yr); 167 active listings in the ZIP; 35 comparable units currently listed for rent nearby; rentals at typical pace (median 16d on market — plan ~3-4 weeks tenant-placement turnaround); 4,651 units permitted in Hennepin County in 2024 (2,443 in 5+ unit buildings).
Forward outlook
- Local home prices are declining (-3.0%/yr); year-one equity from $760 of loan paydown is wiped out by about $3k of value loss. Plan a longer hold.
- Hennepin County population projected at +30% by 2050 — long-run rental-demand tailwind backs the buy-and-hold thesis.
- At projected returns (-3.0% appreciation + 6.3% rent growth), your $31k cash investment doubles in ~7 years — after that, you're playing with house money.
Negotiation context
- It's been on market 25 days — a 2% lower offer ($108k) is reasonable based on typical stale-listing flexibility.
- 2 sale attempts since 26y ago with the ask held roughly flat each time — persistent listings suggest the price (not the market) is what's stuck; bring a comps-based counter.
- Current owner paid $87k; 26% above their basis — modest negotiation headroom, anchor on the comps not their cost.
Risks & watch-outs
- Watch-outs: built in 1914 — expect roof / HVAC / electrical / plumbing capex.
Questions for the listing agent
- Built in 1914 — when were the roof, HVAC, electrical panel, plumbing, and water heater last replaced?
- Is there a deadline driving the sale (1031 exchange, divorce, estate, relocation)? That informs how much negotiation room exists.
- Crime grade is F in this area — have there been break-ins, vandalism, or insurance claims at this property in the last 3 years? What carrier currently insures it and at what premium?
- What's the average days-on-market for RENTAL listings here right now (not sales)? A rising rental-DOM trend means longer vacancies and softer asking-rent achievability than the comps imply.
- What's the recent tenant-quality profile in this submarket — average credit score on applications, eviction rate, late-payment / NSF rate, and stable-employment percentage? A property-management company in the area should have these aggregated.
- How much new for-sale + rental construction is in the pipeline within 1–3 miles? Heavy new supply typically softens prices + rents 12–24 months out; constrained supply supports both.
Investment metrics
- 1% rule
- 1.34% ✓
- Cap rate
- 10.56%
- Cash-on-cash
- 15.24%
- DSCR
- 1.68
- GRM
- 6.2
CMA / ARV
No comps found within radius.
Projected returns pro-forma
-3.0% appreciation · 6.35% rent growth · sell at horizon
- IRR
- 9.7%
- Equity multiple
- 1.40×
- Total profit
- $12,234
- Equity at exit
- $16,386
- IRR
- 21.5%
- Equity multiple
- 3.12×
- Total profit
- $65,327
- Equity at exit
- $9,502
Cash invested: $30,772 (down + closing). Projections, not guarantees.
Landlord ↔ Tenant lean methodology
- Overall (CITY)
- 34 Tenant-Leaning
- State Minnesota
- 46 Balanced · D+2
- County
- — inherits STATE
- City Minneapolis
- 34 Tenant-Leaning · D+50
ZIP-level market 55412
- Home prices YoY
- -26.9%
- Rents YoY
- 6.3%
- Active inventory
- 167
- Price-to-rent
- 6.2×
Monthly cashflow live
- Estimated rent
- $1,469 high interval (Pro) →
- Mortgage (P&I)
- −$576
- Tax from tax record
- −$148 /mo · $1,771/yr
- Insurance
- −$46
- HOA
- −$0
- Vacancy / Maint / Mgmt
- −$309
- Net cashflow
- $391
Break-even live
Sensitivity live
| Price | -10% $453 | -5% $422 | +0% $391 | +5% $360 | +10% $329 |
|---|---|---|---|---|---|
| Rent | -10% $275 | -5% $333 | +0% $391 | +5% $449 | +10% $507 |
| Rate | -1.0pp $446 | -0.5pp $419 | base $391 | +0.5pp $362 | +1.0pp $333 |
UW: 25.0% down · 7.5% · 30yr · 1.5% tax · 5.0% vac · 8.0% maint · 8.0% mgmt
Financing live
Cash to close
- Down payment
- $27,475
- Closing costs
- $3,297
- Reserves months
- —
- Total cash needed
- —
Loan-product check · same deal, 3 products live
Conventional
25% down · 7.5% · 30yr
- Down + closing
- —
- Monthly P&I
- —
- Monthly cashflow
- —
- DSCR
- —
- Eligible?
- —
Personal DTI + credit; lowest rate.
DSCR
20% down · 8.5% · 30yr
- Down + closing
- —
- Monthly P&I
- —
- Monthly cashflow
- —
- DSCR
- —
- Eligible?
- —
No personal income docs; deal must DSCR.
Hard money
10% down · 12.0% · 12mo
- Down + closing
- —
- Monthly P&I
- —
- Monthly cashflow
- —
- DSCR
- —
- Eligible?
- —
Short-term bridge; refi at stabilization.
Rent comps 35 comps
| Address | Beds | Baths | Sqft | Rent | $/sqft | DOM | Units | Dist |
|---|---|---|---|---|---|---|---|---|
| 3606 N Bryant Ave Unit 2 Minneapolis, MN | 1.0 | 1.0 | 600 | $1,250 | $2.08 | 45d | 1 | 0.16mi |
| 3347 Emerson Ave N #2 Minneapolis, MN | 1.0 | 1.0 | 746 | $1,300 | $1.74 | 4d | 1 | 0.37mi |
| 3342 N Humboldt Ave Unit 2 Minneapolis, MN | 1.0 | 1.0 | 900 | $1,395 | $1.55 | 19d | 1 | 0.51mi |
| 1315 N Dowling Ave Unit 304 Minneapolis, MN | 2.0 | 1.0 | 900 | $1,450 | $1.61 | 5d | 1 | 0.53mi |
| 1315 N Dowling Ave Unit 308 Minneapolis, MN | 2.0 | 1.0 | 800 | $1,450 | $1.81 | 23d | 1 | 0.53mi |
| 1315 N Dowling Ave Unit 306 Minneapolis, MN | 1.0 | 1.0 | 750 | $1,250 | $1.67 | 5d | 1 | 0.54mi |
| 3753 Girard Ave N Minneapolis, MN | 1.0–2.0 | 1.0 | 687 | $1,450 | $2.11 | 19d | 8 | 0.55mi |
| 3001 N 3rd St Apt 1 Minneapolis, MN | 2.0 | 1.0 | 900 | $1,250 | $1.39 | 22d | 1 | 0.60mi |
| 4001 N Bryant Ave Unit 1 Minneapolis, MN | 2.0 | 1.0 | 850 | $1,295 | $1.52 | 45d | 1 | 0.62mi |
| 4055 Lyndale Ave N Minneapolis, MN | 2.0 | 1.0 | 800 | $1,075 | $1.34 | 1d | 1 | 0.71mi |
| 4055 N Lyndale Ave Unit 1 Minneapolis, MN | 1.0 | 1.0 | 650 | $945 | $1.45 | 45d | 1 | 0.71mi |
| 2652 Marshall St NE Minneapolis, MN | 2.0 | 1.0 | 700 | $1,199 | $1.71 | 45d | 1 | 0.75mi |
| 3255 N Logan Ave Unit 2 Minneapolis, MN | 2.0 | 1.0 | 900 | $995 | $1.11 | 19d | 1 | 0.81mi |
| 2620 Emerson Ave N Minneapolis, MN | 3.0 | 1.0 | 877 | $1,900 | $2.17 | 1d | 1 | 0.90mi |
| 4253 Webber Pkwy Minneapolis, MN | 1.0 | 1.0 | 700 | $1,295 | $1.85 | 26d | 1 | 0.94mi |
| 2947 Morgan Ave N Minneapolis, MN | 2.0 | 1.0 | 1106 | $1,950 | $1.76 | 15d | 1 | 0.99mi |
| 2947 Morgan Ave N Minneapolis, MN | 2.0 | 1.0 | 1106 | $1,950 | $1.76 | 1d | 1 | 0.99mi |
| 3322 Penn Ave N Minneapolis, MN | 1.0 | 1.0 | 660 | $1,350 | $2.05 | 16d | 1 | 1.00mi |
| 3643 Penn Ave N Minneapolis, MN | 1.0 | 1.0 | 900 | $988 | $1.10 | 45d | 2 | 1.03mi |
| 3230 N Penn Ave Unit 1 Minneapolis, MN | 1.0 | 1.0 | 765 | $895 | $1.17 | 5d | 1 | 1.03mi |
| 4311 Humboldt Ave N Minneapolis, MN | 2.0 | 1.0 | 915 | $1,795 | $1.96 | 45d | 1 | 1.14mi |
| 1709 N 26th Ave Unit 3 Minneapolis, MN | 1.0 | 1.0 | 920 | $1,250 | $1.36 | 45d | 1 | 1.15mi |
| 2124 Fremont Ave N Minneapolis, MN | 2.0 | 1.0 | 1050 | $1,580 | $1.50 | 3d | 1 | 1.29mi |
| 801 N 21st Ave Unit 204 Minneapolis, MN | 1.0 | 1.0 | 750 | $875 | $1.17 | 45d | 1 | 1.31mi |
| 801 21st Ave N Minneapolis, MN | 1.0 | 1.0 | 750 | $875 | $1.17 | 5d | 2 | 1.31mi |
| 1523 22nd Ave N Minneapolis, MN | 3.0 | 1.0 | 943 | $1,695 | $1.80 | 16d | 1 | 1.34mi |
| 347 24th Ave NE Unit 1 Minneapolis, MN | 2.0 | 1.0 | 770 | $1,295 | $1.68 | 26d | 1 | 1.35mi |
| 835 W Broadway Ave Minneapolis, MN | 1.0–2.0 | 1.0–2.0 | 849 | $2,150 | $2.53 | 4d | 7 | 1.41mi |
| 2035 W River Rd Minneapolis, MN | 1.0–4.0 | 2.0 | 1034 | $1,730 | $1.67 | 1d | 12 | 1.42mi |
| 4638 Camden Ave N Unit 1 Minneapolis, MN | 2.0 | 1.0 | 815 | $1,495 | $1.83 | 5d | 1 | 1.42mi |
| 1432 Grand St NE Minneapolis, MN | 2.0 | 1.0 | 670 | $1,475 | $2.20 | 9d | 1 | 1.43mi |
| 1432 Grand St NE Unit 2 Minneapolis, MN | 2.0 | 1.0 | 670 | $1,475 | $2.20 | 1d | 1 | 1.43mi |
| 2323 26th Ave N Minneapolis, MN | 2.0 | 1.0 | 807 | $1,717 | $2.13 | 16d | 3 | 1.43mi |
| 2000 W Broadway Ave Minneapolis, MN | 2.0 | 1.0 | 952 | $1,350 | $1.42 | 9d | 4 | 1.46mi |
| 301 17th Ave NE Minneapolis, MN | 2.0 | 1.0 | 925 | $1,295 | $1.40 | 5d | 1 | 1.50mi |
Listing history 20 events
-
2026-06-21days on market $109,900 Active 25 DOM
-
2026-06-18days on market $109,900 Active 22 DOM
-
2026-06-17days on market $109,900 Active 21 DOM
-
2026-06-16days on market $109,900 Active 20 DOM
-
2026-06-15days on market $109,900 Active 19 DOM
-
2026-06-13days on market $109,900 Active 17 DOM
-
2026-06-09days on market $109,900 Active 13 DOM
-
2026-06-08days on market $109,900 Active 12 DOM
-
2026-06-07days on market $109,900 Active 11 DOM
-
2026-06-04days on market $109,900 Active 8 DOM
-
2026-06-03days on market $109,900 Active 7 DOM
-
2026-06-02days on market $109,900 Active 6 DOM
-
2026-06-01days on market $109,900 Active 5 DOM
-
2026-05-31days on market $109,900 Active 4 DOM
-
2026-05-27$109,900 Active
-
2000-12-12soldstatus $87,000
-
2000-09-07soldstatus $86,900
-
2000-08-16historical
-
2000-07-23$86,900
-
1985-06-01soldstatus $49,000
ⓘ Source: listings_history table (triggers on properties + properties_extension) + one-shot
backfill from property_details.listing_events for pre-trigger history.
Tax reassessment forecast MN · Partial reset (capped growth)
- Current annual tax
- $1,771 · $148/mo
- Projected year-2 tax
- $1,771 · $148/mo
- Expected delta
- $0/yr ($0/mo · 0.0%)
ⓘ Screening estimate from a state-policy table — verify with the county assessor before closing.
Climate risk First Street
- Flood 1/10 Low FEMA zone X (unshaded) · 0% chance over 30 yrs
- Wildfire 1/10 Low
- Heat 2/10 Low 7 d/yr ≥99°F today · 14 d/yr by 30 yrs out
- Wind 2/10 Low
- Air quality 2/10 Low 1 unhealthy d/yr today · 1 by 30 yrs out
Nearby sold comps map
Loading sold comps map…
Walkable amenities ~0.75 mi
Loading nearby amenities…
Taxation est. · year 1
- Rental income
- $17,629
- − Mortgage interest
- −$6,156
- − Property taxes
- −$1,771
- − Insurance
- −$550
- − Repairs & maintenance
- −$1,410
- − Management
- −$1,410
- − Depreciation
- −$3,197
- Taxable income
- $3,135
- Est. tax owed @ 24.0%
- −$752
- After-tax cash flow
- $3,938/yr
For passive investors: Depreciation is non-cash, so a rental often shows a tax loss while cash-flowing — sheltering income. Rental losses are passive: they offset passive income freely, and up to $25,000/yr can offset ordinary (W-2) income if you actively participate and your MAGI is under $100k (phasing out to $0 by $150k); unused losses carry forward. On sale, claimed depreciation is recaptured at up to 25%, and gains may owe capital-gains tax (a 1031 exchange can defer both). Figures are a year-1 estimate at your 24.0% rate — not tax advice; consult a CPA.
Schools (NCES district)
- District
- Minneapolis Public School District
- NCES district ID
- 2721240
- Math proficiency
- 35% ▼ -7.00%
- Reading proficiency
- 46% ▼ -1.00%
- Median HH income
- $50,521
- Composite
- 34.92/100
- National rank
- #5067
- State rank
- #217 of 301 in MN
Livability — Minneapolis
- Score
- 78/100
- State rank
- #110
- US rank
- #2525
Category grades
Schools grade is shown separately in the Schools card above.
Census & demographics
- Census place
- Minneapolis, MN
- County
- Hennepin County · 1,150,272 people
- City population
- 417,555
- Metro
- Minneapolis-St. Paul-Bloomington, MN-WI
- Population (ZIP)
- 24,460
- Household income
- $68,682
- Rent vs Own
- Severe rent burden
- 913.0
Population outlook (Hennepin County) Hauer SSP2
- Today (2025)
- 1,405,227 people
- By 2030
- 1,492,650 · +6.2%
- By 2040
- 1,660,157 · +18.1%
- By 2050
- 1,823,498 · +29.8%
- By 2075
- 2,221,283 · +58.1%
- By 2100
- 2,509,976 · +78.6%
Race, ethnicity, and origin ACS 2023
- Neighborhood character
- Highly diverse neighborhood (Simpson 0.73)
- Race & ethnicity
- White 36% Black 33% Hispanic / Latino 14% Two or more races 12% Asian 8% Native American 1%
- Hispanic origin (detail)
- Mexican 8%
- Common ancestry
- Portuguese 6% Lithuanian 2% Romanian 1%
- Foreign-born
- 12% · Canada
- Languages at home
- 82% English-only · Spanish 9% Other Asian/Pacific 7% Tagalog/Filipino 1%
Political lean MEDSL · Hennepin
- 2024 margin
- Solid D (+42.6) · D 70.2% · R 27.5% · Other 2.3%
- 2008→2024 swing
- +14.0pp toward D · 2008: 28.6pp · 2024: 42.6pp
- All cycles
- 2024: D+42.6 2020: D+43.2 2016: D+35.3 2012: D+27.1 2008: D+28.6
Not yet ingested
- Civics
- —
Market trends
- HPI YoY
- ▼ -109.98%
- Current HPI
- 298.1414
- Rent YoY
- ▲ 6.35%
- Metro
- Minneapolis-St. Paul-Bloomington, MN-WI
- State GDP YoY
- ▲ 2.41%
- F500 in state
- 34
Industry mix (Fortune 500 HQ in MN)
| Industry | F500 HQs | Revenue |
|---|---|---|
| Healthcare | 2 | $407B |
|
||
| Retail | 2 | $150B |
|
||
| Consumer Goods | 2 | $32B |
|
||
| Industrial Machinery | 2 | $6B |
|
||
| Agriculture | 1 | $40B |
|
||
| Healthcare / Medical Devices | 1 | $32B |
|
||
Price history
+124.3% since first listed6 events — show timeline
- 2026-05-27 Listed $109,900 NORTHSTARMLS as Distributed by MLS Grid
- 2000-12-12 Sold (Public Records) $87,000 Public Records
- 2000-09-07 Sold (MLS) $86,900 NORTHSTARMLS as Distributed by MLS Grid
- 2000-08-16 Listing Removed — NORTHSTARMLS as Distributed by MLS Grid
- 2000-07-23 Listed $86,900 NORTHSTARMLS as Distributed by MLS Grid
- 1985-06-01 Sold (Public Records) $49,000 Public Records
Property tax history
+6.1%/yrLatest (2025): $1,771 · +20.7% YoY. Source: county tax records.
Cash-flow waterfall
monthlySold comps — $/sqft
last 12 mo · ≤1 miLoading sold comps…