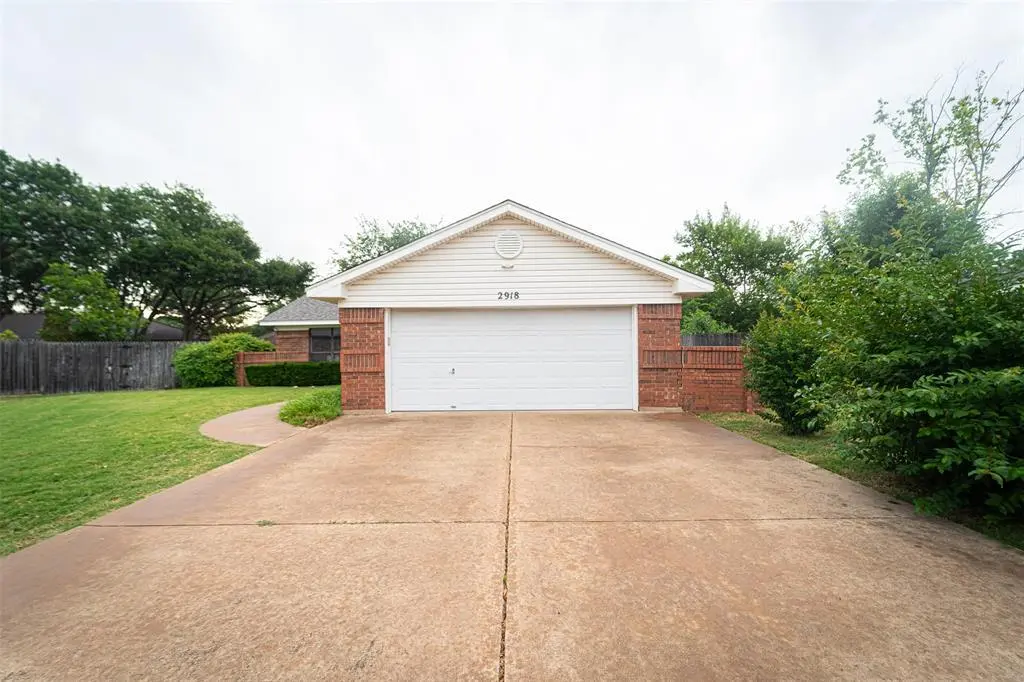
2918 Oak Ridge Ct · Abilene, TX
Flood risk 1/10 · Minimal
- FEMA flood zone
- X (unshaded)
- Chance of flooding over 30 yrs
- 0.0%
- Est. flood insurance / yr
- $507 – $1,088
Fire risk 8/10 · Major
- Est. fire insurance / yr
- $1,222 – $2,270
Heat risk 6/10 · Moderate
- Hot days now (above 103°F)
- 7 days/yr
- Hot days in 30 yrs
- 23 days/yr
Wind risk 4/10 · Minor
- Chance of severe wind over 30 yrs
- 11.0%
Air-quality risk 1/10 · Minimal
- Unhealthy air days now
- 0 days/yr
- Unhealthy air days in 30 yrs
- 0 days/yr
Risk factors via First Street. Map © Google.
Why this score? — see what drove the C+ grade
The composite is a weighted blend of 9 inputs, each scored 0–100. Each bar is that input's sub-score; the figure is the points it added to the 100-point composite (weight × sub-score).
- Cash flow +22.7/30.0
- ARV discount +10.0/15.0
- DSCR +7.3/10.0
- 1% rule +6.2/10.0
- Rent growth +5.0/5.0
- Livability +3.8/5.0
- Schools +2.8/10.0
- Condition / age +2.5/5.0
- Appreciation +0.0/10.0
$230,000
🖨 Deal sheet 📄 Offer letter ✓ Due diligence
Listing remarks
Step into this charming home featuring warm, inviting spaces and thoughtful details throughout. Cozy up by the wood-burning fireplace in the living area, perfect for relaxing evenings at home. The galley kitchen offers functionality and style with a convenient bar top ideal for casual dining or entertaining guests. Spacious walk-in closets provide plenty of storage, while the primary suite boasts a large ensuite bath designed for comfort. Outside, enjoy a large backyard with endless possibilities for gatherings, pets, or play, along with a covered porch perfect for morning coffee or winding down at the end of the day. This home combines comfort, charm, and practicality in one inviting packa
Key facts
- 7,928 sq ft lot
- 2 garage spots
- Built 1987
Property features AI
Finance
- Other: Municipal utility district: No
- Financial info: Listing accepts conventional, FHA, VA, cash, and 1031 exchange financing
- HOA & community: No association (no HOA)
Exterior
- Parking: 2-car attached garage with garage door opener and inside entrance; Covered parking spaces (2); Asphalt driveway; Garage includes a workshop area; Garage dimensions approximately 19' wide x 20' long x 8' high; single 2-car door
- Security: Smoke detector(s)
- Utilities: City water; City sewer; Electricity connected; Cable available; Phone available; Curbs and sidewalk
- Home design: Single-family residence; One-story; Not attached to another property; Built in 1987; Subdivision: The Oaks
- Construction: Brick and siding exterior; Composition roof; Slab foundation; Year built: 1987
- Exterior features: Covered front and rear porches; Covered porch(es); Wood privacy fence with gate; Large backyard with grass; Landscaped lot; Few trees; Level, interior lot in a subdivision; Located on a cul-de-sac
Interior
- Kitchen: Dishwasher; Electric range; Microwave; Refrigerator; Disposal; Warming drawer; Pantry; Breakfast bar / eat-in kitchen; Galley-style layout
- Bedrooms: 3 bedrooms (all on one level); Primary bedroom with ensuite bath and garden tub; Two additional bedrooms arranged as split bedrooms
- Flooring: Carpet; Ceramic tile; Vinyl
- Bathrooms: 2 full bathrooms; Primary bathroom has built-in cabinets, ensuite access, garden tub and solid-surface counters; Secondary bathroom with built-in cabinets and solid-surface counters
- Heating & cooling: Central heating (electric); Central air conditioning (electric); Ceiling fan(s); Fireplace(s) for supplemental heat
- Interior features: Decorative lighting; Cable TV available; High speed internet available; Eat-in kitchen; Pantry; Walk-in closet(s); Window coverings
- Laundry & utility: Full-size washer/dryer area; Washer hookup; Electric dryer hookup; Utility / separate laundry room with built-in cabinets
Neighborhood map
What this means for you Summary
Snapshot
- This is a 3-bed/2.0-bath single-family listed at $230k.
Deal economics
- At list price, monthly cash flow is $394 ($5k/yr) — positive.
- The deal already cash-flows at list — no discount required.
- Meets the 1% rule at list price ($3k rent vs $230k).
- Cap rate 8.3% vs local median 6.7% in Abilene — meaningfully above typical; check what's discounted (condition, days-on-market, listing class) to confirm the premium yield is real.
Location & tenants
- Location reads 75/100 on livability (#142 in TX, #4,037 nationally) — a middle-class / working-renter tenant base. Strengths: cost of living A+, housing A+, health & safety A+; Watch: crime D, commute F.
- Abilene ISD (urban): math 32% / reading 34% proficiency, ranked #575 of 826 in TX (top 70%) — families likely to look elsewhere, expect single-tenant / working-renter base with shorter leases.
- Zoned schools: Ward El (math 38% / reading 40%, grade F, #1,651 of 4,322 statewide, top 39%, 494 students, 52% FRL).
- Market conditions: Rents rising fast (+40.7%/yr); 288 active listings in the ZIP; 5 comparable units currently listed for rent nearby; rentals leasing fast (median 14d on market — plan ~1-2 weeks tenant-placement turnaround); solid renter incomes; 508 units permitted in Taylor County in 2024 (0 in 5+ unit buildings).
- This rent runs 39% of the median local income ($79k/yr) — at the standard rent-burdened threshold; future hikes will face affordability resistance.
Forward outlook
- Local home prices are declining (-3.0%/yr); year-one equity from $2k of loan paydown is wiped out by about $7k of value loss. Plan a longer hold.
- Taylor County population projected at +16% by 2050 — long-run rental-demand tailwind backs the buy-and-hold thesis.
- At projected returns (-3.0% appreciation + 8.0% rent growth), your $64k cash investment doubles in ~8 years — after that, you're playing with house money.
Negotiation context
- Only 5 days on market — expect competitive offers; lowballing is unlikely to land.
Risks & watch-outs
- Climate carrying-cost: severe wildfire risk; extreme-heat days projected 7→23/yr by 2055 (HVAC capex compounding) — expect insurance premiums to compound above CPI over the hold.
Questions for the listing agent
- Is there a deadline driving the sale (1031 exchange, divorce, estate, relocation)? That informs how much negotiation room exists.
- Schools are D-rated, which usually means shorter tenancies and higher turnover. Who's the typical renter profile here, and what's been the actual vacancy rate?
- Crime grade is D in this area — have there been break-ins, vandalism, or insurance claims at this property in the last 3 years? What carrier currently insures it and at what premium?
- What's the average days-on-market for RENTAL listings here right now (not sales)? A rising rental-DOM trend means longer vacancies and softer asking-rent achievability than the comps imply.
- What's the recent tenant-quality profile in this submarket — average credit score on applications, eviction rate, late-payment / NSF rate, and stable-employment percentage? A property-management company in the area should have these aggregated.
- How much new for-sale + rental construction is in the pipeline within 1–3 miles? Heavy new supply typically softens prices + rents 12–24 months out; constrained supply supports both.
Investment metrics
- 1% rule
- 1.12% ✓
- Cap rate
- 8.35%
- Cash-on-cash
- 7.34%
- DSCR
- 1.33
- GRM
- 7.4
CMA / ARV
- ARV (on-the-fly)
- $243,724
- Comps found
- 12
Show comp detail 12 sales within ~0.75 mi
| Address | Dist | Beds/Ba | Sqft | Sold | Price | $/sf | Match |
|---|---|---|---|---|---|---|---|
| 12 High Life Cir | 0.09mi | 3/2.0 | 1,550 (+9%) | 4mo | $279,000 | $180 | 77 |
| 2926 Button Willow Pkwy | 0.36mi | 3/2.0 | 1,350 (-5%) | 3mo | $215,000 | $159 | 72 |
| 4333 Mary Lou Ln | 0.32mi | 4/1.5 (+1) | 1,368 (-4%) | 5mo | $215,000 | $157 | 68 |
| 2618 Button Willow Ave | 0.32mi | 3/2.0 | 1,551 (+10%) | 1mo | $190,000 | $123 | 68 |
| 5217 Shady Glen Ln | 0.53mi | 3/2.0 | 1,363 (-4%) | 2mo | $260,000 | $191 | 67 |
| 4633 Plover Ln | 0.50mi | 3/2.0 | 1,498 (+6%) | 3mo | $174,900 | $117 | 65 |
| 3034 Broken Bough Trl | 0.39mi | 3/2.0 | 1,595 (+13%) | 2mo | $299,900 | $188 | 60 |
| 4317 Hearthstone Ct | 0.67mi | 3/2.0 | 1,540 (+9%) | 1mo | $265,000 | $172 | 54 |
| 3542 Paint Brush Dr | 0.68mi | 3/2.0 | 1,547 (+9%) | 2mo | $272,500 | $176 | 52 |
| 4326 Bruce Dr | 0.75mi | 3/2.0 | 1,510 (+7%) | 6mo | $289,900 | $192 | 49 |
| 4618 Bruce Dr | 0.65mi | 3/2.0 | 1,622 (+14%) | 2mo | $250,000 | $154 | 44 |
| 70 Courtyard Ln | 0.60mi | 2/2.5 (-1) | 1,629 (+15%) | 3mo | $228,900 | $141 | 37 |
Match score weights: distance 35% · size 25% · config 20% · recency 20%. Top-matched comps best support the ARV.
Projected returns pro-forma
-3.0% appreciation · 8.0% rent growth · sell at horizon
- IRR
- 0.6%
- Equity multiple
- 1.02×
- Total profit
- $1,515
- Equity at exit
- $34,294
- IRR
- 14.9%
- Equity multiple
- 2.49×
- Total profit
- $95,946
- Equity at exit
- $19,886
Cash invested: $64,400 (down + closing). Projections, not guarantees.
Landlord ↔ Tenant lean methodology
- Overall (STATE)
- 87 Strongly Landlord-Friendly
- State Texas
- 87 Strongly Landlord-Friendly · R+5
- County
- — inherits STATE
- City
- — inherits STATE
ZIP-level market 79606
- Rents YoY
- 40.7%
- Active inventory
- 288
- Price-to-rent
- 7.4×
Monthly cashflow live
- Estimated rent
- $2,579 high interval (Pro) →
- Mortgage (P&I)
- −$1,206
- Tax from tax record
- −$342 /mo · $4,101/yr
- Insurance
- −$96
- HOA
- −$0
- Vacancy / Maint / Mgmt
- −$542
- Net cashflow
- $394
Break-even live
UW: 25.0% down · 7.5% · 30yr · 1.5% tax · 5.0% vac · 8.0% maint · 8.0% mgmt
Financing live
Cash to close
- Down payment
- $57,500
- Closing costs
- $6,900
- Reserves months
- —
- Total cash needed
- —
Loan-product check · same deal, 3 products live
Conventional
25% down · 7.5% · 30yr
- Down + closing
- —
- Monthly P&I
- —
- Monthly cashflow
- —
- DSCR
- —
- Eligible?
- —
Personal DTI + credit; lowest rate.
DSCR
20% down · 8.5% · 30yr
- Down + closing
- —
- Monthly P&I
- —
- Monthly cashflow
- —
- DSCR
- —
- Eligible?
- —
No personal income docs; deal must DSCR.
Hard money
10% down · 12.0% · 12mo
- Down + closing
- —
- Monthly P&I
- —
- Monthly cashflow
- —
- DSCR
- —
- Eligible?
- —
Short-term bridge; refi at stabilization.
Rent comps 5 comps
| Address | Beds | Baths | Sqft | Rent | $/sqft | DOM | Units | Dist |
|---|---|---|---|---|---|---|---|---|
| 4925 Greenslope Dr Unit C Abilene, TX | 3.0 | 2.0 | 1100 | $1,900 | $1.73 | 13d | 1 | 0.33mi |
| 3134 Winterhawk Dr Abilene, TX | 3.0 | 2.0 | 1800 | $2,795 | $1.55 | 7d | 1 | 0.46mi |
| 2701 S 40th St Abilene, TX | 3.0 | 2.0 | 1196 | $1,995 | $1.67 | 21d | 1 | 0.78mi |
| 3826 Crest Way Abilene, TX | 3.0 | 2.0 | 1721 | $2,695 | $1.57 | 44d | 1 | 0.84mi |
| 5733 Legacy Dr Abilene, TX | 3.0 | 2.0 | 1843 | $5,000 | $2.71 | 5d | 1 | 1.12mi |
Listing history 6 events
-
2026-05-31status $230,000 Pending 5 DOM
-
2026-05-31days on market $230,000 Active Option Contract 5 DOM
-
2026-05-30days on market $230,000 Active Option Contract 4 DOM
-
2026-05-27historical Active Option Contract
-
2026-05-26$230,000 Active
-
1994-11-17soldstatus
ⓘ Source: listings_history table (triggers on properties + properties_extension) + one-shot
backfill from property_details.listing_events for pre-trigger history.
Tax reassessment forecast TX · Resets to sale price
- Current annual tax
- $4,101 · $342/mo
- Projected year-2 tax
- $4,209 · $351/mo
- Expected delta
- +$108/yr (+$9/mo · 2.6%)
ⓘ Screening estimate from a state-policy table — verify with the county assessor before closing.
Climate risk First Street
- Flood 1/10 Low FEMA zone X (unshaded) · 0% chance over 30 yrs
- Wildfire 8/10 Severe
- Heat 6/10 Major 7 d/yr ≥103°F today · 23 d/yr by 30 yrs out
- Wind 4/10 Moderate 11% chance of damaging wind over 30 yrs
- Air quality 1/10 Low 0 unhealthy d/yr today · 0 by 30 yrs out
Nearby sold comps map
Loading sold comps map…
Walkable amenities ~0.75 mi
Loading nearby amenities…
Taxation est. · year 1
- Rental income
- $30,950
- − Mortgage interest
- −$12,884
- − Property taxes
- −$4,101
- − Insurance
- −$1,150
- − Repairs & maintenance
- −$2,476
- − Management
- −$2,476
- − Depreciation
- −$6,691
- Taxable income
- $1,173
- Est. tax owed @ 24.0%
- −$281
- After-tax cash flow
- $4,444/yr
For passive investors: Depreciation is non-cash, so a rental often shows a tax loss while cash-flowing — sheltering income. Rental losses are passive: they offset passive income freely, and up to $25,000/yr can offset ordinary (W-2) income if you actively participate and your MAGI is under $100k (phasing out to $0 by $150k); unused losses carry forward. On sale, claimed depreciation is recaptured at up to 25%, and gains may owe capital-gains tax (a 1031 exchange can defer both). Figures are a year-1 estimate at your 24.0% rate — not tax advice; consult a CPA.
Schools (NCES district)
- District
- Abilene ISD
- NCES district ID
- 4807440
- Math proficiency
- 32% ▼ -11.00%
- Reading proficiency
- 34% ▼ -5.00%
- Median HH income
- $39,782
- Composite
- 27.71/100
- National rank
- #6909
- State rank
- #575 of 826 in TX
Livability — Abilene
- Score
- 75/100
- State rank
- #142
- US rank
- #4037
Category grades
Schools grade is shown separately in the Schools card above.
Census & demographics
- Census place
- Abilene, TX
- County
- Taylor County · 136,672 people
- City population
- 136,672
- Metro
- Abilene, TX
- Population (ZIP)
- 29,182
- Household income
- $79,196
- Rent vs Own
- Severe rent burden
- 1181.0
Population outlook (Taylor County) Hauer SSP2
- Today (2025)
- 145,270 people
- By 2030
- 150,050 · +3.3%
- By 2040
- 159,417 · +9.7%
- By 2050
- 168,883 · +16.3%
- By 2075
- 194,436 · +33.8%
- By 2100
- 203,163 · +39.9%
Race, ethnicity, and origin ACS 2023
- Neighborhood character
- Predominantly White (69%)
- Race & ethnicity
- White 69% Hispanic / Latino 19% Two or more races 11% Black 6% Asian 4%
- Hispanic origin (detail)
- Mexican 14%
- Common ancestry
- Italian 4% Slovak 2% Serbian 1%
- Foreign-born
- 7% · Canada, Vietnam
- Languages at home
- 86% English-only · Spanish 10% Tagalog/Filipino 1% Other Indo-European 1%
Political lean MEDSL · Taylor
- 2024 margin
- Solid R (+49.8) · D 24.6% · R 74.4% · Other 1.0%
- 2008→2024 swing
- -4.2pp toward R · 2008: -45.6pp · 2024: -49.8pp
- All cycles
- 2024: R+49.8 2020: R+45.3 2016: R+51.1 2012: R+53.6 2008: R+45.6
Not yet ingested
- Civics
- —
Market trends
- HPI YoY
- ▼ -167.33%
- Current HPI
- 179.2555
- Rent YoY
- ▲ 40.73%
- Metro
- Abilene, TX
- State GDP YoY
- ▲ 3.95%
- F500 in state
- 110
Industry mix (Fortune 500 HQ in TX)
| Industry | F500 HQs | Revenue |
|---|---|---|
| Energy | 16 | $1,198B |
|
||
| Technology | 5 | $198B |
|
||
| Engineering / Construction | 4 | $72B |
|
||
| Energy Services | 3 | $60B |
|
||
| Utilities | 3 | $41B |
|
||
| Healthcare | 2 | $330B |
|
||
Price history
3 events — show timeline
- 2026-05-27 Contingent — NTREIS
- 2026-05-26 Listed $230,000 NTREIS
- 1994-11-17 Sold (Public Records) — Public Records
Property tax history
+4.7%/yrLatest (2025): $4,101 · +8.2% YoY. Source: county tax records.
Cash-flow waterfall
monthlySold comps — $/sqft
last 12 mo · ≤1 miLoading sold comps…