231 Deep Creek Rd · Elizabeth City, NC
Flood risk 7/10 · Major
- FEMA flood zone
- X (unshaded)
- Chance of flooding over 30 yrs
- 0.73%
- Est. flood insurance / yr
- $507 – $1,088
Fire risk 2/10 · Minimal
- Est. fire insurance / yr
- $906 – $1,684
Heat risk 9/10 · Severe
- Hot days now (above 106°F)
- 7 days/yr
- Hot days in 30 yrs
- 17 days/yr
Wind risk 9/10 · Severe
- Chance of severe wind over 30 yrs
- 99.0%
Air-quality risk 1/10 · Minimal
- Unhealthy air days now
- 0 days/yr
- Unhealthy air days in 30 yrs
- 0 days/yr
Risk factors via First Street. Map © Google.
Why this score? — see what drove the B grade
The composite is a weighted blend of 9 inputs, each scored 0–100. Each bar is that input's sub-score; the figure is the points it added to the 100-point composite (weight × sub-score).
- Cash flow +27.2/30.0
- Appreciation +10.0/10.0
- DSCR +9.5/10.0
- ARV discount +7.5/15.0
- 1% rule +6.7/10.0
- Schools +3.9/10.0
- Livability +3.6/5.0
- Rent growth +2.5/5.0
- Condition / age +2.5/5.0
$150,000
🖨 Deal sheet 📄 Offer letter ✓ Due diligence
Listing remarks
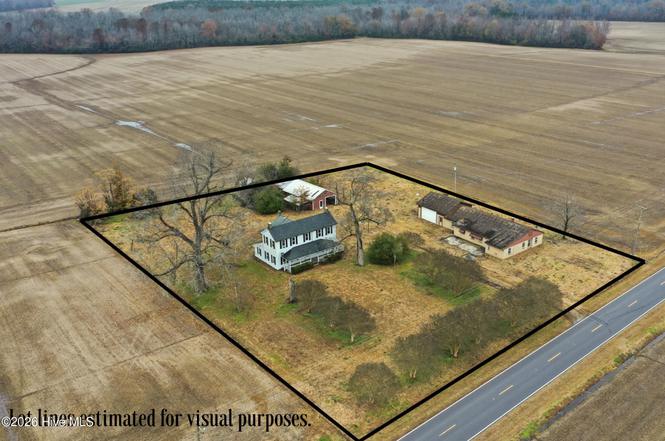
Come on home to 231 Deep Creek Road! If you've been dreaming about restoring a classic farmhouse and making it your own, this is your opportunity. Nearly 75 years of history live within these walls, and from the moment you step through the front door, you're welcomed by warm hardwood floors and glimpses of updates layered throughout the decades. The layout offers room to imagine and reimagine. A formal foyer sets the tone, with a sitting room just off the entry. There's a den, additional living spaces, and multiple rooms that could flex to fit your vision — office, studio, playroom, expanded primary suite. .. you name it. Upstairs you'll find two generously sized bedrooms and a ful
Key facts
- Warm hardwood floors
- Formal foyer
- Classic farmhouse
Tags
Property features AI
Exterior
- Parking: Detached garage with 4 garage spaces; Total of 4 parking spaces; Circular driveway; Gravel/unpaved and lighted parking areas
- Utilities: Public water; Water connected; Septic tank
- Home design: Single family residence; Two levels; Entry level on 1
- Construction: Vinyl siding and frame construction
- Exterior features: Covered and enclosed patios/porches; Front porch; Side porch; Shingle roof; Property has a view; Shed(s), barn(s), storage and workshop on the property; Level, farm-like lot; City street and state road frontage; Irregular lot dimensions
Interior
- Kitchen: Kitchen island; Electric water heater
- Flooring: Carpet; Vinyl; Wood
- Bathrooms: Two full bathrooms
- Heating & cooling: Propane heating; Electric heating; Cooling system (type: Other)
- Interior features: High ceilings; Entrance foyer; Built-in bookcases; Kitchen island; Ceiling fans; Cedar closets
Neighborhood map
What this means for you Summary
Snapshot
- This is a 3-bed/1.0-bath single-family listed at $150k.
Deal economics
- At list price, monthly cash flow is $365 ($4k/yr) — positive.
- The deal already cash-flows at list — no discount required.
- Meets the 1% rule at list price ($2k rent vs $150k).
- Recommended offer: $132k (12.0% below list) — sets the bar for market timing.
- Cap rate 9.7% vs local median 2.9% in Elizabeth City — top-decile yield for the area; either an underpriced asset or a hidden risk that comps aren't pricing in. Stress-test before assuming the spread holds.
Location & tenants
- Location reads 71/100 on livability (#119 in NC) — a middle-class / working-renter tenant base. Strengths: cost of living A+, housing A+, health & safety A+; Watch: crime D+, commute F, employment F.
- Perquimans County Schools (rural): math 44% / reading 48% proficiency, ranked #83 of 178 in NC (top 47%) — families likely to look elsewhere, expect single-tenant / working-renter base with shorter leases.
- Zoned schools: Perquimans Central (391 students, 65% FRL); Perquimans County Middle (math 39% / reading 48%, grade D, #182 of 475 statewide, top 40%, 366 students, 59% FRL); Perquimans County High (math 47% / reading 42%, grade F, #352 of 535 statewide, top 68%, 518 students, 59% FRL).
- Market conditions: 339 active listings in the ZIP; 46 units permitted in Perquimans County in 2024 (0 in 5+ unit buildings).
Forward outlook
- In year one you build about $16k of equity ($1k loan paydown + $15k appreciation (10.0% local appreciation)).
- Perquimans County population projected at -16% by 2050 — secular population decline; favor cash flow + early exit over multi-decade hold.
- At projected returns (10.0% appreciation + 3.0% rent growth), your $42k cash investment doubles in ~2 years — after that, you're playing with house money.
- By year 3, paydown + projected appreciation supports a ~$41k cash-out refi (75% LTV) — recoverable capital for the next deal without selling this one.
Negotiation context
- It's been on market 133 days — a 12% lower offer ($132k) is reasonable based on typical stale-listing flexibility.
Risks & watch-outs
- Watch-outs: flood insurance adds $66/mo; built in 1942 — expect roof / HVAC / electrical / plumbing capex.
- Climate carrying-cost: major flood risk; severe wind risk, 99% chance of damaging wind over 30y; extreme-heat days projected 7→17/yr by 2055 (HVAC capex compounding) — expect insurance premiums to compound above CPI over the hold.
Questions for the listing agent
- It's been on market 133 days. Have you received any prior offers? Is the seller open to a 12% concession, seller financing, or rate buy-down credit?
- Built in 1942 — when were the roof, HVAC, electrical panel, plumbing, and water heater last replaced?
- What's the actual annual flood-insurance premium (NFIP or private), and is the property in a SFHA with mandatory coverage?
- Why hasn't it sold? Are there any deal-killer items the seller is aware of (foundation, flood, title, zoning, code violations)?
- Is there a deadline driving the sale (1031 exchange, divorce, estate, relocation)? That informs how much negotiation room exists.
- Schools are F-rated, which usually means shorter tenancies and higher turnover. Who's the typical renter profile here, and what's been the actual vacancy rate?
- Crime grade is D in this area — have there been break-ins, vandalism, or insurance claims at this property in the last 3 years? What carrier currently insures it and at what premium?
- What's the average days-on-market for RENTAL listings here right now (not sales)? A rising rental-DOM trend means longer vacancies and softer asking-rent achievability than the comps imply.
- What's the recent tenant-quality profile in this submarket — average credit score on applications, eviction rate, late-payment / NSF rate, and stable-employment percentage? A property-management company in the area should have these aggregated.
- How much new for-sale + rental construction is in the pipeline within 1–3 miles? Heavy new supply typically softens prices + rents 12–24 months out; constrained supply supports both.
Investment metrics
- 1% rule
- 1.17% ✓
- Cap rate
- 9.75%
- Cash-on-cash
- 12.33%
- DSCR
- 1.55
- GRM
- 7.1
CMA / ARV
No comps found within radius.
Projected returns pro-forma
10.0% appreciation · 3.0% rent growth · sell at horizon
- IRR
- 31.9%
- Equity multiple
- 3.50×
- Total profit
- $104,970
- Equity at exit
- $135,132
- IRR
- 27.6%
- Equity multiple
- 7.93×
- Total profit
- $290,862
- Equity at exit
- $291,417
Cash invested: $42,000 (down + closing). Projections, not guarantees.
Landlord ↔ Tenant lean methodology
- Overall (STATE)
- 85 Strongly Landlord-Friendly
- State North Carolina
- 85 Strongly Landlord-Friendly · R+3
- County
- — inherits STATE
- City
- — inherits STATE
ZIP-level market 27944
- Home prices YoY
- 9.5%
- Active inventory
- 339
- Price-to-rent
- 7.1×
Monthly cashflow live
- Estimated rent
- $1,755 medium interval (Pro) →
- Mortgage (P&I)
- −$787
- Tax from tax record
- −$106 /mo · $1,271/yr
- Insurance
- −$62
- Flood insurance flood zone
- −$66 /mo · $798/yr
- HOA
- −$0
- Vacancy / Maint / Mgmt
- −$369
- Net cashflow
- $365
Break-even live
UW: 25.0% down · 7.5% · 30yr · 1.5% tax · 5.0% vac · 8.0% maint · 8.0% mgmt
Financing live
Cash to close
- Down payment
- $37,500
- Closing costs
- $4,500
- Reserves months
- —
- Total cash needed
- —
Loan-product check · same deal, 3 products live
Conventional
25% down · 7.5% · 30yr
- Down + closing
- —
- Monthly P&I
- —
- Monthly cashflow
- —
- DSCR
- —
- Eligible?
- —
Personal DTI + credit; lowest rate.
DSCR
20% down · 8.5% · 30yr
- Down + closing
- —
- Monthly P&I
- —
- Monthly cashflow
- —
- DSCR
- —
- Eligible?
- —
No personal income docs; deal must DSCR.
Hard money
10% down · 12.0% · 12mo
- Down + closing
- —
- Monthly P&I
- —
- Monthly cashflow
- —
- DSCR
- —
- Eligible?
- —
Short-term bridge; refi at stabilization.
Listing history 17 events
-
2026-06-19days on market $150,000 Active 133 DOM
-
2026-06-18days on market $150,000 Active 132 DOM
-
2026-06-17days on market $150,000 Active 131 DOM
-
2026-06-16days on market $150,000 Active 130 DOM
-
2026-06-15days on market $150,000 Active 129 DOM
-
2026-06-14days on market $150,000 Active 127 DOM
-
2026-06-12days on market $150,000 Active 126 DOM
-
2026-06-09days on market $150,000 Active 123 DOM
-
2026-06-08days on market $150,000 Active 122 DOM
-
2026-06-07days on market $150,000 Active 121 DOM
-
2026-06-03days on market $150,000 Active 117 DOM
-
2026-06-02days on market $150,000 Active 116 DOM
-
2026-06-01days on market $150,000 Active 115 DOM
-
2026-05-31days on market $150,000 Active 114 DOM
-
2026-05-30days on market $150,000 Active 113 DOM
-
2026-04-20price $150,000
-
2026-02-06$165,000 Active
ⓘ Source: listings_history table (triggers on properties + properties_extension) + one-shot
backfill from property_details.listing_events for pre-trigger history.
Tax reassessment forecast NC · Resets to sale price
- Current annual tax
- $1,271 · $106/mo
- Projected year-2 tax
- $1,271 · $106/mo
- Expected delta
- $0/yr ($0/mo · 0.0%)
ⓘ Screening estimate from a state-policy table — verify with the county assessor before closing.
Climate risk First Street
- Flood 7/10 Severe FEMA zone X (unshaded) · 73% chance over 30 yrs
- Wildfire 2/10 Low
- Heat 9/10 Extreme 7 d/yr ≥106°F today · 17 d/yr by 30 yrs out
- Wind 9/10 Extreme 99% chance of damaging wind over 30 yrs
- Air quality 1/10 Low 0 unhealthy d/yr today · 0 by 30 yrs out
Nearby sold comps map
Loading sold comps map…
Walkable amenities ~0.75 mi
Loading nearby amenities…
Taxation est. · year 1
- Rental income
- $21,063
- − Mortgage interest
- −$8,402
- − Property taxes
- −$1,271
- − Insurance
- −$1,547
- − Repairs & maintenance
- −$1,685
- − Management
- −$1,685
- − Depreciation
- −$4,364
- Taxable income
- $2,109
- Est. tax owed @ 24.0%
- −$506
- After-tax cash flow
- $3,876/yr
For passive investors: Depreciation is non-cash, so a rental often shows a tax loss while cash-flowing — sheltering income. Rental losses are passive: they offset passive income freely, and up to $25,000/yr can offset ordinary (W-2) income if you actively participate and your MAGI is under $100k (phasing out to $0 by $150k); unused losses carry forward. On sale, claimed depreciation is recaptured at up to 25%, and gains may owe capital-gains tax (a 1031 exchange can defer both). Figures are a year-1 estimate at your 24.0% rate — not tax advice; consult a CPA.
Schools (NCES district)
- District
- Perquimans County Schools
- NCES district ID
- 3703600
- Math proficiency
- 44% ▲ 6.00%
- Reading proficiency
- 48% ▲ 7.00%
- Median HH income
- $42,593
- Composite
- 38.75/100
- National rank
- #4124
- State rank
- #83 of 178 in NC
Livability — Elizabeth City
- Score
- 71/100
- State rank
- #119
- US rank
- #7304
Category grades
Schools grade is shown separately in the Schools card above.
Census & demographics
- City population
- 40,869
- Population (ZIP)
- 11,255
Population outlook (Perquimans County) Hauer SSP2
- Today (2025)
- 13,018 people
- By 2030
- 12,716 · -2.3%
- By 2040
- 11,895 · -8.6%
- By 2050
- 10,981 · -15.6%
- By 2075
- 8,931 · -31.4%
- By 2100
- 7,101 · -45.5%
Race, ethnicity, and origin ACS 2023
- Neighborhood character
- Predominantly White (71%)
- Race & ethnicity
- White 71% Black 20% Two or more races 5% Hispanic / Latino 3%
- Common ancestry
- Lithuanian 3% Serbian 2% Slovak 2%
- Foreign-born
- 3% · Canada, China, Dominican Republic
- Languages at home
- 96% English-only · Spanish 3%
Political lean MEDSL · Perquimans
- 2024 margin
- Solid R (+39.4) · D 29.7% · R 69.1% · Other 1.2%
- 2008→2024 swing
- -25.4pp toward R · 2008: -13.9pp · 2024: -39.4pp
- All cycles
- 2024: R+39.4 2020: R+32.2 2016: R+28.1 2012: R+16.1 2008: R+13.9
Not yet ingested
- Civics
- —
Market trends
- HPI YoY
- ▲ 22.77%
- Current HPI
- 261.91
- Rent YoY
- —
- Metro
- —
- State GDP YoY
- ▲ 3.28%
- F500 in state
- 26
Industry mix (Fortune 500 HQ in NC)
| Industry | F500 HQs | Revenue |
|---|---|---|
| Financial Services | 2 | $213B |
|
||
| Retail | 2 | $95B |
|
||
| Industrial Conglomerate | 1 | $38B |
|
||
| Metals / Steel | 1 | $35B |
|
||
| Utilities | 1 | $30B |
|
||
| Industrial Machinery | 1 | $19B |
|
||
Price history
-9.1% since first listed2 events — show timeline
- 2026-04-20 Price Changed $150,000 Hive MLS
- 2026-02-06 Listed $165,000 Hive MLS
Property tax history
-1.9%/yrLatest (2025): $1,271 · +0.0% YoY. Source: county tax records.
Cash-flow waterfall
monthlySold comps — $/sqft
last 12 mo · ≤1 miLoading sold comps…