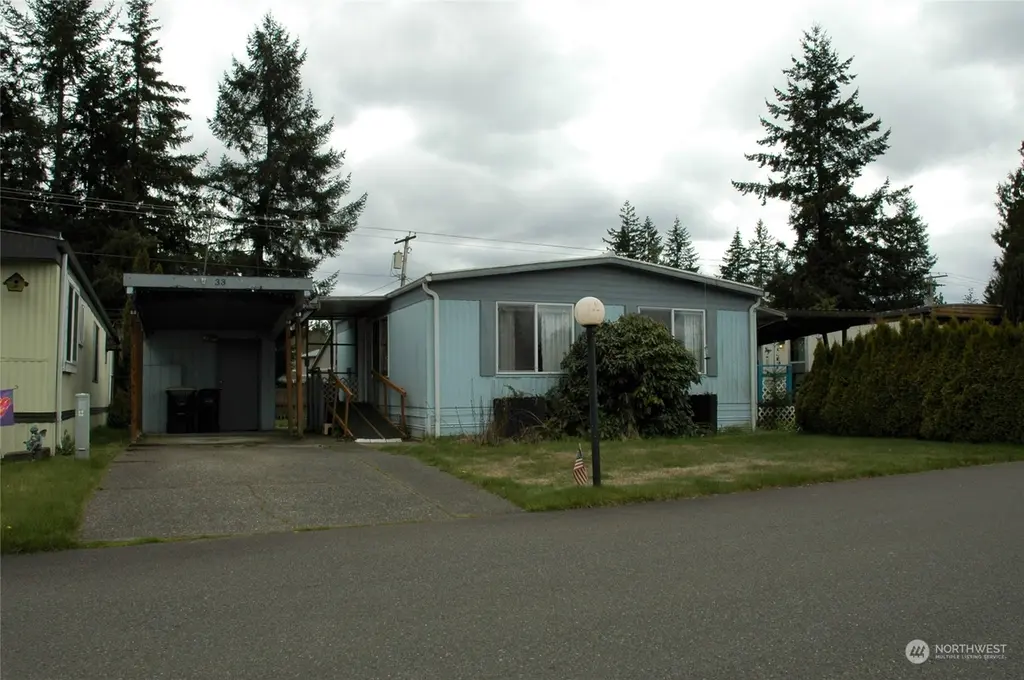
3244 66th Ave SW #33 · Tumwater, WA
Flood risk 1/10 · Minimal
- FEMA flood zone
- X (unshaded)
- Chance of flooding over 30 yrs
- 0.0%
- Est. flood insurance / yr
- $507 – $1,088
Fire risk 4/10 · Minor
- Est. fire insurance / yr
- $604 – $1,122
Heat risk 3/10 · Minor
- Hot days now (above 88°F)
- 7 days/yr
- Hot days in 30 yrs
- 14 days/yr
Wind risk 1/10 · Minimal
- Chance of severe wind over 30 yrs
- —
Air-quality risk 6/10 · Moderate
- Unhealthy air days now
- 6 days/yr
- Unhealthy air days in 30 yrs
- 6 days/yr
Risk factors via First Street. Map © Google.
Why this score? — see what drove the B grade
The composite is a weighted blend of 9 inputs, each scored 0–100. Each bar is that input's sub-score; the figure is the points it added to the 100-point composite (weight × sub-score).
- Cash flow +30.0/30.0
- 1% rule +10.0/10.0
- DSCR +10.0/10.0
- ARV discount +7.9/15.0
- Schools +5.6/10.0
- Livability +4.2/5.0
- Rent growth +3.1/5.0
- Condition / age +2.5/5.0
- Appreciation +0.0/10.0
$45,000
🖨 Deal sheet (PDF) 📄 Offer letter ✓ Due diligence
Listing remarks
Nestled in a serene country setting, Laurel Park Estates offers an exceptional 55+ active adult lifestyle that balances peaceful tranquility with urban convenience. This home features a covered carport, ramp entry, and a spacious backyard with two large storage sheds. This community is ideally situated within three miles of essential services, including medical facilities, major shopping centers, recreational parks, and Interstate 5, ensuring quick access to public transit, police, and fire stations. The community offers a shared BBQ area for relaxing and socializing.
Key facts
- Spacious backyard
- Covered carport
- Large storage sheds
Tags
Property features AI
Finance
- Financial info: Listing terms: Cash or Conventional
- HOA & community: Located in a senior community (Laurel Park Community); Manufactured home park amenities: common area, high-speed internet available; Land lease: $900
Exterior
- Parking: Carport
- Utilities: Electric energy source; Public water (community water company); Septic sewer; Power provided by PSE; Cable connection to be verified
- Home design: Manufactured double-wide home; One level; Residential property in a senior community (Laurel Park Community)
- Construction: Metal/vinyl construction materials; Metal roof; Concrete perimeter foundation; Manufactured (Make: Bendix)
- Exterior features: Patio/Porch/Deck; Metal/Vinyl exterior
Interior
- Kitchen: Dishwasher; Refrigerator; Stove/Range
- Bedrooms: 2 bedrooms
- Flooring: Laminate; Vinyl; Carpet
- Bathrooms: 1 full bathroom; 1 shower
- Heating & cooling: Heat pump for heating; Heat pump for cooling
- Interior features: Water heater; Electric fireplace
- Laundry & utility: Washer; Dryer; Water heater located outside by bathroom
Neighborhood map
What this means for you Summary
Snapshot
- This is a 2-bed/1.0-bath manufactured listed at $45k.
Deal economics
- At list price, monthly cash flow is $1k ($13k/yr) — positive.
- The deal already cash-flows at list — no discount required.
- Meets the 1% rule at list price ($2k rent vs $45k).
- Recommended offer: $44k (1.5% below list) — sets the bar for market timing.
- Cap rate 35.5% vs local median 2.7% in Tumwater — top-decile yield for the area; either an underpriced asset or a hidden risk that comps aren't pricing in. Stress-test before assuming the spread holds.
Location & tenants
- Location reads 84/100 on livability (#39 in WA, #700 nationally) — a professional / high-income tenant draw. Strengths: commute A+, housing A+, health & safety A+; Watch: amenities D, cost of living D-.
- Tumwater School District (urban): math 57% / reading 69% proficiency, ranked #37 of 291 in WA (top 13%) — acceptable for families but not a draw, mixed tenant base, ~2y average lease.
- Market conditions: Rents rising (+2.3%/yr); 233 active listings in the ZIP; 1 comparable units currently listed for rent nearby; solid renter incomes; 1,222 units permitted in Thurston County in 2024 (508 in 5+ unit buildings).
Forward outlook
- Local home prices are declining (-3.0%/yr); year-one equity from $311 of loan paydown is wiped out by about $1k of value loss. Plan a longer hold.
- Thurston County population projected at +27% by 2050 — long-run rental-demand tailwind backs the buy-and-hold thesis.
- At projected returns (-3.0% appreciation + 2.3% rent growth), your $13k cash investment doubles in ~2 years — after that, you're playing with house money.
Negotiation context
- It's been on market 24 days — a 2% lower offer ($44k) is reasonable based on typical stale-listing flexibility.
- 5 sale attempts since 6y ago with the ask held roughly flat each time — persistent listings suggest the price (not the market) is what's stuck; bring a comps-based counter.
Questions for the listing agent
- Built in 1972 — when were the roof, HVAC, electrical panel, plumbing, and water heater last replaced?
- Is there a deadline driving the sale (1031 exchange, divorce, estate, relocation)? That informs how much negotiation room exists.
- Schools are A-rated — typically a magnet for longer-tenancy family renters. What's the average tenant stay here, and is there a school-zone premium baked into asking?
- What's the average days-on-market for RENTAL listings here right now (not sales)? A rising rental-DOM trend means longer vacancies and softer asking-rent achievability than the comps imply.
- What's the recent tenant-quality profile in this submarket — average credit score on applications, eviction rate, late-payment / NSF rate, and stable-employment percentage? A property-management company in the area should have these aggregated.
- How much new for-sale + rental construction is in the pipeline within 1–3 miles? Heavy new supply typically softens prices + rents 12–24 months out; constrained supply supports both.
Investment metrics
- 1% rule
- 3.90% ✓
- Cap rate
- 35.52%
- Cash-on-cash
- 104.39%
- DSCR
- 5.64
- GRM
- 2.1
CMA / ARV
- ARV (on-the-fly)
- $45,360
- Comps found
- 2
Show comp detail 2 sales within ~0.75 mi
| Address | Dist | Beds/Ba | Sqft | Sold | Price | $/sf | Match |
|---|---|---|---|---|---|---|---|
| 3244 66th Ave SW #62 | 0.07mi | 2/1.0 | 756 (+5%) | 23mo | $39,500 | $52 | 69 |
| 3244 66th Ave SW #15 | 0.10mi | 2/1.0 | 800 (+11%) | 11mo | $50,000 | $63 | 68 |
Match score weights: distance 35% · size 25% · config 20% · recency 20%. Top-matched comps best support the ARV.
Projected returns pro-forma
-3.0% appreciation · 2.26% rent growth · sell at horizon
- IRR
- —
- Equity multiple
- 5.86×
- Total profit
- $61,239
- Equity at exit
- $6,710
- IRR
- —
- Equity multiple
- 11.96×
- Total profit
- $138,036
- Equity at exit
- $3,891
Cash invested: $12,600 (down + closing). Projections, not guarantees.
Landlord ↔ Tenant lean methodology
- Overall (STATE)
- 28 Tenant-Leaning
- State Washington
- 28 Tenant-Leaning · D+8
- County
- — inherits STATE
- City
- — inherits STATE
ZIP-level market 98512
- Rents YoY
- 2.3%
- Active inventory
- 233
- Price-to-rent
- 2.1×
Monthly cashflow live
- Estimated rent
- $1,753 medium interval (Pro) →
- Mortgage (P&I)
- −$236
- Tax from tax record
- −$34 /mo · $407/yr
- Insurance
- −$19
- HOA
- −$0
- Vacancy / Maint / Mgmt
- −$368
- Net cashflow
- $1,096
Break-even live
Sensitivity live
| Price | -10% $1,122 | -5% $1,109 | +0% $1,096 | +5% $1,083 | +10% $1,071 |
|---|---|---|---|---|---|
| Rent | -10% $958 | -5% $1,027 | +0% $1,096 | +5% $1,165 | +10% $1,235 |
| Rate | -1.0pp $1,119 | -0.5pp $1,108 | base $1,096 | +0.5pp $1,084 | +1.0pp $1,073 |
UW: 25.0% down · 7.5% · 30yr · 1.5% tax · 5.0% vac · 8.0% maint · 8.0% mgmt
Financing live
Cash to close
- Down payment
- $11,250
- Closing costs
- $1,350
- Reserves months
- —
- Total cash needed
- —
Loan-product check · same deal, 3 products live
Conventional
25% down · 7.5% · 30yr
- Down + closing
- —
- Monthly P&I
- —
- Monthly cashflow
- —
- DSCR
- —
- Eligible?
- —
Personal DTI + credit; lowest rate.
DSCR
20% down · 8.5% · 30yr
- Down + closing
- —
- Monthly P&I
- —
- Monthly cashflow
- —
- DSCR
- —
- Eligible?
- —
No personal income docs; deal must DSCR.
Hard money
10% down · 12.0% · 12mo
- Down + closing
- —
- Monthly P&I
- —
- Monthly cashflow
- —
- DSCR
- —
- Eligible?
- —
Short-term bridge; refi at stabilization.
Rent comps 1 comps
| Address | Beds | Baths | Sqft | Rent | $/sqft | DOM | Units | Dist |
|---|---|---|---|---|---|---|---|---|
| 1517 Bishop Rd SW Tumwater, WA | 2.0 | 1.0–2.0 | 669 | $1,930 | $2.88 | 14d | 1 | 1.38mi |
Listing history 32 events
-
2026-06-18days on market $45,000 Active 24 DOM
-
2026-06-17days on market $45,000 Active 23 DOM
-
2026-06-16days on market $45,000 Active 22 DOM
-
2026-06-15days on market $45,000 Active 21 DOM
-
2026-06-14days on market $45,000 Active 19 DOM
-
2026-06-13days on market $45,000 Active 18 DOM
-
2026-06-10days on market $45,000 Active 16 DOM
-
2026-06-09days on market $45,000 Active 15 DOM
-
2026-06-08days on market $45,000 Active 14 DOM
-
2026-06-07days on market $45,000 Active 13 DOM
-
2026-06-05days on market $45,000 Active 10 DOM
-
2026-06-02days on market $45,000 Active 8 DOM
-
2026-06-01days on market $45,000 Active 7 DOM
-
2026-05-31days on market $45,000 Active 6 DOM
-
2026-05-30days on market $45,000 Active 5 DOM
-
2023-09-06soldstatus $45,000 Closed
-
2023-08-23status Pending
-
2023-08-09price $55,000
-
2023-07-27price $60,000
-
2023-06-30status Active
-
2023-06-06status Pending
-
2023-04-08$65,000 Active
-
2021-01-27soldstatus $37,450 Sold
-
2021-01-19status Pending
-
2021-01-08status Pending Inspection
-
2021-01-05status Active
-
2020-12-29status Pending Inspection
-
2020-12-27price $39,950
-
2020-12-14price $44,950
-
2020-12-07price $54,950
-
2020-11-23price $59,950
-
2020-11-12$64,950 Active
ⓘ Source: listings_history table (triggers on properties + properties_extension) + one-shot
backfill from property_details.listing_events for pre-trigger history.
Tax reassessment forecast WA · Resets to sale price
- Current annual tax
- $407 · $34/mo
- Projected year-2 tax
- $441 · $37/mo
- Expected delta
- +$34/yr (+$3/mo · 8.3%)
ⓘ Screening estimate from a state-policy table — verify with the county assessor before closing.
Climate risk First Street
- Flood 1/10 Low FEMA zone X (unshaded) · 0% chance over 30 yrs
- Wildfire 4/10 Moderate
- Heat 3/10 Moderate 7 d/yr ≥88°F today · 14 d/yr by 30 yrs out
- Wind 1/10 Low
- Air quality 6/10 Major 6 unhealthy d/yr today · 6 by 30 yrs out
Nearby sold comps map
Loading sold comps map…
Walkable amenities ~0.75 mi
Loading nearby amenities…
Taxation est. · year 1
- Rental income
- $21,035
- − Mortgage interest
- −$2,521
- − Property taxes
- −$407
- − Insurance
- −$225
- − Repairs & maintenance
- −$1,683
- − Management
- −$1,683
- − Depreciation
- −$1,309
- Taxable income
- $13,207
- Est. tax owed @ 24.0%
- −$3,170
- After-tax cash flow
- $9,984/yr
For passive investors: Depreciation is non-cash, so a rental often shows a tax loss while cash-flowing — sheltering income. Rental losses are passive: they offset passive income freely, and up to $25,000/yr can offset ordinary (W-2) income if you actively participate and your MAGI is under $100k (phasing out to $0 by $150k); unused losses carry forward. On sale, claimed depreciation is recaptured at up to 25%, and gains may owe capital-gains tax (a 1031 exchange can defer both). Figures are a year-1 estimate at your 24.0% rate — not tax advice; consult a CPA.
Schools (NCES district)
- District
- Tumwater School District
- NCES district ID
- 5309100
- Math proficiency
- 57% ▬ 0.00%
- Reading proficiency
- 69% ▼ -1.00%
- Median HH income
- $64,209
- Composite
- 56.38/100
- National rank
- #2477
- State rank
- #37 of 291 in WA
Livability — Tumwater
- Score
- 84/100
- State rank
- #39
- US rank
- #700
Category grades
Schools grade is shown separately in the Schools card above.
Census & demographics
- Census place
- Tumwater, WA
- County
- Thurston County · 269,345 people
- City population
- 46,937
- Metro
- Olympia-Lacey-Tumwater, WA
- Population (ZIP)
- 31,864
- Household income
- $101,530
- Rent vs Own
- Severe rent burden
- 784.0
Population outlook (Thurston County) Hauer SSP2
- Today (2025)
- 308,239 people
- By 2030
- 326,483 · +5.9%
- By 2040
- 359,890 · +16.8%
- By 2050
- 391,800 · +27.1%
- By 2075
- 468,024 · +51.8%
- By 2100
- 519,890 · +68.7%
Race, ethnicity, and origin ACS 2023
- Neighborhood character
- Predominantly White (72%)
- Race & ethnicity
- White 72% Two or more races 13% Hispanic / Latino 9% Asian 4% Black 3% Native American 1%
- Hispanic origin (detail)
- Mexican 5%
- Common ancestry
- Portuguese 4% Italian 4% Slovak 4%
- Foreign-born
- 6% · Canada, Vietnam, China
- Languages at home
- 92% English-only · Spanish 3% Vietnamese 1% German/W. Germanic 1%
Political lean MEDSL · Thurston
- 2024 margin
- Strong D (+20.4) · D 58.5% · R 38.1% · Other 3.5%
- 2008→2024 swing
- -1.3pp toward R · 2008: 21.7pp · 2024: 20.4pp
- All cycles
- 2024: D+20.4 2020: D+18.6 2016: D+15.4 2012: D+19.0 2008: D+21.7
Not yet ingested
- Civics
- —
Market trends
- HPI YoY
- ▼ -348.18%
- Current HPI
- 347.121
- Rent YoY
- ▲ 2.26%
- Metro
- Olympia-Lacey-Tumwater, WA
- State GDP YoY
- ▲ 4.65%
- F500 in state
- 22
Industry mix (Fortune 500 HQ in WA)
| Industry | F500 HQs | Revenue |
|---|---|---|
| Retail | 2 | $269B |
|
||
| Technology / Retail | 1 | $638B |
|
||
| Technology | 1 | $245B |
|
||
| Telecommunications | 1 | $38B |
|
||
| Food / Beverage | 1 | $36B |
|
||
| Automotive / Trucks | 1 | $34B |
|
||
Price history
-30.7% since first listed18 events — show timeline
- 2026-05-25 Listed $45,000 NWMLS as Distributed by MLS Grid
- 2023-09-06 Sold (MLS) $45,000 NWMLS as Distributed by MLS Grid
- 2023-08-23 Pending — NWMLS as Distributed by MLS Grid
- 2023-08-09 Price Changed $55,000 NWMLS as Distributed by MLS Grid
- 2023-07-27 Price Changed $60,000 NWMLS as Distributed by MLS Grid
- 2023-06-30 Relisted — NWMLS as Distributed by MLS Grid
- 2023-06-06 Pending — NWMLS as Distributed by MLS Grid
- 2023-04-08 Listed $65,000 NWMLS as Distributed by MLS Grid
- 2021-01-27 Sold (MLS) $37,450 NWMLS as Distributed by MLS Grid
- 2021-01-19 Pending — NWMLS as Distributed by MLS Grid
- 2021-01-08 Pending — NWMLS as Distributed by MLS Grid
- 2021-01-05 Relisted — NWMLS as Distributed by MLS Grid
- 2020-12-29 Pending — NWMLS as Distributed by MLS Grid
- 2020-12-27 Price Changed $39,950 NWMLS as Distributed by MLS Grid
- 2020-12-14 Price Changed $44,950 NWMLS as Distributed by MLS Grid
- 2020-12-07 Price Changed $54,950 NWMLS as Distributed by MLS Grid
- 2020-11-23 Price Changed $59,950 NWMLS as Distributed by MLS Grid
- 2020-11-12 Listed $64,950 NWMLS as Distributed by MLS Grid
Property tax history
+9.1%/yrLatest (2025): $407 · +21.0% YoY. Source: county tax records.
Cash-flow waterfall
monthlySold comps — $/sqft
last 12 mo · ≤1 miLoading sold comps…