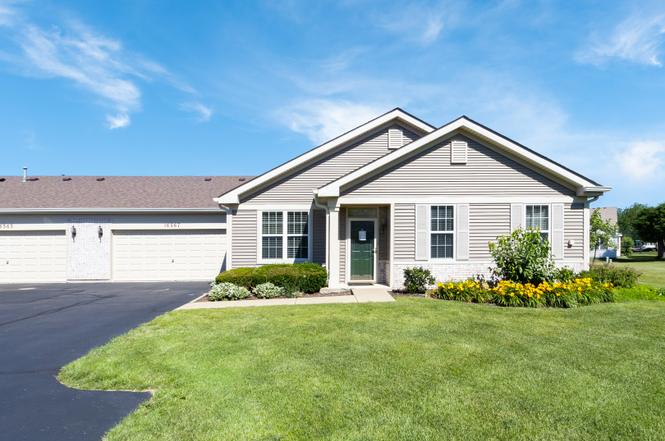
16567 Buckner Pond Way · Crest Hill, IL
Flood risk 1/10 · Minimal
- FEMA flood zone
- X (unshaded)
- Chance of flooding over 30 yrs
- 0.0%
- Est. flood insurance / yr
- $507 – $1,088
Fire risk 1/10 · Minimal
- Est. fire insurance / yr
- $804 – $1,492
Heat risk 4/10 · Minor
- Hot days now (above 102°F)
- 7 days/yr
- Hot days in 30 yrs
- 15 days/yr
Wind risk 2/10 · Minimal
- Chance of severe wind over 30 yrs
- 1.0%
Air-quality risk 2/10 · Minimal
- Unhealthy air days now
- 1 days/yr
- Unhealthy air days in 30 yrs
- 2 days/yr
Risk factors via First Street. Map © Google.
Why this score? — see what drove the D+ grade
The composite is a weighted blend of 9 inputs, each scored 0–100. Each bar is that input's sub-score; the figure is the points it added to the 100-point composite (weight × sub-score).
- Cash flow +15.9/30.0
- ARV discount +9.7/15.0
- 1% rule +6.1/10.0
- DSCR +4.9/10.0
- Livability +3.2/5.0
- Rent growth +2.5/5.0
- Condition / age +2.5/5.0
- Schools +2.2/10.0
- Appreciation +0.0/10.0
$240,000
🖨 Deal sheet (PDF) 📄 Offer letter ✓ Due diligence
Listing remarks
Welcome to Carillon Lakes, a premier 55+ active adult community where every day feels a little like a getaway. This ranch-style Ellison model offers comfortable single-level living with 2 bedrooms, 2 full baths, and a 2-car attached garage. The home features a spacious living and dining area, a kitchen with ceramic tile flooring, white cabinetry, a breakfast bar, pantry, and all appliances included. A separate laundry room and additional storage space add everyday convenience. The primary suite offers a large walk-in closet, two additional closets, and a private bath with dual sinks, soaking tub, and separate shower. A sliding glass door leads to a private patio, perfect for enjoying your m
Key facts
- Tennis
- Pickleball
- Private patio
Tags
Property features AI
Finance
- Other: Subdivision: Carillon Lakes; Located in Crest Hill (Lockport township); Lot dimensions approx. 59 x 45
- Financial info: Ownership: Fee simple with homeowners association; Special service area: No
- HOA & community: Monthly association fee of $473; HOA fee covers insurance, security, clubhouse, exercise facilities, pool, exterior maintenance, lawn care, scavenger and snow removal; Community amenities include exercise room, health club, golf course, on-site manager, park, party room, indoor pool, pool, tennis courts, spa/hot tub, clubhouse and picnic area; Manager off-site; Pets allowed (cats and dogs)
Exterior
- Parking: Attached garage with two garage spaces; Garage owned with garage door opener; Asphalt drive/parking
- Security: On-site guard at gated entrance (gate house access procedures for clubhouse)
- Utilities: Public water; Public sewer; Electric service with circuit breakers and 100 amp service
- Home design: Attached single property; Townhouse - ranch model (Ellison); One entry level; Located in an adult community with commuter train and interstate access
- Construction: Approximately 16-20 years old; Vinyl siding and brick exterior; Asphalt roof; Concrete perimeter foundation
- Exterior features: Patio; Common grounds; Landscaped lot
Interior
- Kitchen: Range; Microwave; Dishwasher; Refrigerator; Eating area with breakfast bar; Island; Pantry closet
- Bedrooms: Master bedroom on main level with full bath including double sink, tub and separate shower; Additional bedroom on main level (11 x 14)
- Flooring: Carpet in living areas and bedrooms; Ceramic tile in kitchen and laundry; Laminate flooring noted
- Bathrooms: Two full bathrooms
- Heating & cooling: Natural gas forced-air heating; Central air conditioning
- Interior features: First-floor bedroom; First-floor full bathroom; Walk-in closets; Ceiling fan(s); 5 total rooms
- Laundry & utility: Main-level laundry (washer and dryer included)
Neighborhood map
What this means for you Summary
Snapshot
- This is a 2-bed/2.0-bath townhouse listed at $240k.
Deal economics
- At list price, monthly cash flow is $112 ($1k/yr) — positive.
- The deal already cash-flows at list — no discount required.
- Meets the 1% rule at list price ($3k rent vs $240k).
- Cap rate 6.9% vs local median 5.2% in Crest Hill — top-decile yield for the area; either an underpriced asset or a hidden risk that comps aren't pricing in. Stress-test before assuming the spread holds.
Location & tenants
- Location reads 63/100 on livability (#792 in IL) — a middle-class / working-renter tenant base. Strengths: cost of living A+, housing A+, crime A-; Watch: amenities F, commute F, health & safety F.
- Richland GSD 88A (suburban): math 25% / reading 25% proficiency, ranked #326 of 620 in IL (top 53%) — low school quality limits family demand, transient renter base, plan for 1-2y turnover.
- Zoned schools: Richland Elem School (math 24% / reading 24%, grade F, #850 of 2,056 statewide, top 45%, 800 students, 0% FRL); Lockport Township High Sch East (math 35% / reading 38%, grade F, #117 of 693 statewide, top 17%, 3,872 students, 0% FRL) — zoned schools average 0% FRL vs 45% district-wide (45 pts lower); this property's tenant base skews higher-income than the district average.
- Market conditions: 37 active listings in the ZIP; 5 comparable units currently listed for rent nearby; rentals leasing fast (median 1d on market — plan ~1-2 weeks tenant-placement turnaround); 2,028 units permitted in Will County in 2024 (530 in 5+ unit buildings).
Forward outlook
- Local home prices are declining (-3.0%/yr); year-one equity from $2k of loan paydown is wiped out by about $7k of value loss. Plan a longer hold.
- Will County population projected to shrink 4% by 2050 — rents likely to lag national; underwrite the cash flow, not the appreciation.
Negotiation context
- Only 4 days on market — expect competitive offers; lowballing is unlikely to land.
- 2 sale attempts since 2y ago with the ask held roughly flat each time — persistent listings suggest the price (not the market) is what's stuck; bring a comps-based counter.
Questions for the listing agent
- What does the HOA fee cover, when was the last increase, and are there any pending special assessments or reserve-fund shortfalls?
- Is there a deadline driving the sale (1031 exchange, divorce, estate, relocation)? That informs how much negotiation room exists.
- Schools are F-rated, which usually means shorter tenancies and higher turnover. Who's the typical renter profile here, and what's been the actual vacancy rate?
- The area grade is low — what's the realistic commute time and amenity access for the typical tenant pool here? Any planned neighborhood developments (good or bad) we should know about?
- What's the average days-on-market for RENTAL listings here right now (not sales)? A rising rental-DOM trend means longer vacancies and softer asking-rent achievability than the comps imply.
- What's the recent tenant-quality profile in this submarket — average credit score on applications, eviction rate, late-payment / NSF rate, and stable-employment percentage? A property-management company in the area should have these aggregated.
- How much new for-sale + rental construction is in the pipeline within 1–3 miles? Heavy new supply typically softens prices + rents 12–24 months out; constrained supply supports both.
Investment metrics
- 1% rule
- 1.11% ✓
- Cap rate
- 6.85%
- Cash-on-cash
- 2.00%
- DSCR
- 1.09
- GRM
- 7.5
CMA / ARV
- ARV (on-the-fly)
- $252,525
- Comps found
- 12
Show comp detail 12 sales within ~0.75 mi
| Address | Dist | Beds/Ba | Sqft | Sold | Price | $/sf | Match |
|---|---|---|---|---|---|---|---|
| 16613 Buckner Pond Way | 0.12mi | 2/2.0 | 1,263 (-2%) | 4mo | $242,500 | $192 | 87 |
| 16501 Buckner Pond Way #16501 | 0.18mi | 2/2.0 | 1,330 (+3%) | 1mo | $271,000 | $204 | 86 |
| 16459 Buckner Pond Way | 0.21mi | 2/2.0 | 1,330 (+3%) | 4mo | $270,000 | $203 | 83 |
| 21253 Legion Lake Ct | 0.10mi | 2/2.0 | 1,373 (+6%) | 5mo | $255,000 | $186 | 81 |
| 16400 Crescent Lake Dr #16400 | 0.42mi | 2/2.0 | 1,295 (0%) | 6mo | $244,000 | $188 | 75 |
| 16346 Crescent Lake Dr | 0.45mi | 2/2.0 | 1,330 (+3%) | 3mo | $261,000 | $196 | 72 |
| 16134 Powderhorn Lake Way | 0.60mi | 2/2.0 | 1,292 (-0%) | 3mo | $269,000 | $208 | 69 |
| 16242 Tomahawk Lake Ct | 0.53mi | 2/2.0 | 1,380 (+7%) | 2mo | $250,000 | $181 | 62 |
| 21471 Lake St Clair Dr | 0.64mi | 2/2.0 | 1,257 (-3%) | 5mo | $242,000 | $193 | 61 |
| 21456 Wolf Lake Way #0 | 0.72mi | 2/2.0 | 1,330 (+3%) | 1mo | $260,000 | $195 | 61 |
| 21522 Lake St Clair Dr | 0.68mi | 2/2.0 | 1,373 (+6%) | 4mo | $265,000 | $193 | 55 |
| 21533 Papoose Lake Ct | 0.65mi | 2/1.0 | 1,380 (+7%) | 0mo | $270,000 | $196 | 55 |
Match score weights: distance 35% · size 25% · config 20% · recency 20%. Top-matched comps best support the ARV.
Projected returns pro-forma
-3.0% appreciation · 3.0% rent growth · sell at horizon
- IRR
- -13.0%
- Equity multiple
- 0.53×
- Total profit
- $-31,497
- Equity at exit
- $35,785
- IRR
- -3.8%
- Equity multiple
- 0.74×
- Total profit
- $-17,227
- Equity at exit
- $20,751
Cash invested: $67,200 (down + closing). Projections, not guarantees.
Landlord ↔ Tenant lean methodology
- Overall (STATE)
- 43 Moderately Tenant-Leaning
- State Illinois
- 43 Moderately Tenant-Leaning · D+7
- County
- — inherits STATE
- City
- — inherits STATE
ZIP-level market 60403
- Active inventory
- 37
- Price-to-rent
- 7.5×
Monthly cashflow live
- Estimated rent
- $2,663 high interval (Pro) →
- Mortgage (P&I)
- −$1,259
- Tax from tax record
- −$160 /mo · $1,920/yr
- Insurance
- −$100
- HOA
- −$473
- Vacancy / Maint / Mgmt
- −$559
- Net cashflow
- $112
Break-even live
Sensitivity live
| Price | -10% $248 | -5% $180 | +0% $112 | +5% $44 | +10% $-24 |
|---|---|---|---|---|---|
| Rent | -10% $-98 | -5% $7 | +0% $112 | +5% $217 | +10% $323 |
| Rate | -1.0pp $233 | -0.5pp $173 | base $112 | +0.5pp $50 | +1.0pp $-13 |
UW: 25.0% down · 7.5% · 30yr · 1.5% tax · 5.0% vac · 8.0% maint · 8.0% mgmt
Financing live
Cash to close
- Down payment
- $60,000
- Closing costs
- $7,200
- Reserves months
- —
- Total cash needed
- —
Loan-product check · same deal, 3 products live
Conventional
25% down · 7.5% · 30yr
- Down + closing
- —
- Monthly P&I
- —
- Monthly cashflow
- —
- DSCR
- —
- Eligible?
- —
Personal DTI + credit; lowest rate.
DSCR
20% down · 8.5% · 30yr
- Down + closing
- —
- Monthly P&I
- —
- Monthly cashflow
- —
- DSCR
- —
- Eligible?
- —
No personal income docs; deal must DSCR.
Hard money
10% down · 12.0% · 12mo
- Down + closing
- —
- Monthly P&I
- —
- Monthly cashflow
- —
- DSCR
- —
- Eligible?
- —
Short-term bridge; refi at stabilization.
Rent comps 5 comps
| Address | Beds | Baths | Sqft | Rent | $/sqft | DOM | Units | Dist |
|---|---|---|---|---|---|---|---|---|
| 16340 Crescent Lake Dr Crest Hill, IL | 2.0 | 2.0 | 1332 | $2,700 | $2.03 | 5d | 1 | 0.49mi |
| 2513 Sumac Dr Joliet, IL | 2.0 | 2.5 | 1424 | $2,450 | $1.72 | 0d | 1 | 0.96mi |
| 700 S Weber Rd Romeoville, IL | 3.0 | 1.0–2.0 | 977 | $3,305 | $3.38 | 0d | 1 | 1.19mi |
| 2303 Greengold St Crest Hill, IL | 3.0 | 1.0 | 950 | $1,900 | $2.00 | 0d | 1 | 1.35mi |
| 2430 Caton Crest Ct Crest Hill, IL | 3.0 | 2.5 | 1551 | $2,900 | $1.87 | 18d | 1 | 1.45mi |
HOA detail
- Monthly dues
- $473 · $5,676/yr
Listing history 3 events
-
2026-06-21days on market $240,000 Active 4 DOM
-
2026-06-18remarks 699-char remark
-
2026-06-18$240,000 Active 1 DOM
ⓘ Source: listings_history table (triggers on properties + properties_extension) + one-shot
backfill from property_details.listing_events for pre-trigger history.
Tax reassessment forecast IL · Partial reset (capped growth)
- Current annual tax
- $1,920 · $160/mo
- Projected year-2 tax
- $3,684 · $307/mo
- Expected delta
- +$1,764/yr (+$147/mo · 91.9%)
ⓘ Screening estimate from a state-policy table — verify with the county assessor before closing.
Climate risk First Street
- Flood 1/10 Low FEMA zone X (unshaded) · 0% chance over 30 yrs
- Wildfire 1/10 Low
- Heat 4/10 Moderate 7 d/yr ≥102°F today · 15 d/yr by 30 yrs out
- Wind 2/10 Low 100% chance of damaging wind over 30 yrs
- Air quality 2/10 Low 1 unhealthy d/yr today · 2 by 30 yrs out
Nearby sold comps map
Loading sold comps map…
Walkable amenities ~0.75 mi
Loading nearby amenities…
Taxation est. · year 1
- Rental income
- $31,957
- − Mortgage interest
- −$13,444
- − Property taxes
- −$1,920
- − Insurance
- −$1,200
- − Repairs & maintenance
- −$2,557
- − Management
- −$2,557
- − HOA
- −$5,676
- − Depreciation
- −$6,982
- Taxable loss
- −$2,378
- Est. tax savings @ 24.0%
- +$571
- After-tax cash flow
- $1,918/yr
For passive investors: Depreciation is non-cash, so a rental often shows a tax loss while cash-flowing — sheltering income. Rental losses are passive: they offset passive income freely, and up to $25,000/yr can offset ordinary (W-2) income if you actively participate and your MAGI is under $100k (phasing out to $0 by $150k); unused losses carry forward. On sale, claimed depreciation is recaptured at up to 25%, and gains may owe capital-gains tax (a 1031 exchange can defer both). Figures are a year-1 estimate at your 24.0% rate — not tax advice; consult a CPA.
Schools (NCES district)
- District
- Richland GSD 88A
- NCES district ID
- 1733450
- Math proficiency
- 25% ▼ -1.00%
- Reading proficiency
- 25% ▼ -13.00%
- Median HH income
- $48,906
- Composite
- 21.96/100
- National rank
- #8217
- State rank
- #326 of 620 in IL
Livability — Crest Hill
- Score
- 63/100
- State rank
- #792
- US rank
- #15733
Category grades
Schools grade is shown separately in the Schools card above.
Census & demographics
- Census place
- Crest Hill, IL
- City population
- 17,226
- Population (ZIP)
- 17,226
Population outlook (Will County) Hauer SSP2
- Today (2025)
- 705,368 people
- By 2030
- 708,154 · +0.4%
- By 2040
- 702,692 · -0.4%
- By 2050
- 680,249 · -3.6%
- By 2075
- 611,990 · -13.2%
- By 2100
- 516,215 · -26.8%
Race, ethnicity, and origin ACS 2023
- Neighborhood character
- Diverse neighborhood (Simpson 0.64)
- Race & ethnicity
- White 52% Hispanic / Latino 26% Black 14% Two or more races 13% Asian 3%
- Hispanic origin (detail)
- Mexican 22%
- Common ancestry
- Romanian 7% Lithuanian 2% Subsaharan African 1%
- Foreign-born
- 12% · Canada, South Korea
- Languages at home
- 76% English-only · Spanish 16% Russian/Polish/Slavic 2% Tagalog/Filipino 2%
Political lean MEDSL · Will
- 2024 margin
- Toss-up / Even · D 50.1% · R 48.5% · Other 1.4%
- 2008→2024 swing
- -11.6pp toward R · 2008: 13.2pp · 2024: 1.6pp
- All cycles
- 2024: D+1.6 2020: D+8.3 2016: D+5.7 2012: D+3.7 2008: D+13.2
Not yet ingested
- Civics
- —
Market trends
- HPI YoY
- ▼ -136.15%
- Current HPI
- 205.702
- Rent YoY
- —
- Metro
- —
- State GDP YoY
- ▲ 1.59%
- F500 in state
- 60
Industry mix (Fortune 500 HQ in IL)
| Industry | F500 HQs | Revenue |
|---|---|---|
| Insurance | 4 | $201B |
|
||
| Consumer Goods | 4 | $87B |
|
||
| Industrial Machinery | 3 | $64B |
|
||
| Healthcare | 2 | $55B |
|
||
| Retail / Pharmacy | 1 | $148B |
|
||
| Agriculture / Food | 1 | $86B |
|
||
Price history
3 events — show timeline
- 2026-06-16 Listed $240,000 MRED as Distributed by MLS Grid
- 2024-11-01 Listing Removed — MRED as Distributed by MLS Grid
- 2024-09-17 Listed — MRED as Distributed by MLS Grid
Property tax history
-3.0%/yrLatest (2024): $1,920 · -5.7% YoY. Source: county tax records.
Cash-flow waterfall
monthlySold comps — $/sqft
last 12 mo · ≤1 miLoading sold comps…