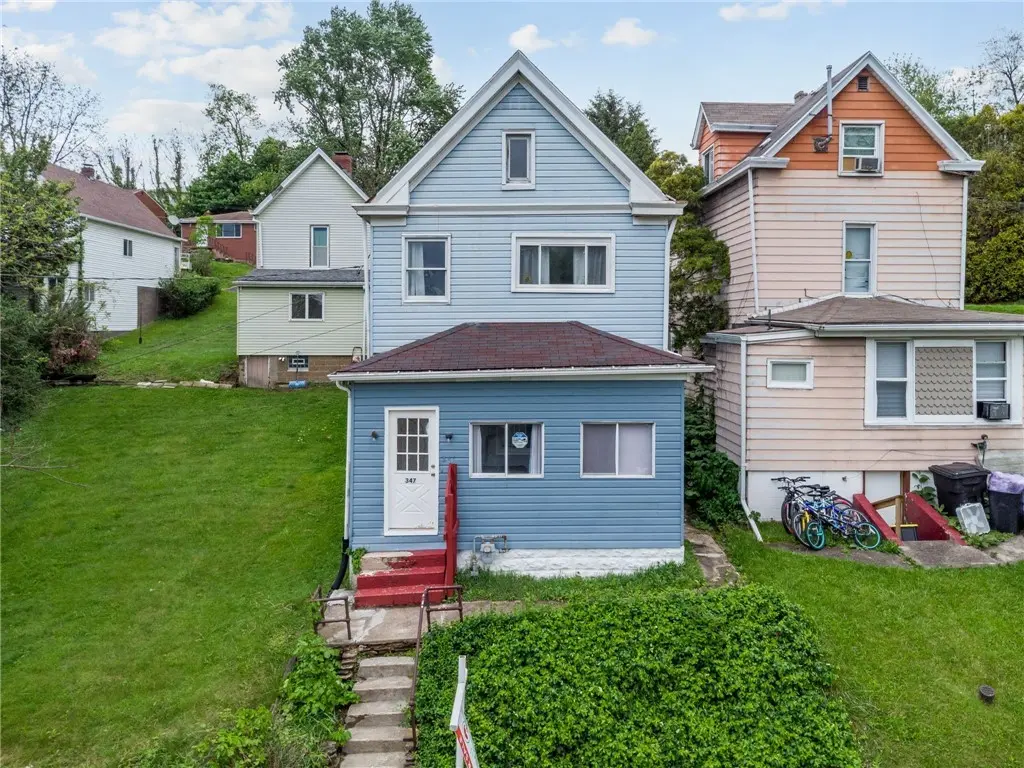
347 Grove St · East McKeesport, PA
Flood risk 1/10 · Minimal
- FEMA flood zone
- X (unshaded)
- Chance of flooding over 30 yrs
- 0.0%
- Est. flood insurance / yr
- $473 – $860
Fire risk 1/10 · Minimal
- Est. fire insurance / yr
- $511 – $949
Heat risk 3/10 · Minor
- Hot days now (above 96°F)
- 7 days/yr
- Hot days in 30 yrs
- 17 days/yr
Wind risk 2/10 · Minimal
- Chance of severe wind over 30 yrs
- 0.0%
Air-quality risk 4/10 · Minor
- Unhealthy air days now
- 5 days/yr
- Unhealthy air days in 30 yrs
- 7 days/yr
Risk factors via First Street. Map © Google.
Why this score? — see what drove the B- grade
The composite is a weighted blend of 9 inputs, each scored 0–100. Each bar is that input's sub-score; the figure is the points it added to the 100-point composite (weight × sub-score).
- Cash flow +24.9/30.0
- ARV discount +15.0/15.0
- DSCR +8.1/10.0
- 1% rule +7.0/10.0
- Livability +3.5/5.0
- Appreciation +3.2/10.0
- Rent growth +2.5/5.0
- Condition / age +2.5/5.0
- Schools +1.8/10.0
$83,500
🖨 Deal sheet (PDF) 📄 Offer letter ✓ Due diligence
Listing remarks MLS
Opportunity knocks! Whether you're a first-time buyer looking for the perfect starter home, or you're an investor looking for a turnkey opportunity, you've just found your place. This home has been well-maintained. The interior was recently painted, and the furnace and air conditioner are only 2-3 years old and there's also off-street parking. This adorable little gem is tucked off the beaten path in East McKeesport where you're close to the Route 30 and 48 corridors, but there's no noise or traffic here!
Key facts
- Off street parking
- Close to route 30
- Close to route 48
Tags
Neighborhood map
What this means for you Summary
Snapshot
- This is a 2-bed/1.0-bath single-family listed at $84k.
Deal economics
- At list price, monthly cash flow is $179 ($2k/yr) — positive.
- The deal already cash-flows at list — no discount required.
- Meets the 1% rule at list price ($998 rent vs $84k).
- Recommended offer: $81k (3.0% below list) — sets the bar for market timing.
Location & tenants
- Location reads 70/100 on livability (#752 in PA) — a middle-class / working-renter tenant base. Strengths: cost of living A+, housing A+, crime B; Watch: employment D+, amenities F, commute F.
- East Allegheny SD (suburban): math 14% / reading 30% proficiency, ranked #485 of 539 in PA (top 90%) — low school quality limits family demand, transient renter base, plan for 1-2y turnover.
- Market conditions: 20 active listings in the ZIP; 12 comparable units currently listed for rent nearby; rentals at typical pace (median 18d on market — plan ~3-4 weeks tenant-placement turnaround); 2,996 units permitted in Allegheny County in 2024 (1,588 in 5+ unit buildings).
Forward outlook
- Local home prices are declining (-3.0%/yr); year-one equity from $577 of loan paydown is wiped out by about $3k of value loss. Plan a longer hold.
Negotiation context
- It's been on market 58 days — a 3% lower offer ($81k) is reasonable based on typical stale-listing flexibility.
- 8 sale attempts since 28y ago; this cycle's ask has dropped $11k (12%) from the opening price — seller is motivated, your offer sets the floor, not the list.
- Current owner paid $22k; list at $84k implies a 280% gain — meaningful room to come down on a strong offer.
Risks & watch-outs
- Watch-outs: built in 1940 — expect roof / HVAC / electrical / plumbing capex.
Questions for the listing agent
- It's been on market 58 days. Have you received any prior offers? Is the seller open to a 3% concession, seller financing, or rate buy-down credit?
- Built in 1940 — when were the roof, HVAC, electrical panel, plumbing, and water heater last replaced?
- Is there a deadline driving the sale (1031 exchange, divorce, estate, relocation)? That informs how much negotiation room exists.
- What's the average days-on-market for RENTAL listings here right now (not sales)? A rising rental-DOM trend means longer vacancies and softer asking-rent achievability than the comps imply.
- What's the recent tenant-quality profile in this submarket — average credit score on applications, eviction rate, late-payment / NSF rate, and stable-employment percentage? A property-management company in the area should have these aggregated.
- How much new for-sale + rental construction is in the pipeline within 1–3 miles? Heavy new supply typically softens prices + rents 12–24 months out; constrained supply supports both.
Investment metrics
- 1% rule
- 1.20% ✓
- Cap rate
- 8.87%
- Cash-on-cash
- 9.19%
- DSCR
- 1.41
- GRM
- 7.0
CMA / ARV
- ARV (median comp)
- $133,652
- List price
- $83,500
- Delta
- -37.52%
- Verdict
- UNDERPRICED
- Comps
- 20 within 1.0 mi
Show comp detail 12 sales within ~0.75 mi
| Address | Dist | Beds/Ba | Sqft | Sold | Price | $/sf | Match |
|---|---|---|---|---|---|---|---|
| 320 Mystic Ave | 0.04mi | 3/1.5 (+1) | 1,050 (-1%) | 4mo | $85,000 | $81 | 86 |
| 583 Helena St | 0.08mi | 3/1.0 (+1) | 1,056 (-1%) | 8mo | $135,000 | $128 | 83 |
| 633 3rd St | 0.36mi | 3/1.5 (+1) | 1,072 (+1%) | 2mo | $175,000 | $163 | 73 |
| 498 Taylor | 0.57mi | 3/1.5 (+1) | 1,068 (+0%) | 1mo | $220,000 | $206 | 64 |
| 801 Broadway Ave | 0.25mi | 3/1.0 (+1) | 1,144 (+8%) | 10mo | $92,000 | $80 | 62 |
| 384 Valley Ave | 0.67mi | 2/1.0 | 1,078 (+1%) | 8mo | $59,000 | $55 | 60 |
| 454 A St | 0.67mi | 3/1.0 (+1) | 1,086 (+2%) | 2mo | $56,000 | $52 | 58 |
| 2634 3rd St | 0.60mi | 2/1.0 | 980 (-8%) | 4mo | $74,000 | $76 | 56 |
| 635 Larimer Ave | 0.62mi | 3/2.0 (+1) | 1,100 (+3%) | 4mo | $165,000 | $150 | 53 |
| 300 Taylor St | 0.65mi | 3/1.5 (+1) | 1,120 (+5%) | 5mo | $167,000 | $149 | 50 |
| 1110 Melrose Ave | 0.63mi | 2/1.0 | 970 (-9%) | 8mo | $32,500 | $34 | 49 |
| 518 Glenn St | 0.36mi | 3/1.0 (+1) | 1,216 (+14%) | 8mo | $110,000 | $90 | 48 |
Match score weights: distance 35% · size 25% · config 20% · recency 20%. Top-matched comps best support the ARV.
Projected returns pro-forma
-3.0% appreciation · 3.0% rent growth · sell at horizon
- IRR
- -2.4%
- Equity multiple
- 0.91×
- Total profit
- $-2,093
- Equity at exit
- $12,450
- IRR
- 7.4%
- Equity multiple
- 1.56×
- Total profit
- $13,002
- Equity at exit
- $7,220
Cash invested: $23,380 (down + closing). Projections, not guarantees.
Landlord ↔ Tenant lean methodology
- Overall (STATE)
- 62 Landlord-Friendly
- State Pennsylvania
- 62 Landlord-Friendly · EVEN
- County
- — inherits STATE
- City
- — inherits STATE
ZIP-level market 15035
- Home prices YoY
- -1.4%
- Active inventory
- 20
- Price-to-rent
- 7.0×
Monthly cashflow live
- Estimated rent
- $998 high interval (Pro) →
- Mortgage (P&I)
- −$438
- Tax from tax record
- −$137 /mo · $1,640/yr
- Insurance
- −$35
- HOA
- −$0
- Vacancy / Maint / Mgmt
- −$210
- Net cashflow
- $179
Break-even live
Sensitivity live
| Price | -10% $226 | -5% $203 | +0% $179 | +5% $155 | +10% $132 |
|---|---|---|---|---|---|
| Rent | -10% $100 | -5% $140 | +0% $179 | +5% $218 | +10% $258 |
| Rate | -1.0pp $221 | -0.5pp $200 | base $179 | +0.5pp $157 | +1.0pp $135 |
UW: 25.0% down · 7.5% · 30yr · 1.5% tax · 5.0% vac · 8.0% maint · 8.0% mgmt
Financing live
Cash to close
- Down payment
- $20,875
- Closing costs
- $2,505
- Reserves months
- —
- Total cash needed
- —
Loan-product check · same deal, 3 products live
Conventional
25% down · 7.5% · 30yr
- Down + closing
- —
- Monthly P&I
- —
- Monthly cashflow
- —
- DSCR
- —
- Eligible?
- —
Personal DTI + credit; lowest rate.
DSCR
20% down · 8.5% · 30yr
- Down + closing
- —
- Monthly P&I
- —
- Monthly cashflow
- —
- DSCR
- —
- Eligible?
- —
No personal income docs; deal must DSCR.
Hard money
10% down · 12.0% · 12mo
- Down + closing
- —
- Monthly P&I
- —
- Monthly cashflow
- —
- DSCR
- —
- Eligible?
- —
Short-term bridge; refi at stabilization.
Rent comps 12 comps
| Address | Beds | Baths | Sqft | Rent | $/sqft | DOM | Units | Dist |
|---|---|---|---|---|---|---|---|---|
| 569 Woodmont Ave Unit C East McKeesport, PA | 2.0 | 1.0 | 1000 | $1,000 | $1.00 | 17d | 1 | 0.22mi |
| 569 Woodmont Ave Apt B East McKeesport, PA | 2.0 | 1.0 | 1000 | $1,200 | $1.20 | 17d | 1 | 0.22mi |
| 210 Westinghouse Ave Unit 210-D Wilmerding, PA | 2.0 | 1.0 | 800 | $999 | $1.25 | 44d | 1 | 0.39mi |
| 210 Westinghouse Ave Unit 210-E Wilmerding, PA | 2.0 | 1.0 | 800 | $999 | $1.25 | 15d | 1 | 0.39mi |
| 450 Card Ave Unit 1 Wilmerding, PA | 1.0 | 1.0 | 900 | $700 | $0.78 | 24d | 1 | 0.42mi |
| 215 Grant St Wall, PA | 2.0 | 2.5 | 960 | $750 | $0.78 | 44d | 1 | 0.44mi |
| 930 Punta Gorda Ave Unit 1 East McKeesport, PA | 1.0 | 1.0 | 700 | $750 | $1.07 | 3d | 1 | 0.45mi |
| 165 State St Wilmerding, PA | 3.0 | 1.0 | 1100 | $995 | $0.90 | 17d | 1 | 0.49mi |
| 1806 Greensburg Ave North Versailles Township, PA | 1.0–2.0 | 1.0 | 750 | $1,015 | $1.35 | 2d | 10 | 0.89mi |
| 200 Delaware Ave North Versailles, PA | 3.0 | 1.5 | 1470 | $1,450 | $0.99 | 15d | 1 | 1.07mi |
| 400 Greensburg Pike North Versailles, PA | 3.0 | 1.0 | 1324 | $1,250 | $0.94 | 44d | 1 | 1.12mi |
| 1615 Lynn Ave Unit 2 Turtle Creek, PA | 2.0 | 1.0 | 1100 | $1,145 | $1.04 | 44d | 1 | 1.38mi |
Listing history 27 events
-
2026-06-18days on market $83,500 Active 58 DOM
-
2026-06-17days on market $83,500 Active 57 DOM
-
2026-06-16days on market $83,500 Active 56 DOM
-
2026-06-15days on market $83,500 Active 55 DOM
-
2026-06-13days on market $83,500 Active 53 DOM
-
2026-06-09days on market $83,500 Active 49 DOM
-
2026-06-08pricedays on market $83,500 Active 48 DOM
-
2026-06-07days on market $89,900 Active 47 DOM
-
2026-06-03days on market $89,900 Active 43 DOM
-
2026-06-02days on market $89,900 Active 42 DOM
-
2026-06-01days on market $89,900 Active 41 DOM
-
2026-05-31days on market $89,900 Active 40 DOM
-
2026-05-08price $89,900 510-char remark
Show marketing remark (510 chars)
Opportunity knocks! Whether you're a first-time buyer looking for the perfect starter home, or you're an investor looking for a turnkey opportunity, you've just found your place. This home has been well-maintained. The interior was recently painted, and the furnace and air conditioner are only 2-3 years old and there's also off-street parking. This adorable little gem is tucked off the beaten path in East McKeesport where you're close to the Route 30 and 48 corridors, but there's no noise or traffic here!
-
2026-04-21$94,900 Active 510-char remark
Show marketing remark (510 chars)
Opportunity knocks! Whether you're a first-time buyer looking for the perfect starter home, or you're an investor looking for a turnkey opportunity, you've just found your place. This home has been well-maintained. The interior was recently painted, and the furnace and air conditioner are only 2-3 years old and there's also off-street parking. This adorable little gem is tucked off the beaten path in East McKeesport where you're close to the Route 30 and 48 corridors, but there's no noise or traffic here!
-
2025-10-30historical Expired 610-char remark
Show marketing remark (610 chars)
Opportunity knocks! If you're looking to grow your portfolio, you've just found your next place. This home has been well-maintained. The interior was recently painted, and the furnace and air conditioner are only 2-3 years old. There's off-street parking, and the street is quiet despite its close proximity to the Route 30 corridor. The cherry on top is that the tenant is in place until next year with a lease that includes tenant paying for utilities, responsible for lawn care and snow removal making this a true turnkey, cash flowing opportunity for some lucky investor. Don't let opportunity pass you by!
-
2025-09-03price $79,750 610-char remark
Show marketing remark (610 chars)
Opportunity knocks! If you're looking to grow your portfolio, you've just found your next place. This home has been well-maintained. The interior was recently painted, and the furnace and air conditioner are only 2-3 years old. There's off-street parking, and the street is quiet despite its close proximity to the Route 30 corridor. The cherry on top is that the tenant is in place until next year with a lease that includes tenant paying for utilities, responsible for lawn care and snow removal making this a true turnkey, cash flowing opportunity for some lucky investor. Don't let opportunity pass you by!
-
2025-08-21$87,900 Active 610-char remark
Show marketing remark (610 chars)
Opportunity knocks! If you're looking to grow your portfolio, you've just found your next place. This home has been well-maintained. The interior was recently painted, and the furnace and air conditioner are only 2-3 years old. There's off-street parking, and the street is quiet despite its close proximity to the Route 30 corridor. The cherry on top is that the tenant is in place until next year with a lease that includes tenant paying for utilities, responsible for lawn care and snow removal making this a true turnkey, cash flowing opportunity for some lucky investor. Don't let opportunity pass you by!
-
2014-04-16$34,900
-
2012-03-26$39,950
-
2011-11-16$45,900
-
2011-02-10$45,900
-
2006-09-26soldstatus $22,000
-
2006-01-16$29,900
-
1998-06-29soldstatus $35,800
-
1998-06-26soldstatus $35,800
-
1998-02-28$36,900
-
1974-07-01soldstatus $15,500
ⓘ Source: listings_history table (triggers on properties + properties_extension) + one-shot
backfill from property_details.listing_events for pre-trigger history.
Tax reassessment forecast PA · Partial reset (capped growth)
- Current annual tax
- $1,640 · $137/mo
- Projected year-2 tax
- $1,640 · $137/mo
- Expected delta
- $0/yr ($0/mo · 0.0%)
ⓘ Screening estimate from a state-policy table — verify with the county assessor before closing.
Climate risk First Street
- Flood 1/10 Low FEMA zone X (unshaded) · 0% chance over 30 yrs
- Wildfire 1/10 Low
- Heat 3/10 Moderate 7 d/yr ≥96°F today · 17 d/yr by 30 yrs out
- Wind 2/10 Low 0% chance of damaging wind over 30 yrs
- Air quality 4/10 Moderate 5 unhealthy d/yr today · 7 by 30 yrs out
Nearby sold comps map
Loading sold comps map…
Walkable amenities ~0.75 mi
Loading nearby amenities…
Taxation est. · year 1
- Rental income
- $11,975
- − Mortgage interest
- −$4,677
- − Property taxes
- −$1,640
- − Insurance
- −$418
- − Repairs & maintenance
- −$958
- − Management
- −$958
- − Depreciation
- −$2,429
- Taxable income
- $895
- Est. tax owed @ 24.0%
- −$215
- After-tax cash flow
- $1,934/yr
For passive investors: Depreciation is non-cash, so a rental often shows a tax loss while cash-flowing — sheltering income. Rental losses are passive: they offset passive income freely, and up to $25,000/yr can offset ordinary (W-2) income if you actively participate and your MAGI is under $100k (phasing out to $0 by $150k); unused losses carry forward. On sale, claimed depreciation is recaptured at up to 25%, and gains may owe capital-gains tax (a 1031 exchange can defer both). Figures are a year-1 estimate at your 24.0% rate — not tax advice; consult a CPA.
Schools (NCES district)
- District
- East Allegheny SD
- NCES district ID
- 4208060
- Math proficiency
- 14% ▼ -13.00%
- Reading proficiency
- 30% ▼ -19.00%
- Median HH income
- $38,748
- Composite
- 18.44/100
- National rank
- #8930
- State rank
- #485 of 539 in PA
Livability — East McKeesport
- Score
- 70/100
- State rank
- #752
- US rank
- #7504
Category grades
Schools grade is shown separately in the Schools card above.
Census & demographics
- Census place
- East McKeesport, PA
- City population
- 2,063
- Population (ZIP)
- 2,063
Population outlook (Allegheny County) Hauer SSP2
- Today (2025)
- 1,250,282 people
- By 2030
- 1,256,482 · +0.5%
- By 2040
- 1,256,318 · +0.5%
- By 2050
- 1,244,169 · -0.5%
- By 2075
- 1,197,693 · -4.2%
- By 2100
- 1,093,187 · -12.6%
Race, ethnicity, and origin ACS 2023
- Neighborhood character
- Predominantly White (85%)
- Race & ethnicity
- White 85% Black 9% Two or more races 6%
- Common ancestry
- Romanian 20% Serbian 1% Slovak 1%
- Foreign-born
- 0%
Political lean MEDSL · Allegheny
- 2024 margin
- Strong D (+20.3) · D 59.7% · R 39.4%
- 2008→2024 swing
- +4.8pp toward D · 2008: 15.5pp · 2024: 20.3pp
- All cycles
- 2024: D+20.3 2020: D+20.4 2016: D+16.4 2012: D+14.4 2008: D+15.5
Not yet ingested
- Civics
- —
Market trends
- HPI YoY
- ▼ -3.52%
- Current HPI
- 254.3099
- Rent YoY
- —
- Metro
- —
- State GDP YoY
- ▲ 1.68%
- F500 in state
- 34
Industry mix (Fortune 500 HQ in PA)
| Industry | F500 HQs | Revenue |
|---|---|---|
| Healthcare | 2 | $309B |
|
||
| Insurance | 2 | $27B |
|
||
| Telecommunications / Media | 1 | $124B |
|
||
| Industrial Distribution | 1 | $22B |
|
||
| Financial Services | 1 | $20B |
|
||
| Chemicals / Materials | 1 | $18B |
|
||
Price history
+480.0% since first listed15 events — show timeline
- 2026-05-08 Price Changed $89,900 West Penn MLS
- 2026-04-21 Listed $94,900 West Penn MLS
- 2025-10-30 Delisted — West Penn MLS
- 2025-09-03 Price Changed $79,750 West Penn MLS
- 2025-08-21 Listed $87,900 West Penn MLS
- 2014-04-16 Listed $34,900 West Penn MLS
- 2012-03-26 Listed $39,950 West Penn MLS
- 2011-11-16 Listed $45,900 West Penn MLS
- 2011-02-10 Listed $45,900 West Penn MLS
- 2006-09-26 Sold (MLS) $22,000 West Penn MLS
- 2006-01-16 Listed $29,900 West Penn MLS
- 1998-06-29 Sold (Public Records) $35,800 Public Records
- 1998-06-26 Sold (MLS) $35,800 West Penn MLS
- 1998-02-28 Listed $36,900 West Penn MLS
- 1974-07-01 Sold (Public Records) $15,500 Public Records
Property tax history
+1.5%/yrLatest (2026): $1,640 · +0.0% YoY. Source: county tax records.
Cash-flow waterfall
monthlySold comps — $/sqft
last 12 mo · ≤1 miLoading sold comps…